It’s that time of year when the prognosticators foretell the future. I don’t really give a rat’s arse about what they think; however, it’s interesting they are all so similar except for RBC. Maybe they are reading each other’s mail.
Here’s what their targets are for the S&P500 next year:
- 2,300…….. Bank of America
- 2,325…….. Canaccord
- 2,350…….. Deutsche Bank
- 2,200…….. Goldman Sachs
- 2,325…….. Jefferies
- 2,300…….. JPMorgan… (*by early 2017)
- 2,300…….. Morgan Stanley
- 2,400…….. Societe Generale
- 2,300…….. UBS
- And finally, RBC is predicting double digit earnings for equities.
That’s roughly a consensus of about a 4% gain for the year in the S&P500 Index.
What do we do with this information? I guess you just hope they are right if you are never going to sell.
Looking through my lens, the price chart of the S&P500 Index signals all systems are “go”.
S&P 500 Index (SPX) weekly

Major US indexes are making new highs and there is no reason we can’t go higher. Risk is still under primary support (see chart).
***Trade Alert…
Alibaba Group (BABA) weekly

This has been pretty volatile since it went public. Please be aware of this.
With that said, this looks like a good entry. Two weeks ago price traded below trend line support during the week and closed the week above trend line support…this is bullish. Price has remained above trend line support for the past seven trading days.
RISK LEVELS:
Risk is under trend line support. Risk/Reward looks good. First target is 107. Risk is around 90.
On my radar…
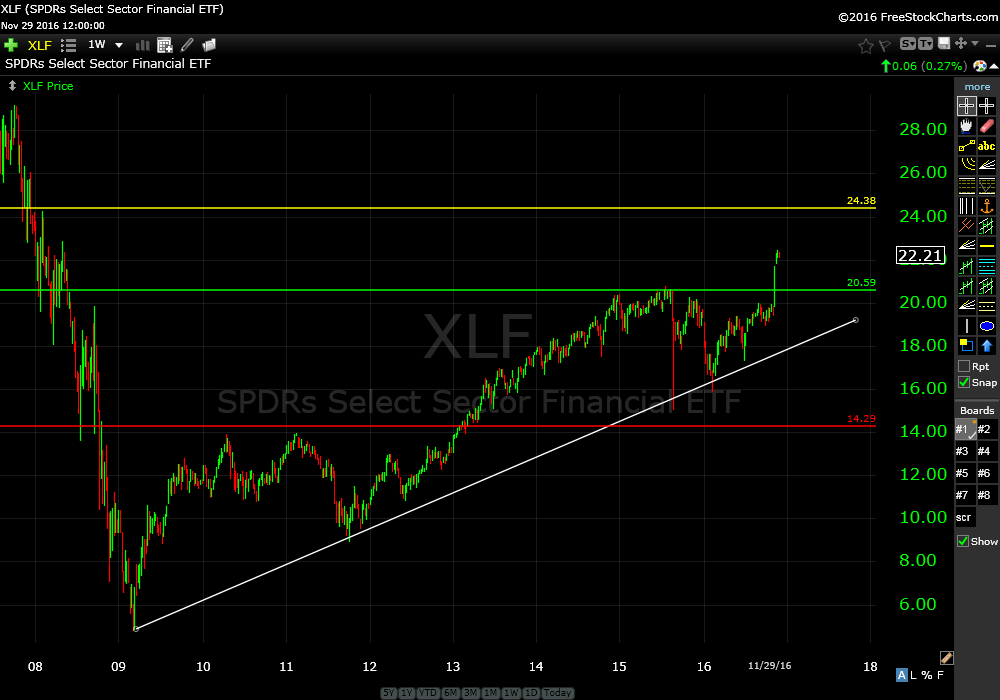
Financials are looking interesting. XLF, the financial sector ETF has recently broken above the 2015 highs. This momentum trade has an initial target of $24. Risk is under the 2015 high at about $20.
Financial Sector ETF (XLF) weekly
On another note…
I encourage you share any ETF’s or equities that you find that might fit my methodology. Just submit them here. I will review them and share with everyone if they fit my framework. **Submitting members will receive one month free for every ETF or stock I recommend to premium members.
By the way…
I believe the growth of world wide debt is Wimpy’s fault.

Hahahahaha! Yes, I laugh at my own stupid jokes.
Trade Smart,
Don