Smart Chart Investor

Beyond Buy and Hold: Using Technical Analysis to Reduce the Risk of Long-term Investing

  • Member Login

250% Bull Market

March 7, 2017 by Don Roth

This bull is eight years old today returning over 250% from the bottom. The Dow, S&P 500 index, Nasdaq and Russell 2000 continue to make new highs.

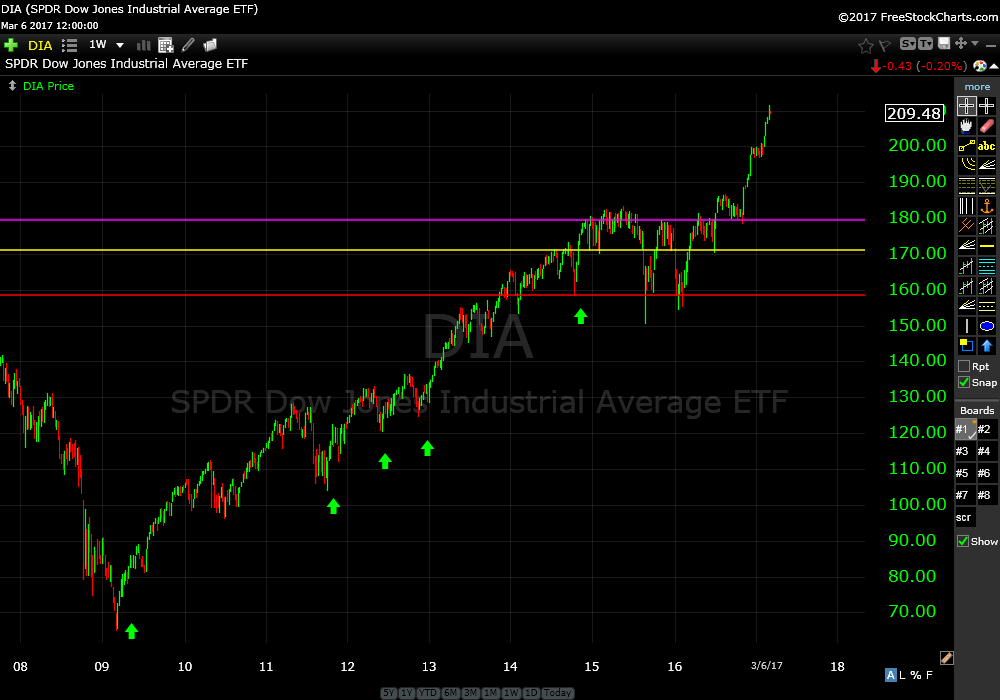
Dow Jones Industrial Average ETF (DIA) weekly

DIA 2017_3_6 w
(click chart to enlarge)

​​​​​​​

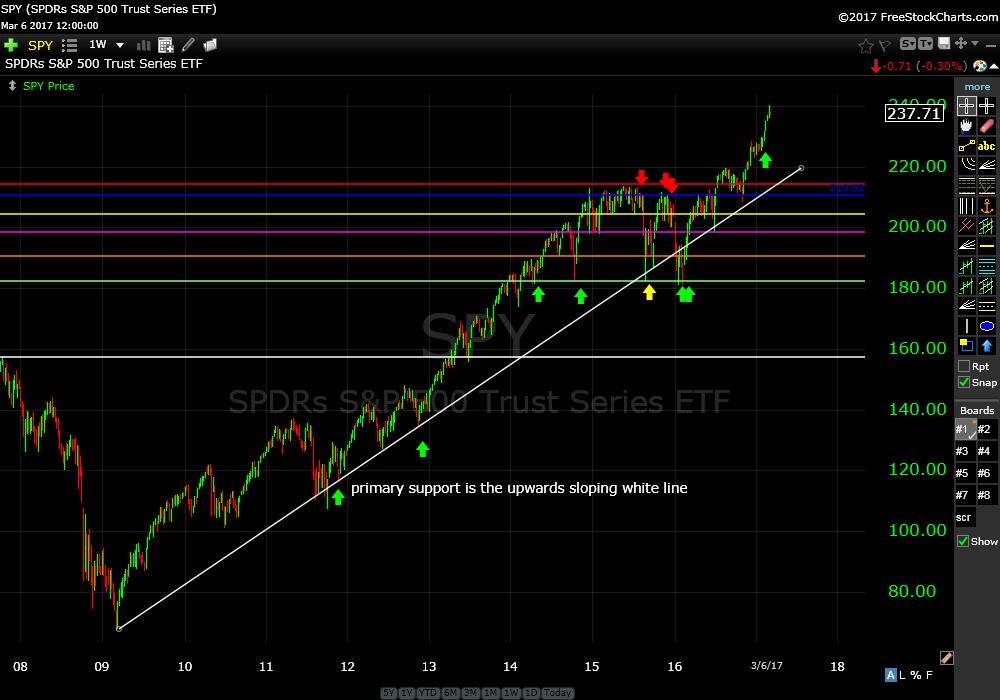
S&P 500 Index ETF (SPY) weekly
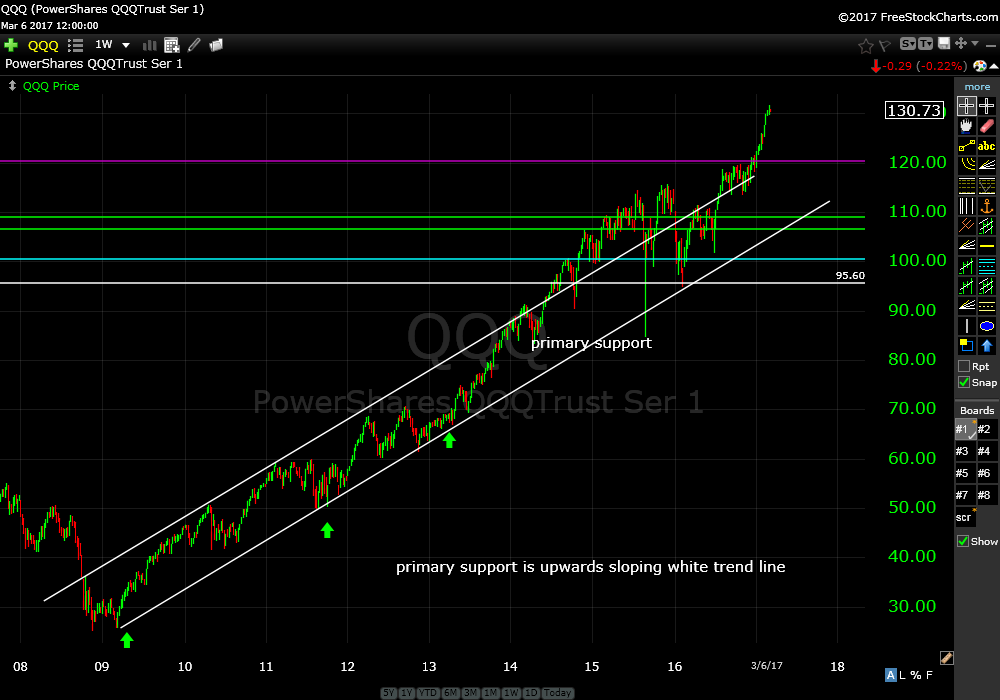
SPY 2017_3_6 w
(click chart to enlarge)

Nasdaq (QQQ) weekly

QQQ 2017_3_6 w
(click chart to enlarge)

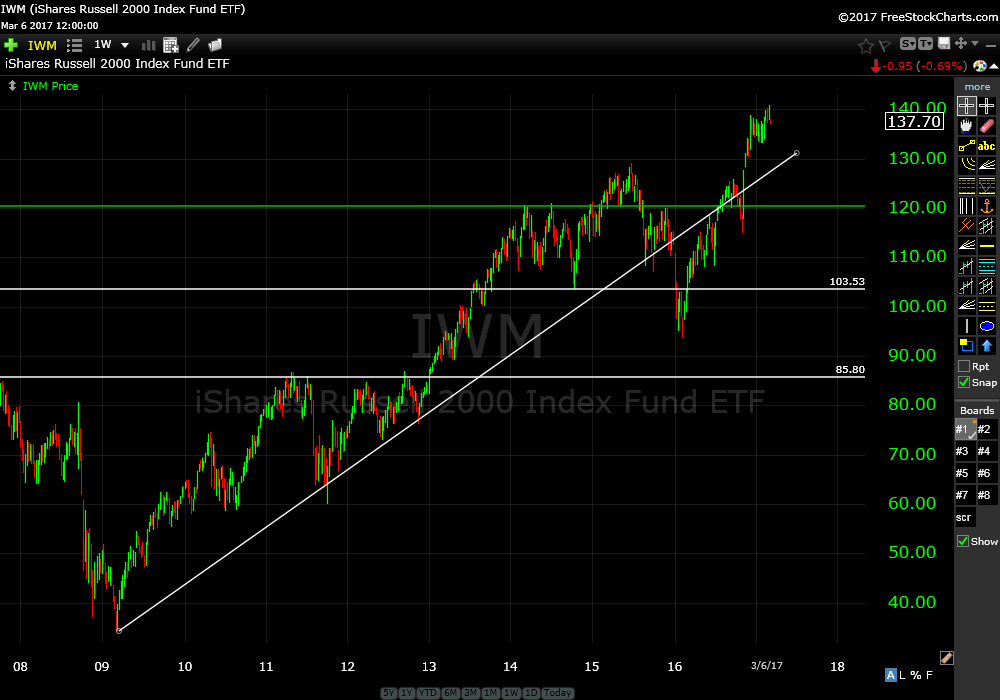
Russell 2000 Index Fund ETF (IWM) weekly

IWM 2017_3_6 w
(click chart to enlarge)

Prices do feel lofty at these levels but these indexes are only up about 10% in the past two years and most of that gain just occurred in the past four months.

So, now what?

Continue to hold open positions.

As long as we are trading above primary support this bull will continue running.

It sure feels like we need a pullback but remember…feelings don’t count in investing.

Trade Smart,

Don

RECENT MARKET UPDATES

  • Blow Off Top?
  • Major Announcement!
  • Trade Alert (BE)
  • Important Notice
  • Weekly Market Commentary and Pre Announcement
Go to Members Home

Don Roth

Don Roth, Smart Chart Investor

Recent Market Updates

  • Blow Off Top?
  • Major Announcement!
  • Trade Alert (BE)
  • Important Notice
  • Weekly Market Commentary and Pre Announcement

Copyright © 2011–2026 · Smart Chart Trading, Inc · Privacy Policy · Terms of Use · Disclosure Information · Log in