We really have to look at the monthly chart of SPY to see the magnitude of the drop this month, er, three weeks. One more week to go yet. Price has gone from above the rising channel from 2009 to practically the bottom in very short order.
S&P500 Index ETF (SPY)
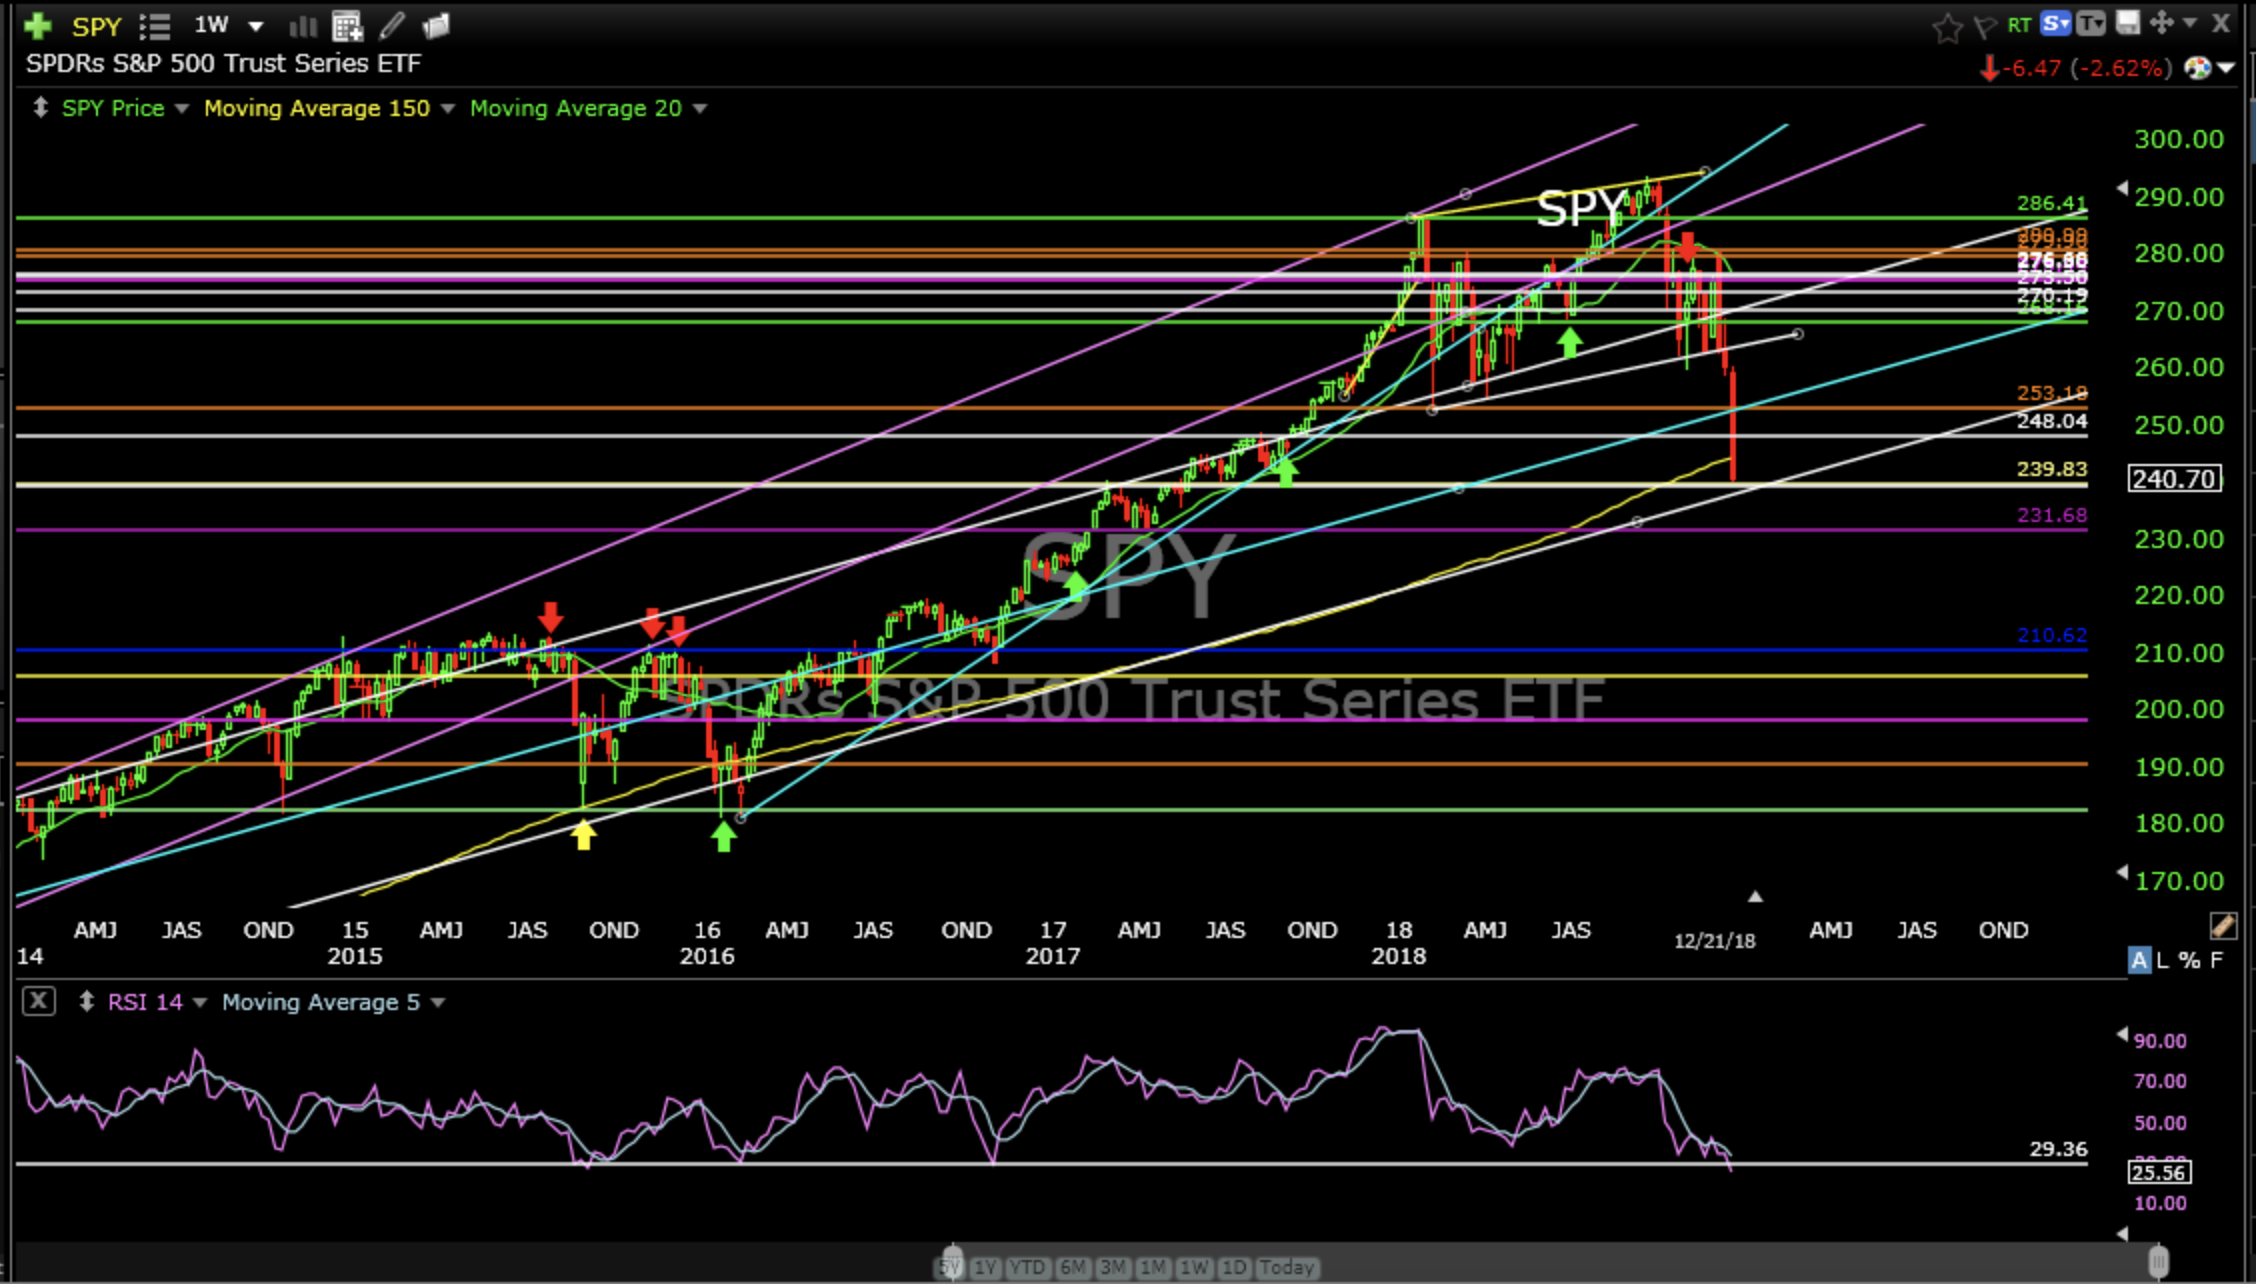
So far, the third worst December since 1900. Stunned is probably the best way to describe it. The selling is relentless. Just steady and heavy selling into any slight uptick. Not panic but a thick blanket of fear permeates the markets.
The level (primary support) SPY has fallen to is very important. Not that the levels we ripped through last week weren’t important but if primary support which is right below price is taken out this will signal further deterioration in price and likely the end of the current bull market. It it doesn’t bottom in here look out below. If it does that would make perfect sense as this is a strong support level. For this level to break requires no buyers, no confidence. That would be bad.
What worries me is Nasdaq (QQQ).
Nasdaq (QQQ)
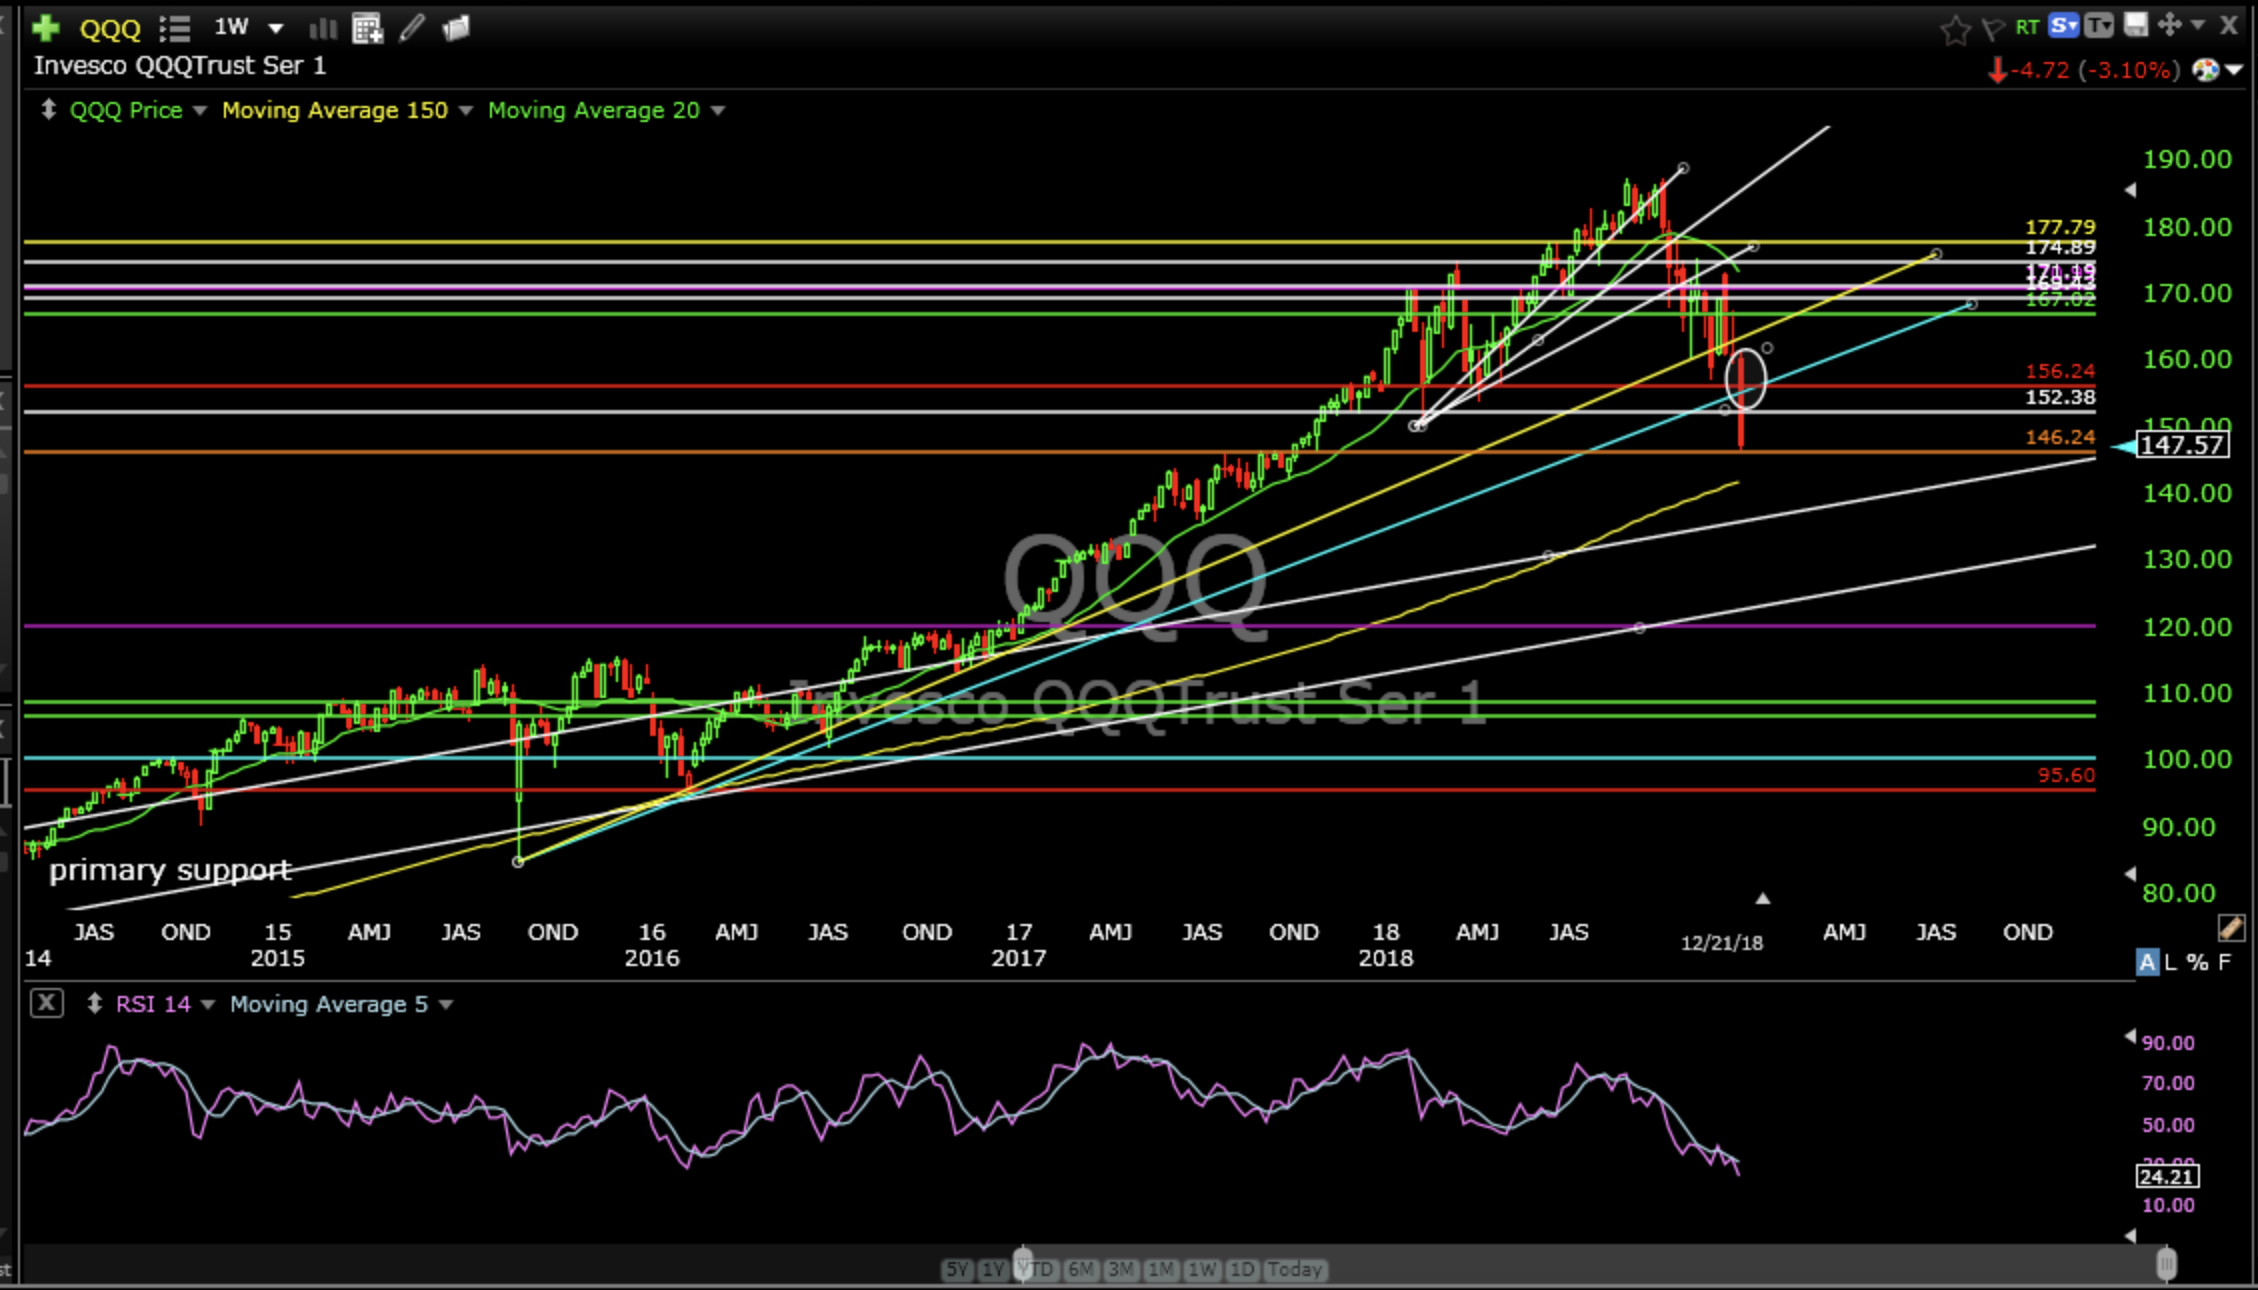
QQQ has no decent support that I can see now that we blew through the earlier lows of 2018. The only way this can be turned into a positive is if price closes the month above 156.10, the weekly closing low of 2018 from February 2018. This is highly unlikely.
I’m not sure how SPY is going to hold when QQQ has no real support until about 136 which is 7% below Friday’s close. SPY is less than 1% above rising primary support. For SPY to hold support QQQ is going to have to bottom at rather weak support. This makes me a little more nervous about SPY holding. If it begins to breakdown then I would recommend further reduction in exposure.
A look at the individual sectors…
The Consumer Staples Sector ETF (XLP)
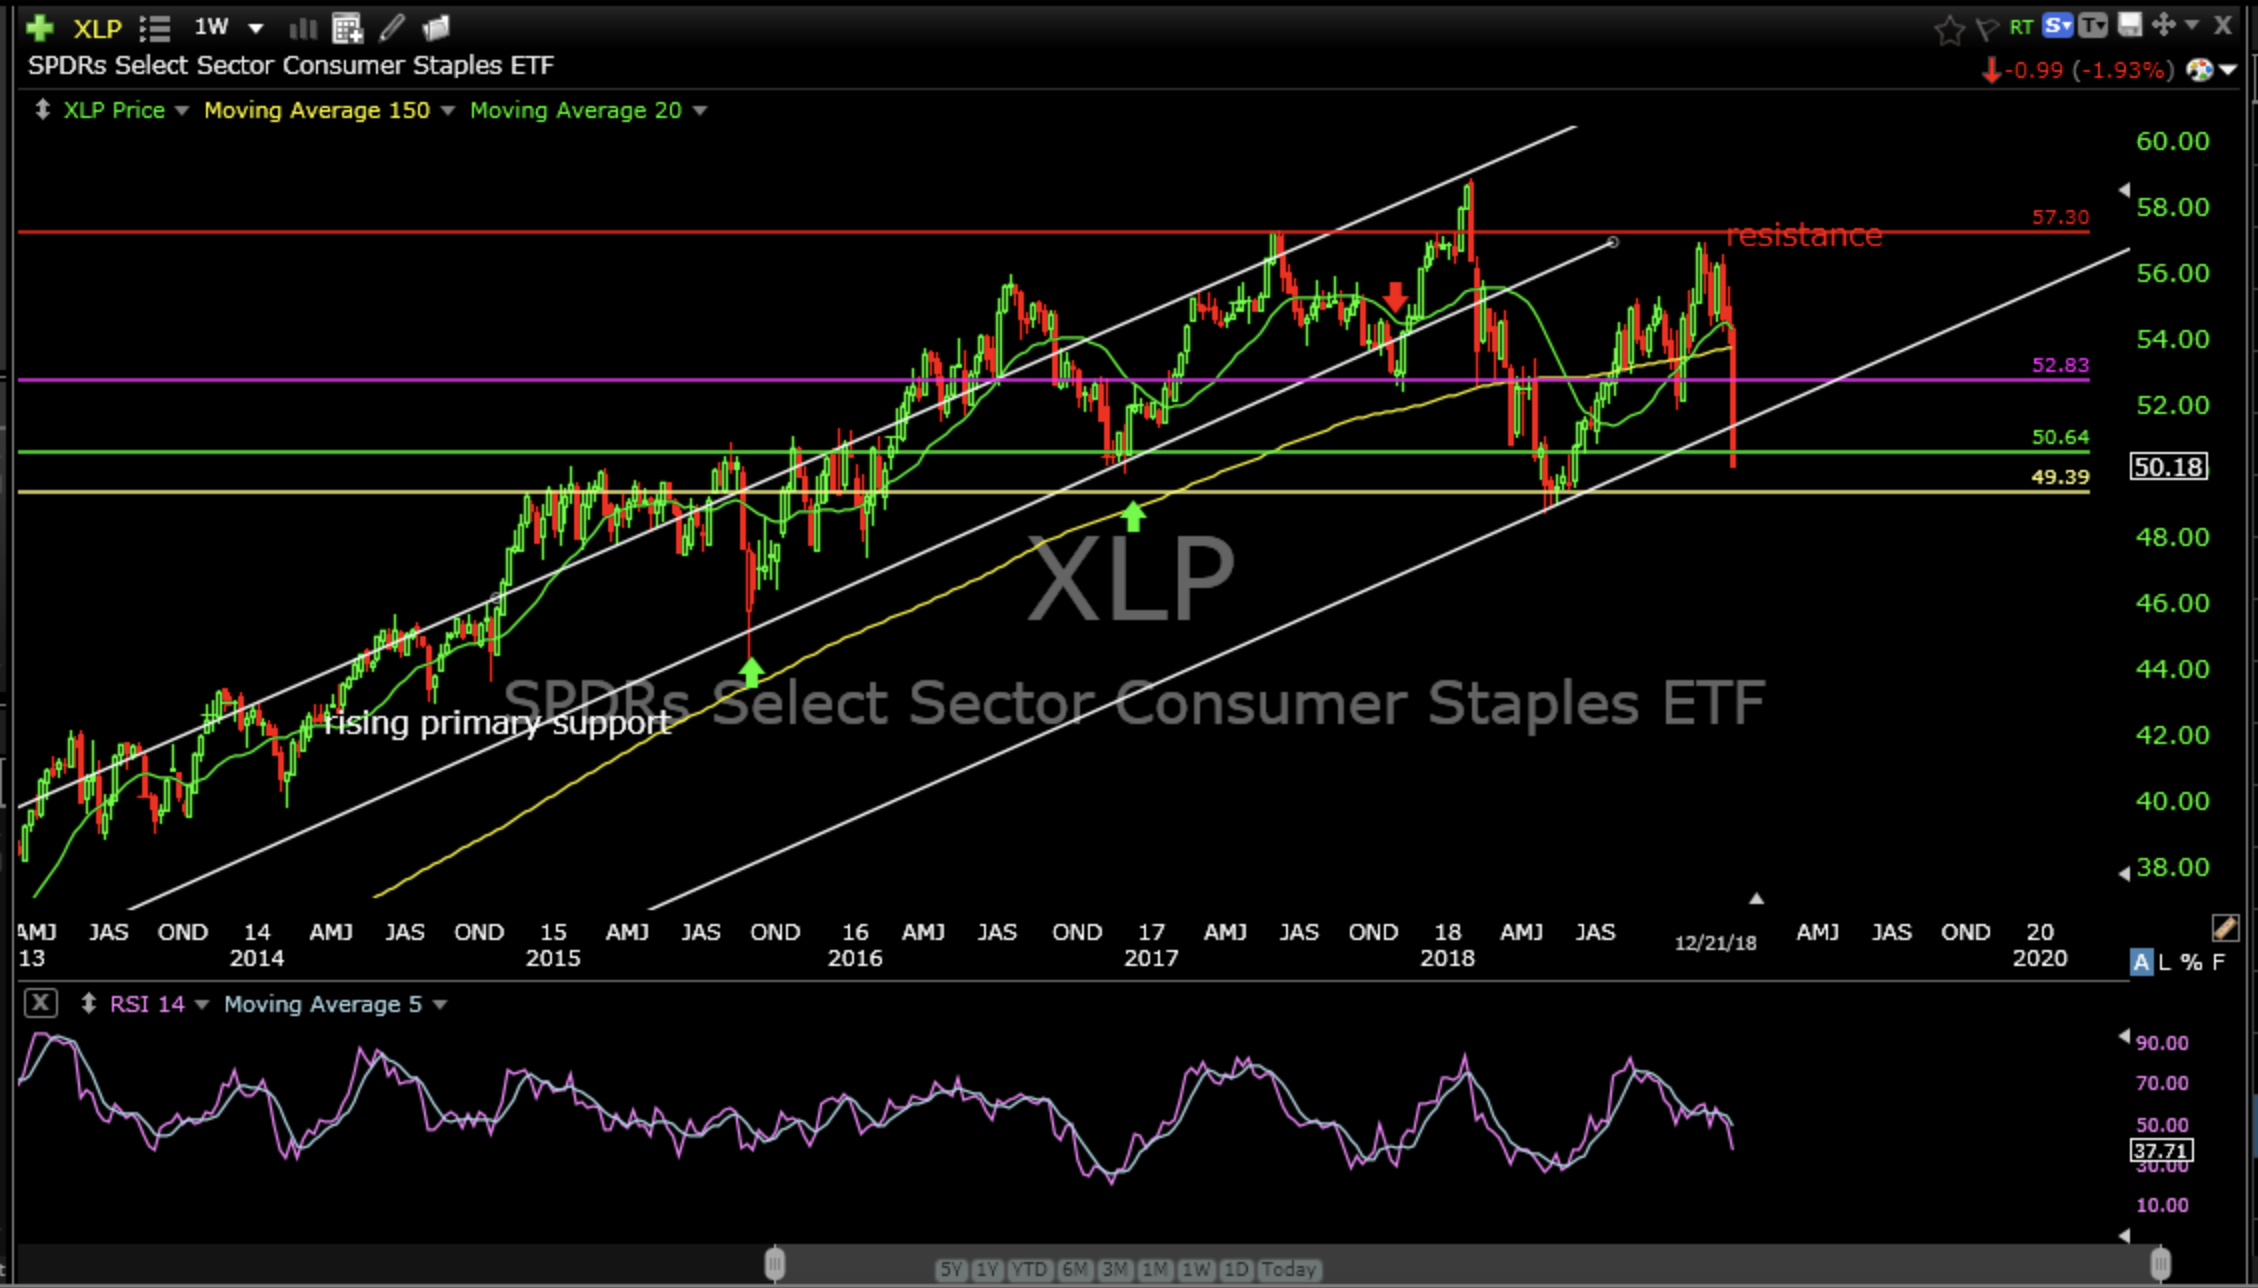
The Consumer Staples Sector ETF (XLP) broke primary support in October 2017 when I recommended selling it. It recovered for most of 2018 but just failed miserably last week breaking a secondary support level and closing just above a tight range that price traded in during most of 2015 into 2016.
The Industrial Sector ETF (XLI)
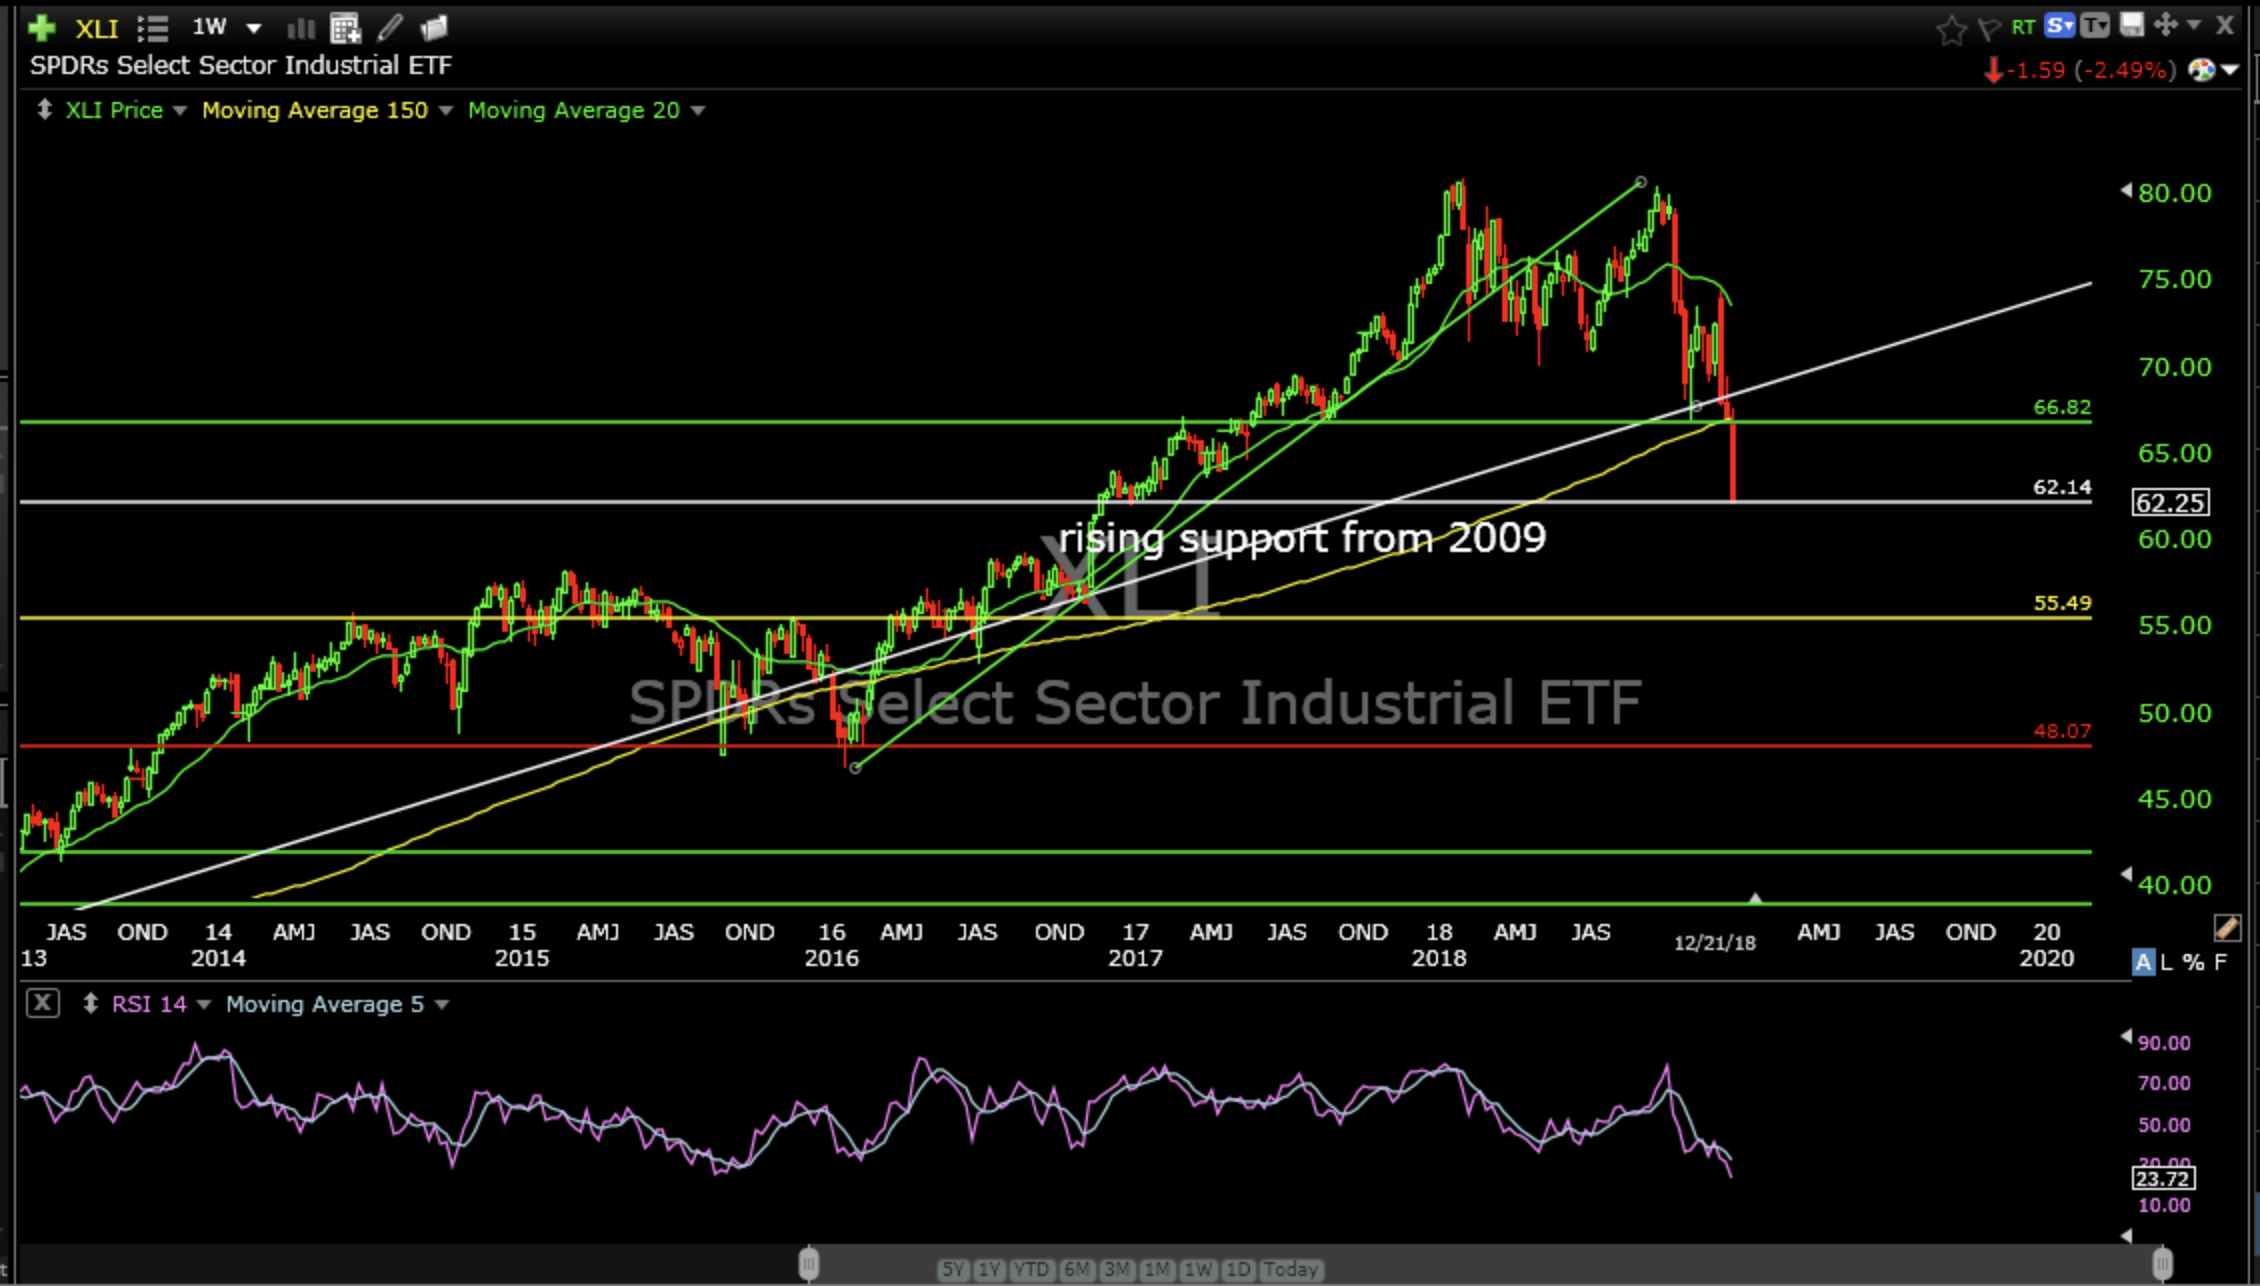
The Industrial Sector ETF (XLI) has now broken rising primary support with no real visible support until about 15% below Friday’s close.
The Materials Sector ETF (XLB)
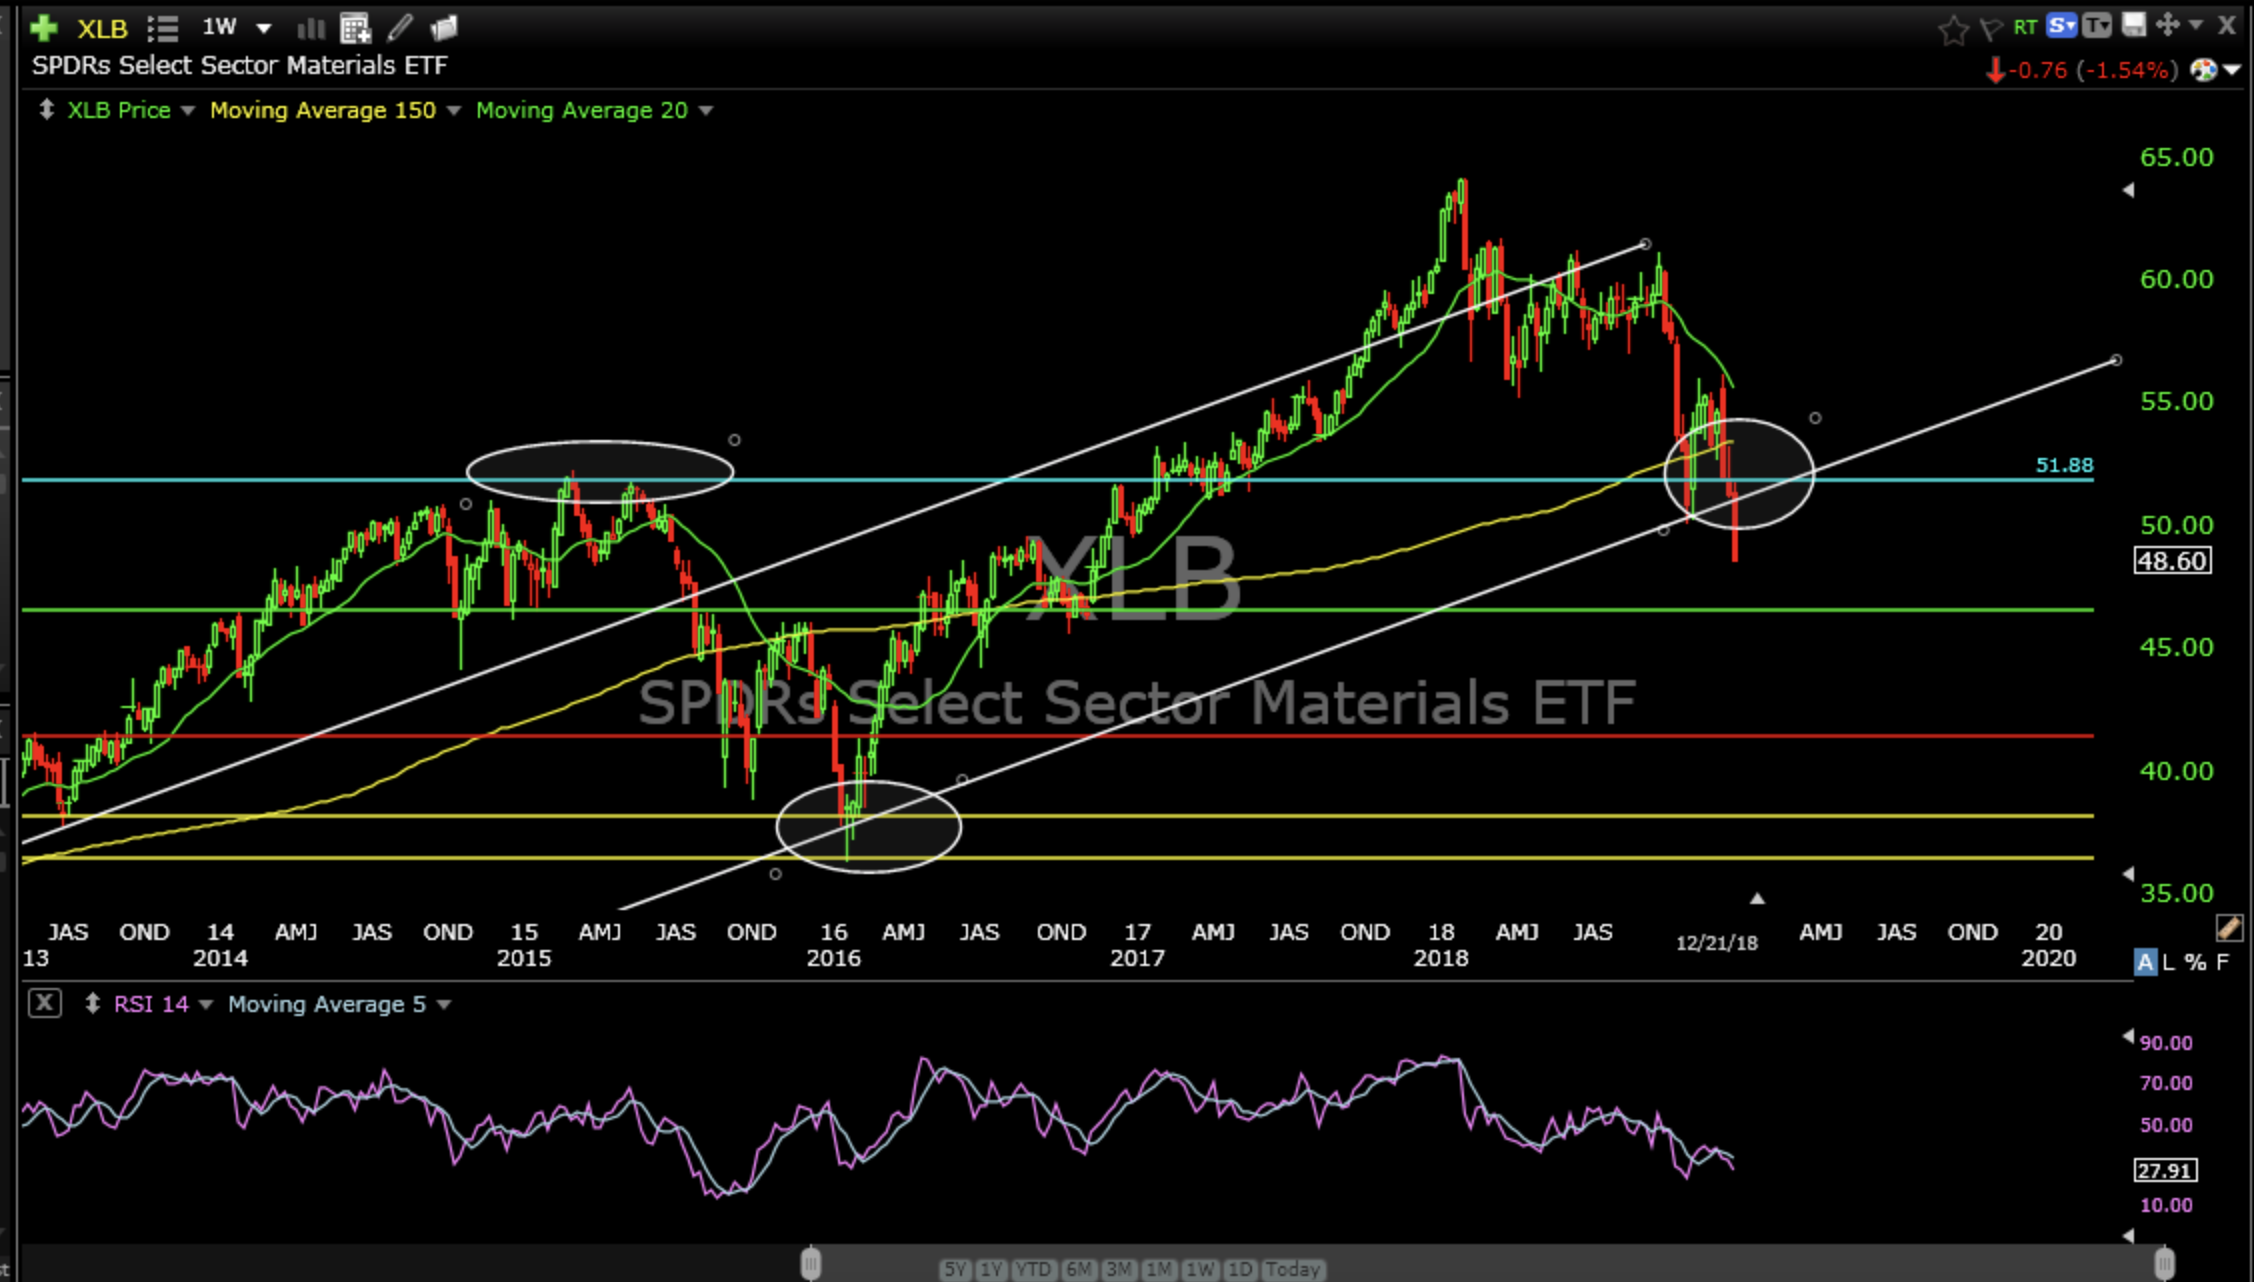
The Materials Sector ETF (XLB) looks a little like XLI, lousy. Broken secondary support last week and about 4% above the next level.
The Financial Sector ETF (XLF)
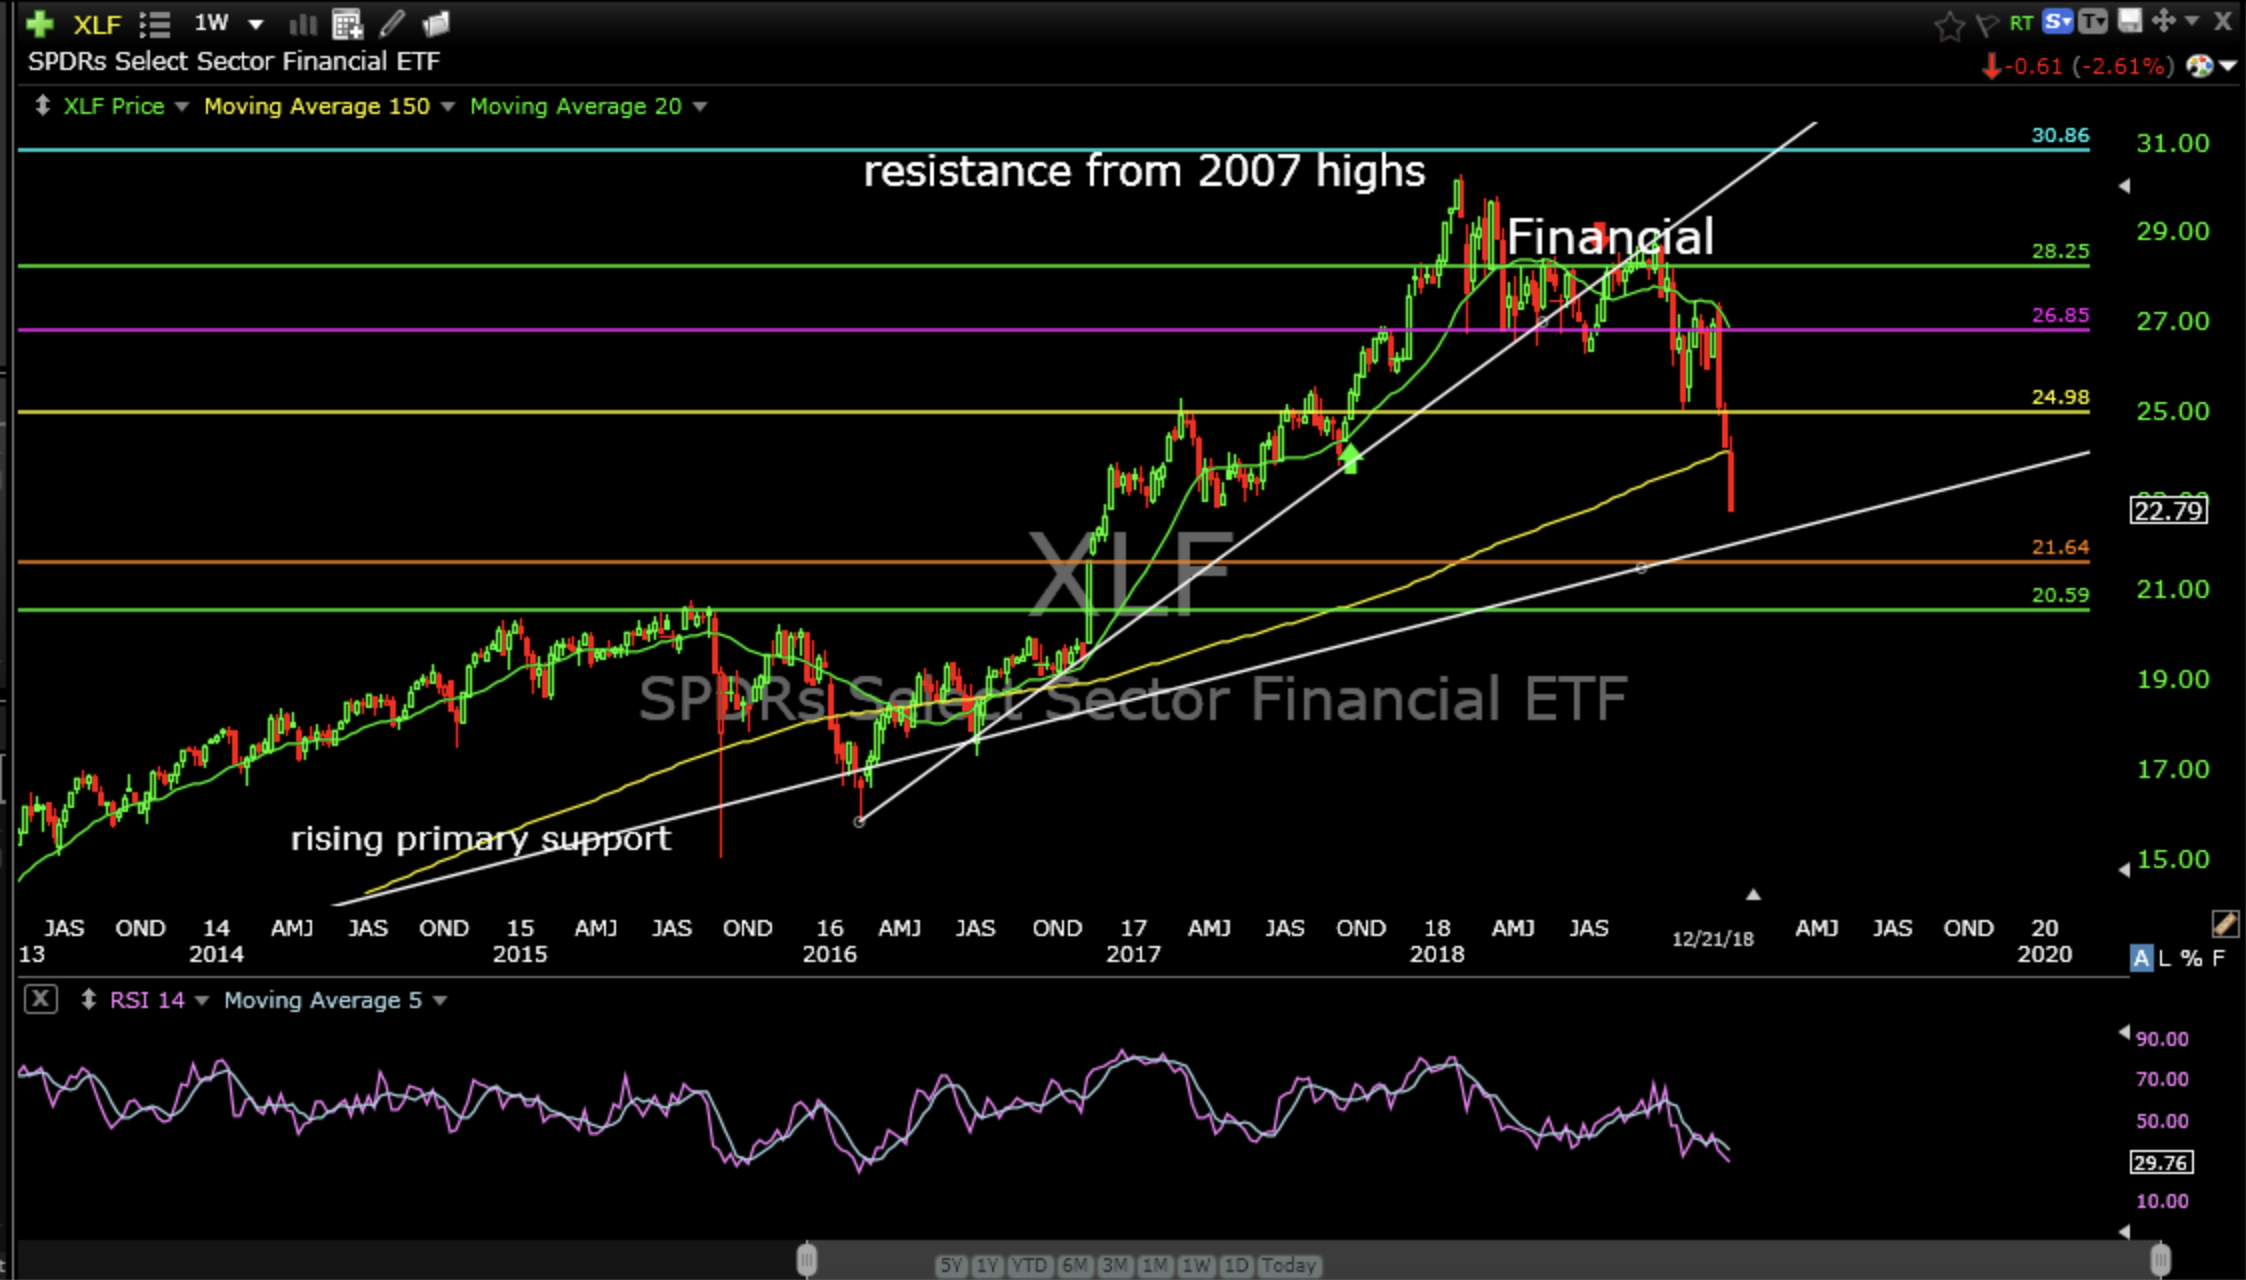
The Financial Sector ETF (XLF) is also breaking more support levels and has closed just above (4%) rising primary support.
The Technology Sector ETF (XLK)
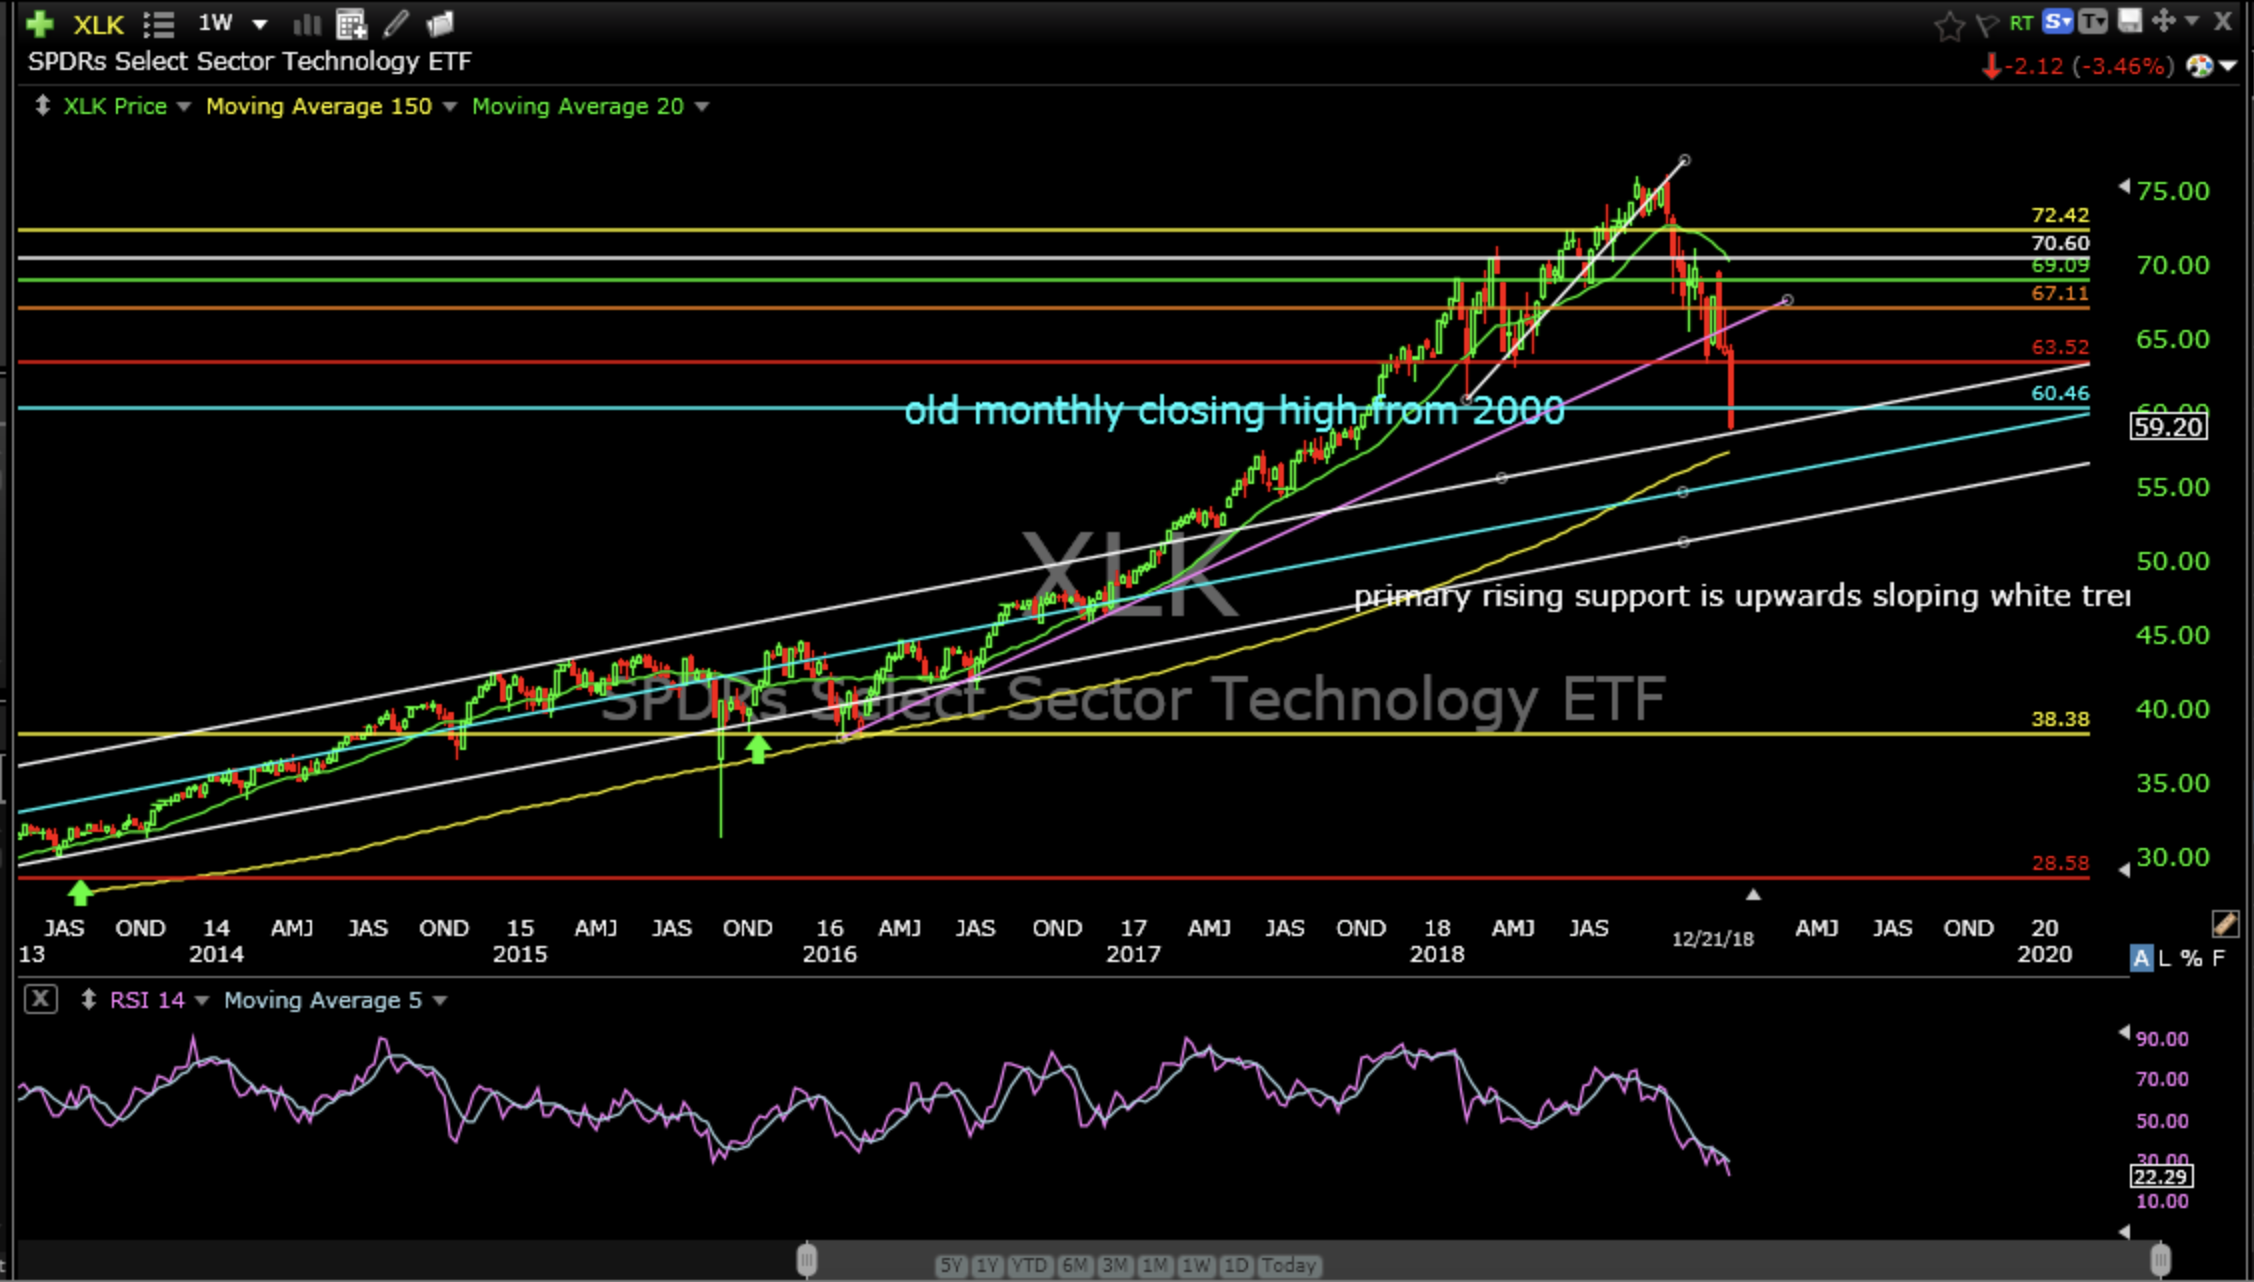
The Technology Sector ETF (XLK) has broken down through many support levels and closed Friday just above the rising channel that price has been running in from the bottom in 2009. It is still way above primary support (12%)
The Consumer Discretionary Sector ETF (XLY)
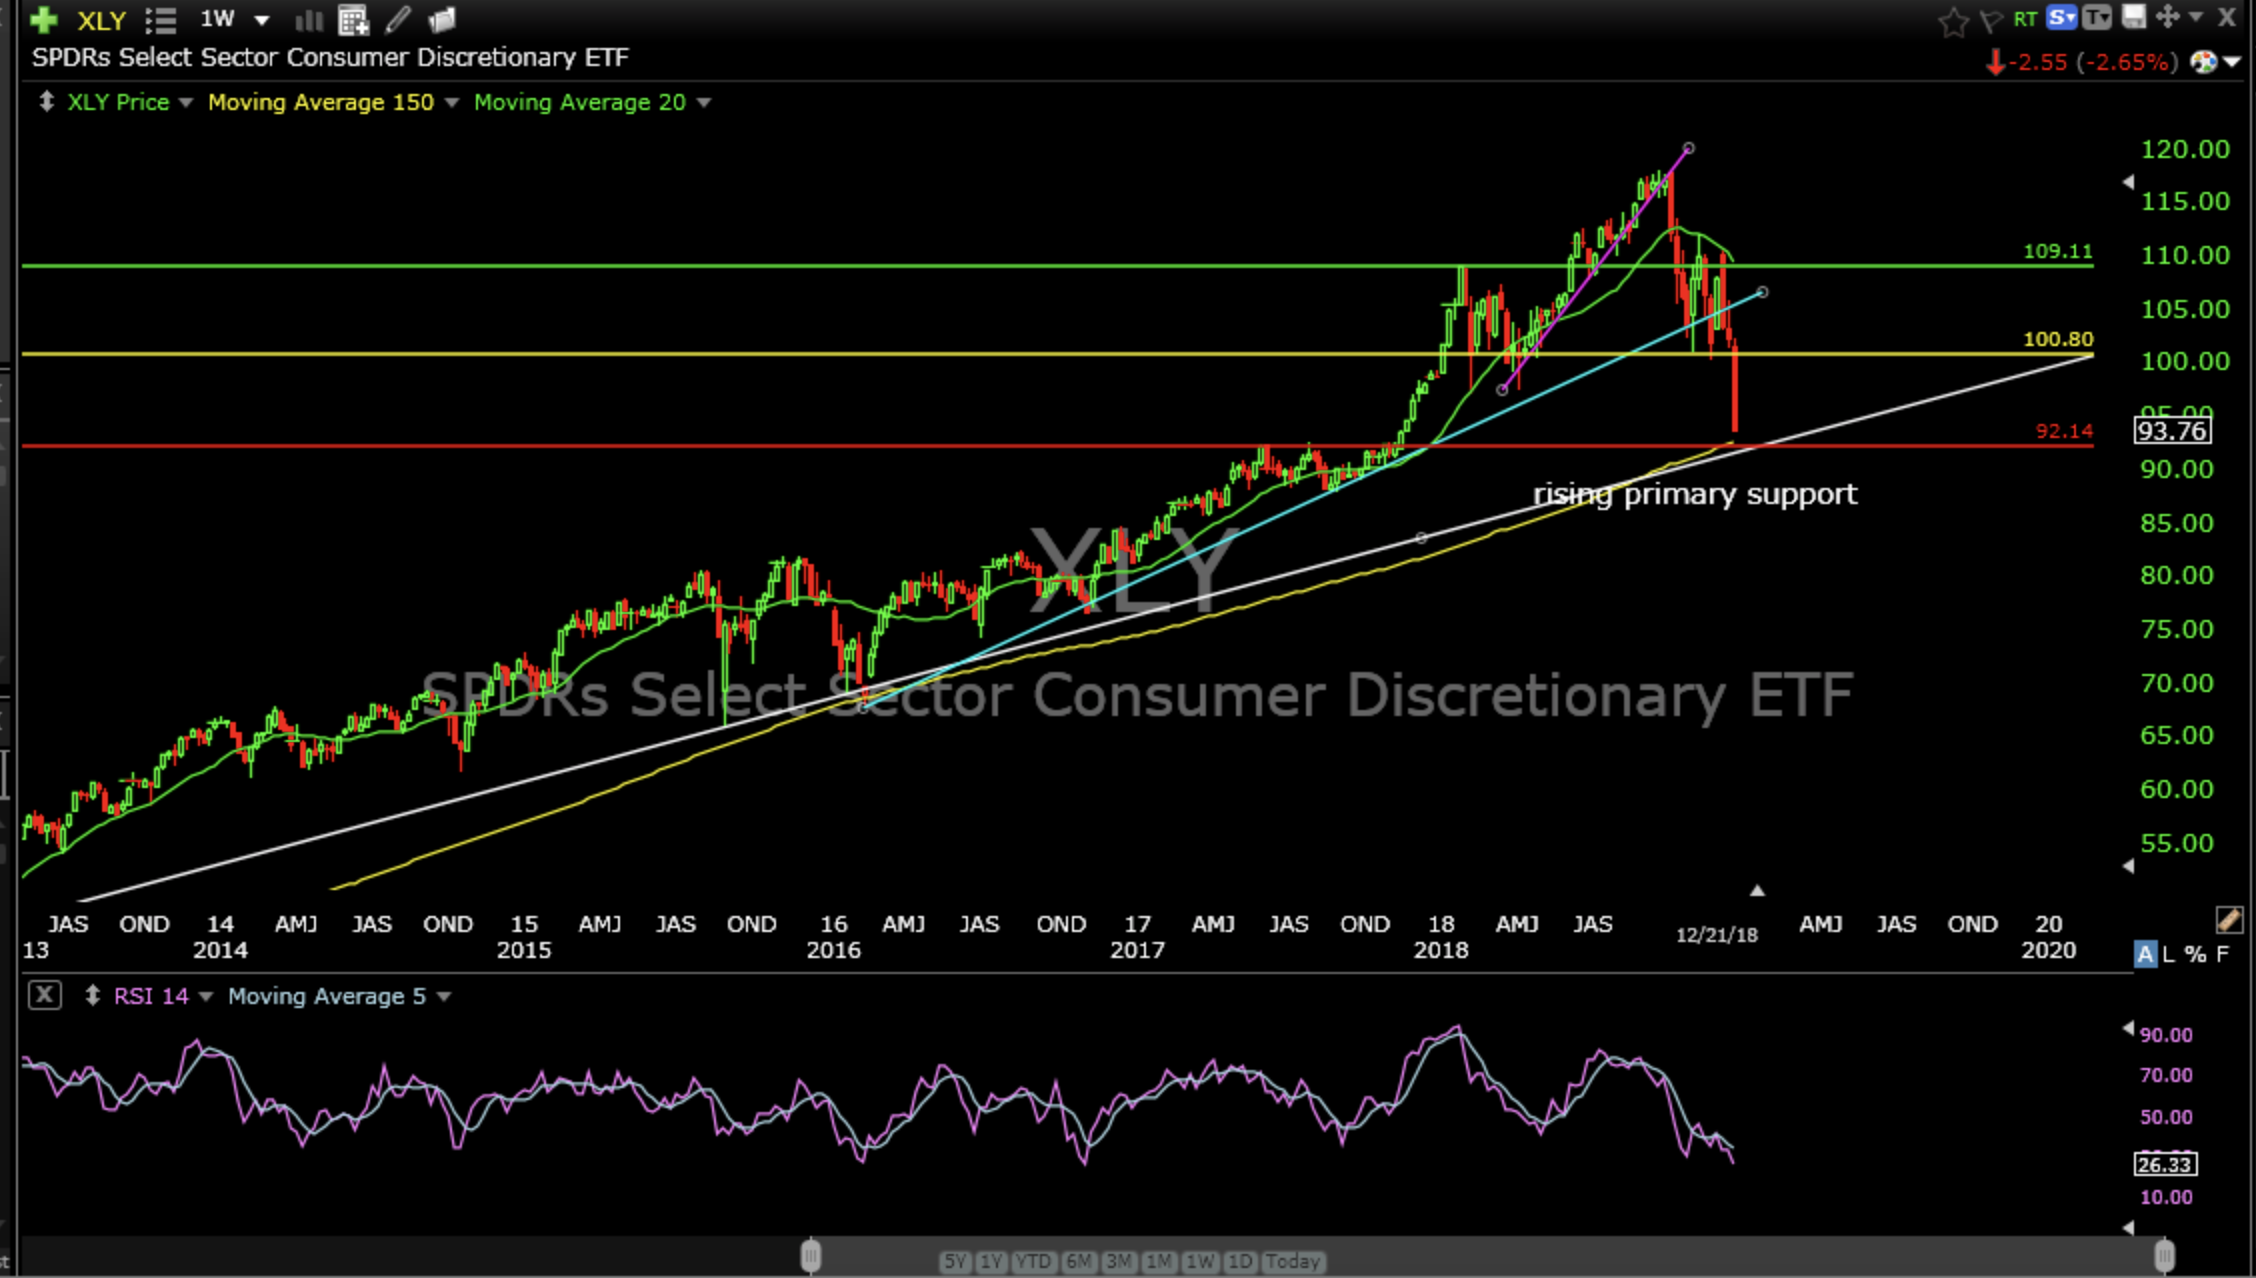
The Consumer Discretionary Sector ETF (XLY) also closed Friday just above support, the rising primary support that has only been broken once, in 2011, since the bottom in 2009.
The Energy Sector ETF (XLE)
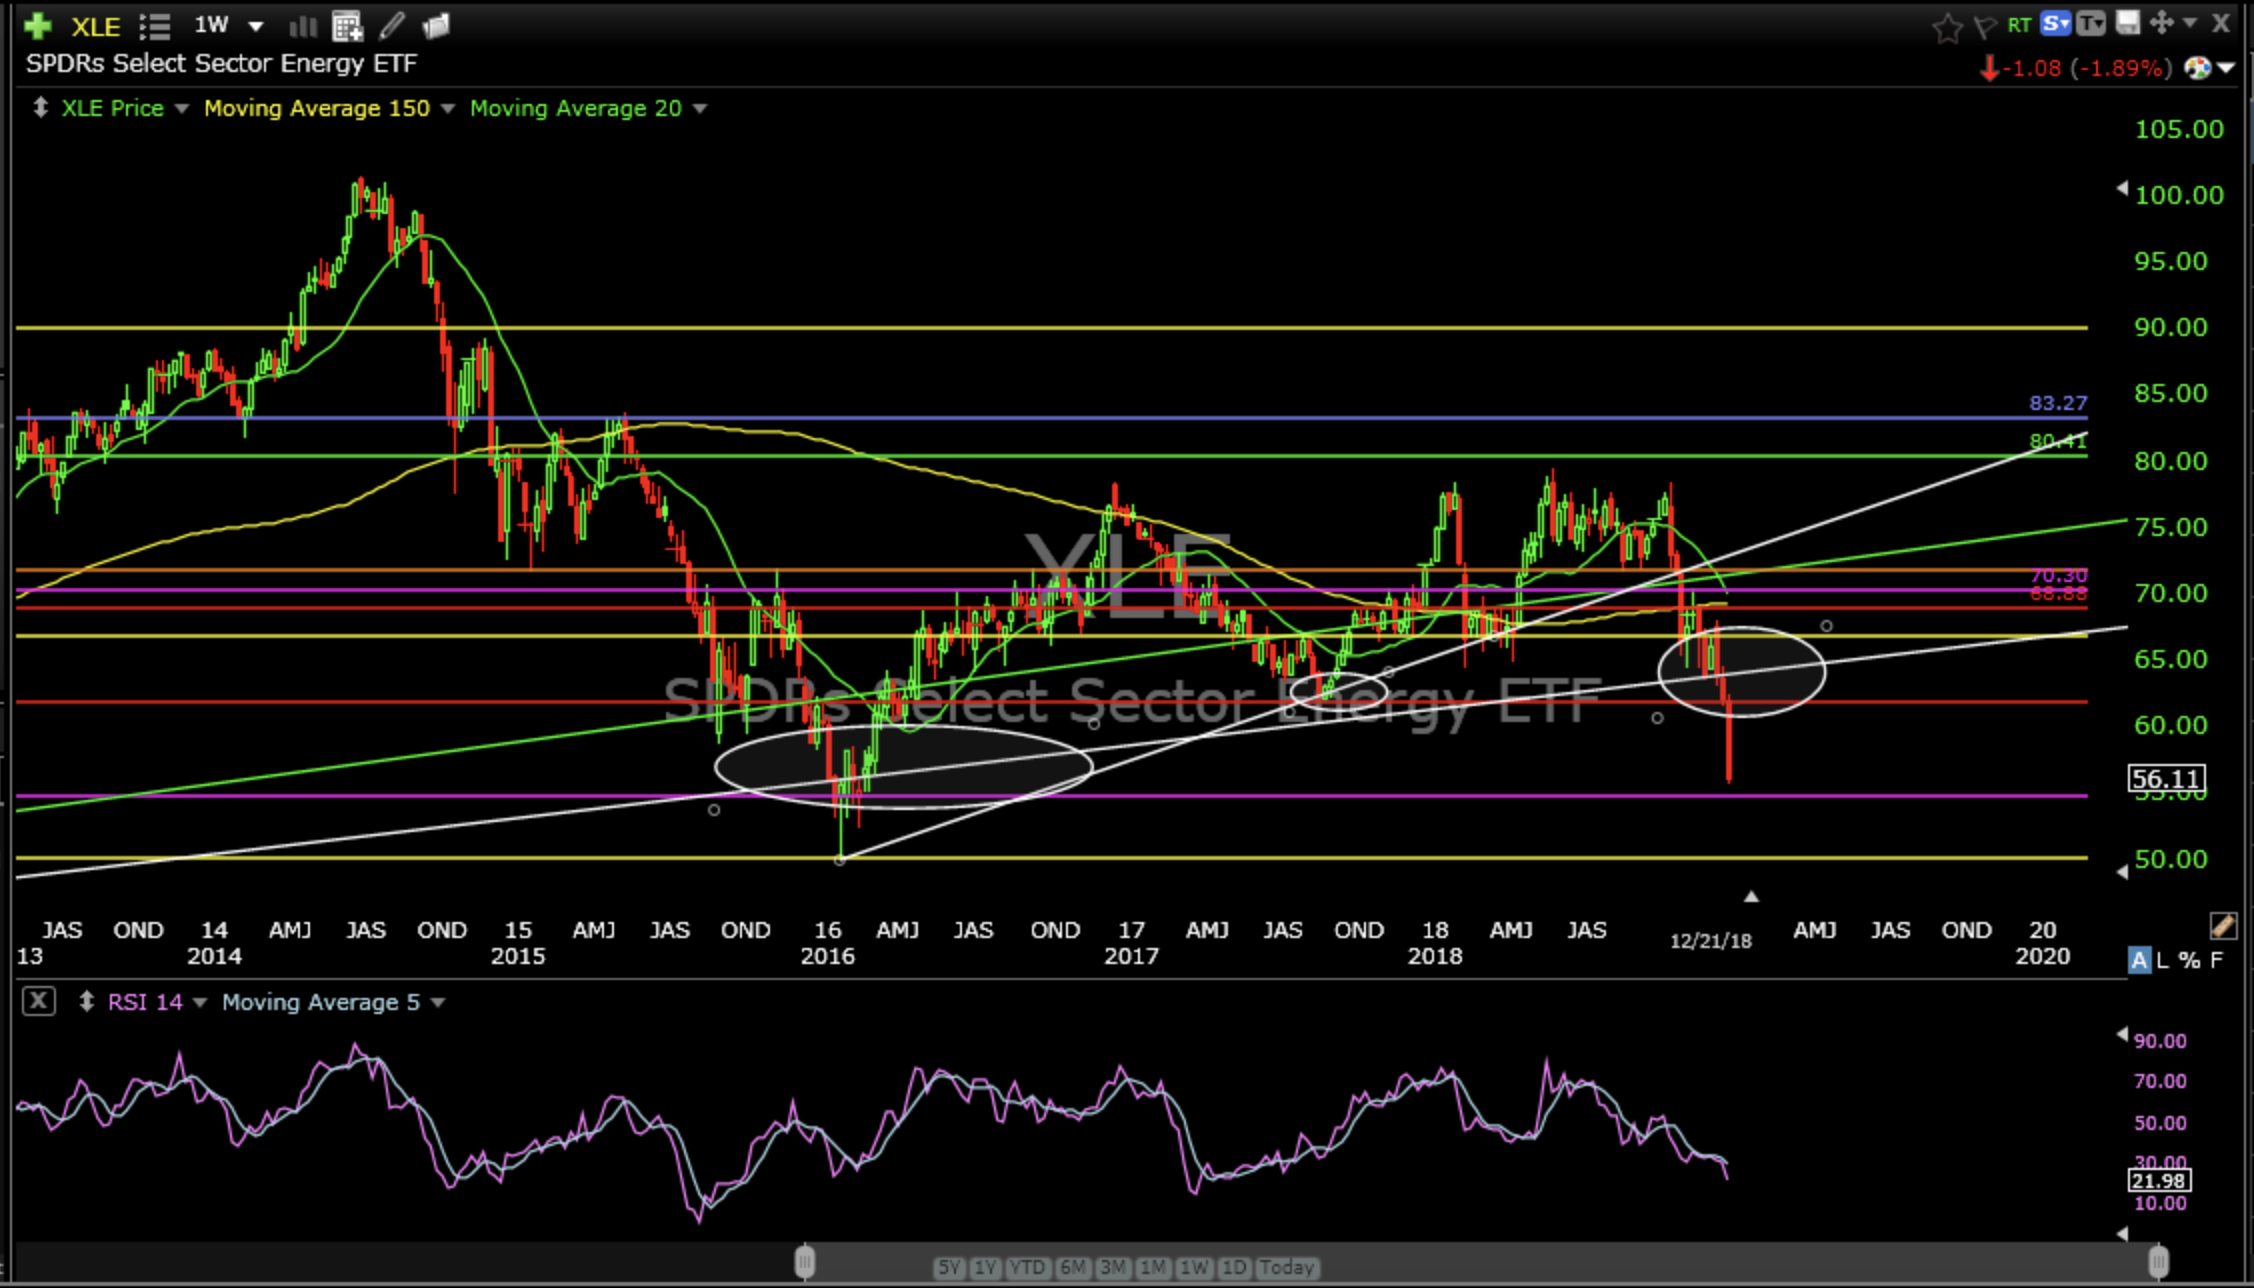
The Energy Sector ETF (XLE) is breaking down hard and fast violating multiple support levels. I could easily see another 10% fall from Friday’s close.
The Utility Sector ETF (XLU)
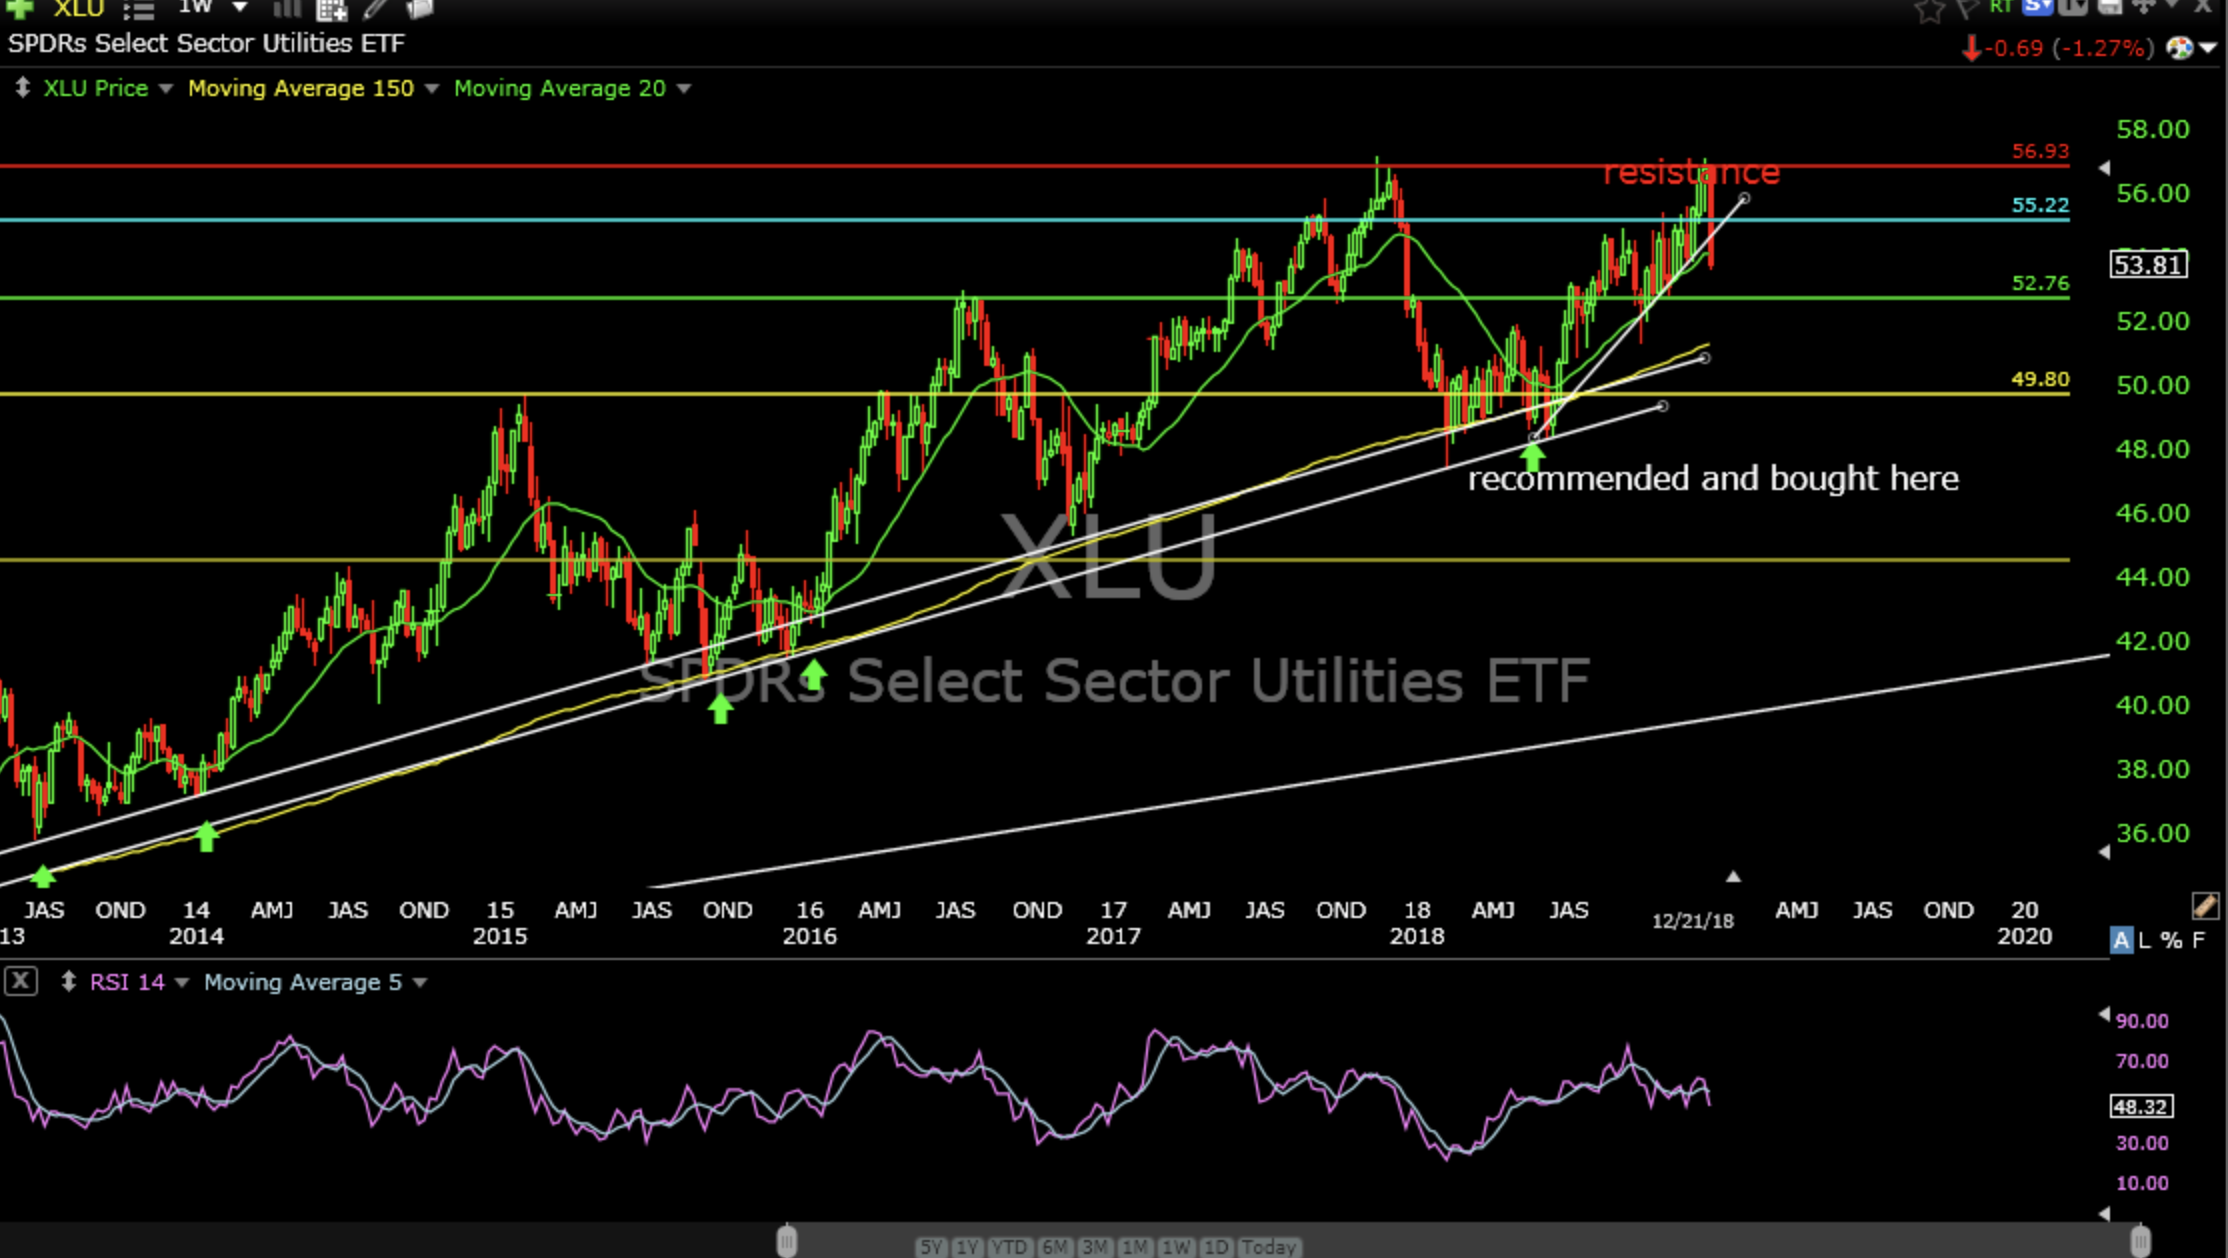
The Utility Sector ETF (XLU) is still trading above long term support from the bottom in 2009. Last week it crashed down through short term support from this year and is currently above it’s next support level by about 2%.
The Health Care Sector ETF (XLV)
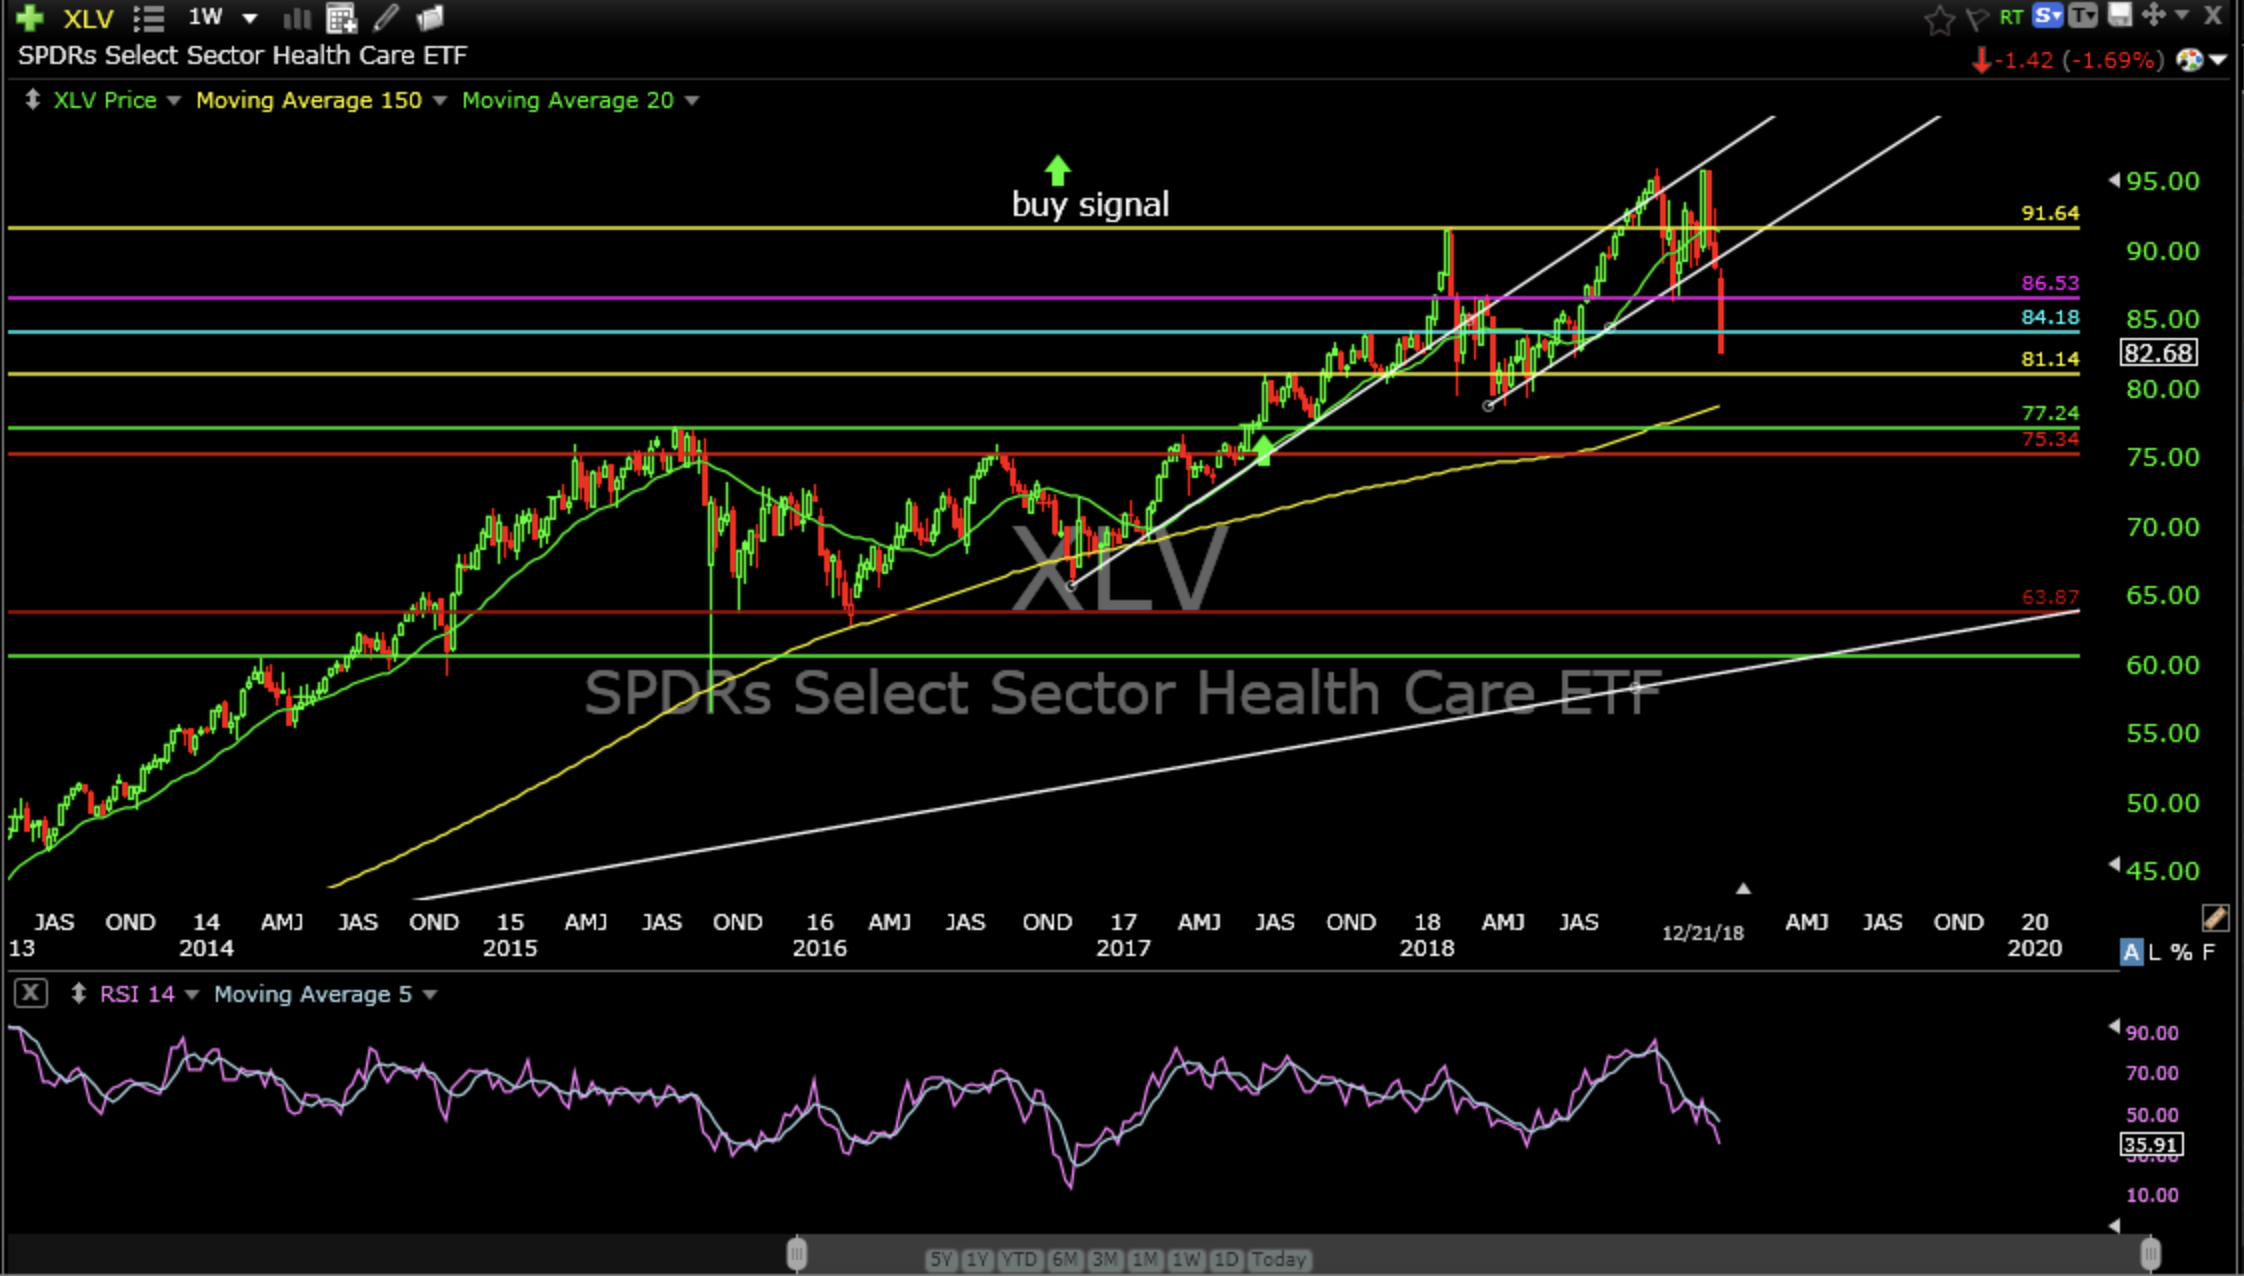
The Health Care Sector ETF (XLV), like the Technology Sector ETF (XLK), is still way above primary support (27%) and looking for a lower level to stop the bleeding.
While some sectors are near good support others are not. The lean is towards lower prices until we see some sort of bottoming occurring at logical levels. I don’t see that yet. I don’t see any signs of enough buying to stem the slide. Last week was a real chart buster. The only flicker of light I see is that last week was so bad and there is so much fear and that XLK and XLY are just above decent support and SPY is right above primary support that sentiment and support can stem the slaughter.
SPY could bottom right here but if it doesn’t I believe the selling will accelerate, if that’s possible. I don’t want any exposure below this rising level. If you have been following my recommendations you know current exposure has been reduced steadily over the past months.
I am recommending more selling and closing the following open positions…
Sell XLE…loss of about 25%. That was just awful.
Sell KBR…loss of about 35%. Very bad.
Sell INTC…loss of about 4%.
Sell COST…loss of about 12%.
Sell NSC…loss of about 16%.
In my opinion, there is not enough upside potential relative to downside risk that makes me want to own anything right now. There is no sign of bottoming. There is only the final level in SPY; rising primary support that is now just underneath price.
I’m just grateful for the selling I was able to recommend over the past six months; taking profits, reducing loss and raising cash for the eventual bottom. Remember, one can’t pick exact tops or bottoms but we can identify trends and important price levels to help maneuver exposure to either capture most of an uptrend or avoid most of a downtrend. That process seems to have begun last July when I began recommending selling. It ain’t perfect but it sure helps me.
I wish each of you all the best and hope I have helped you a little along the way. I have learned a lot in the last year and that makes it a good one for me.
Time to make merry,
Don