Smart Chart Investor

Beyond Buy and Hold: Using Technical Analysis to Reduce the Risk of Long-term Investing

  • Member Login

Giddy Up

December 11, 2016 by Don Roth

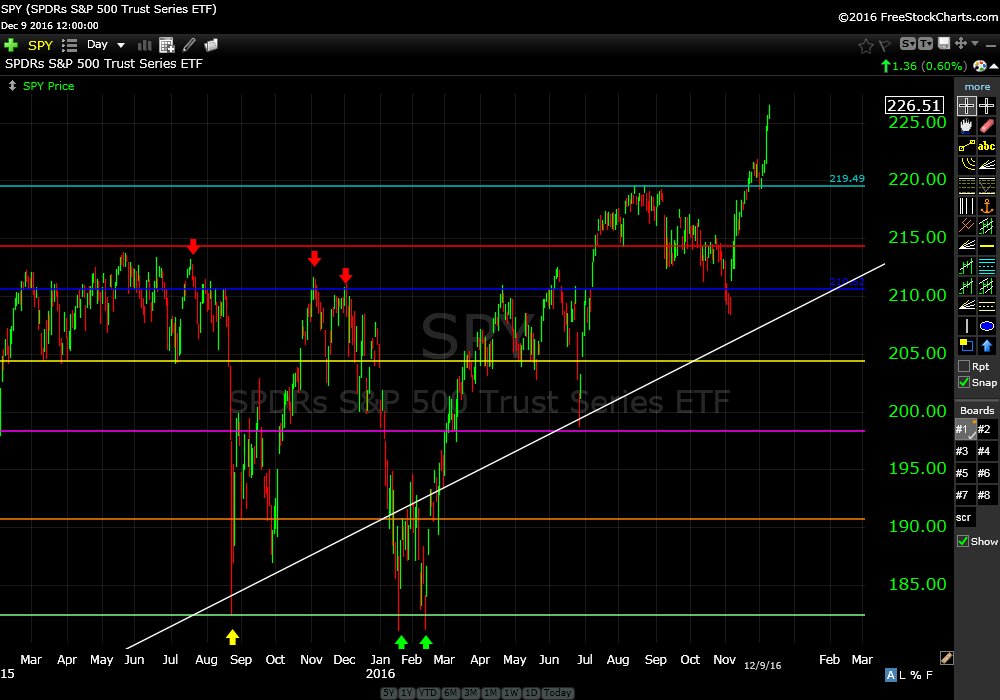
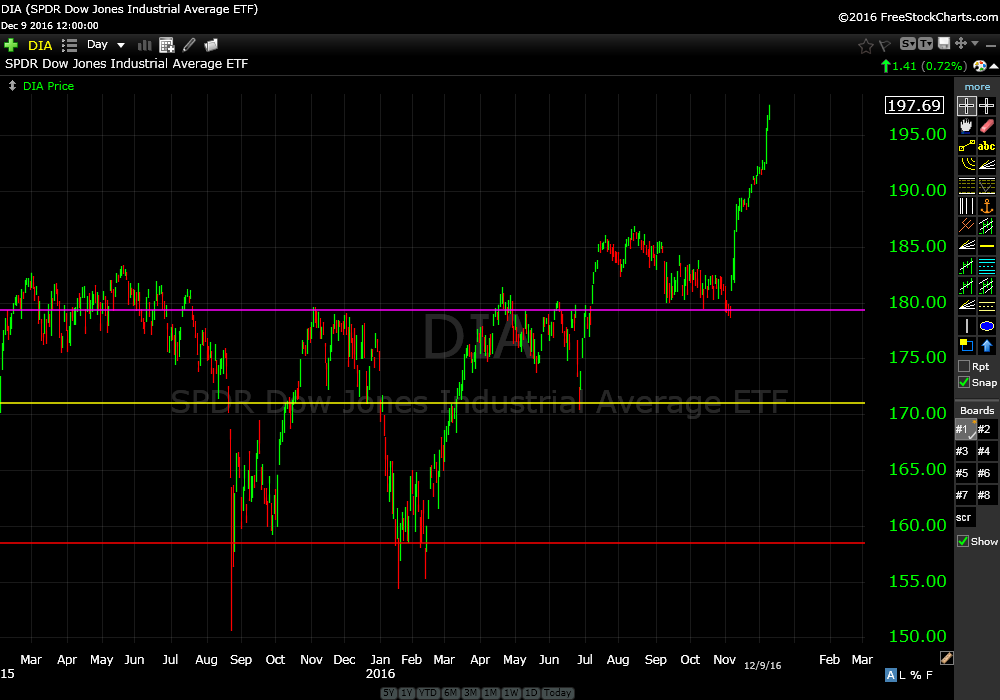
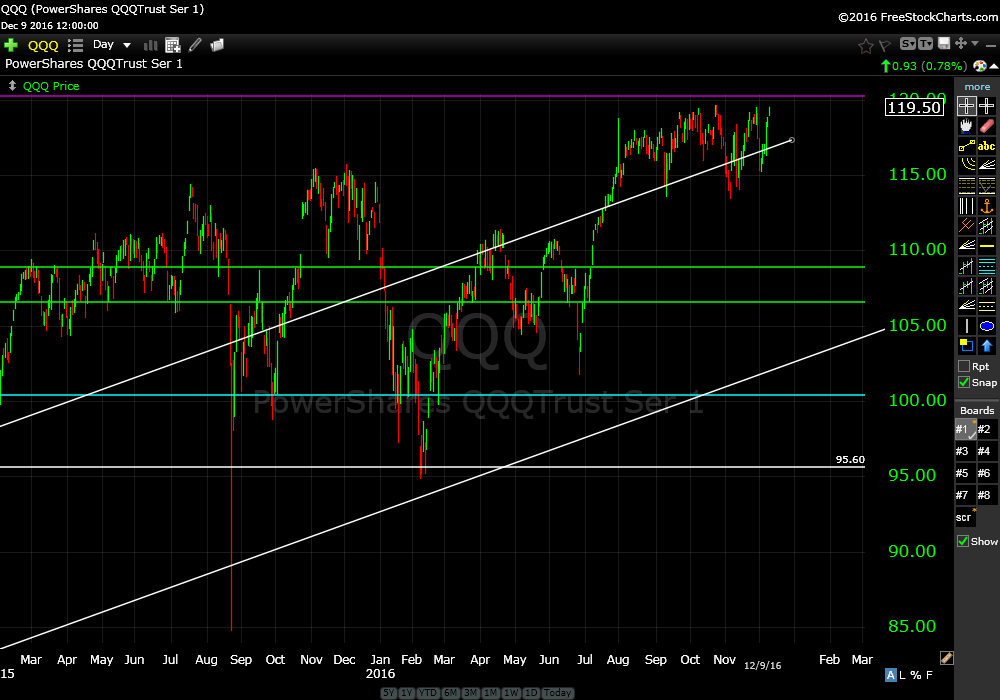
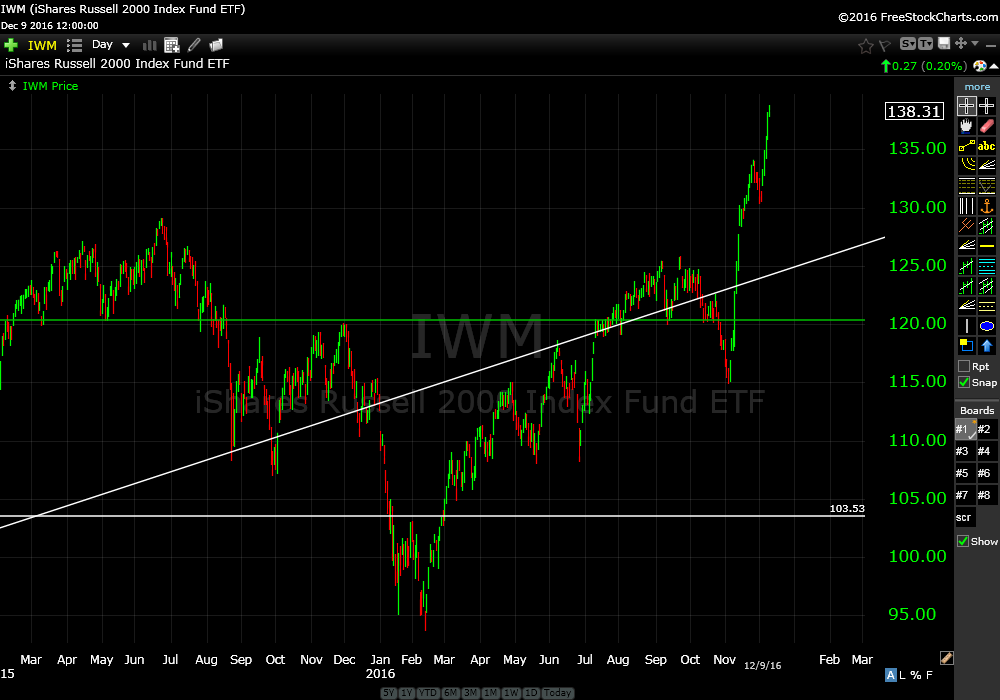
US stock market indexes are in melt up mode.

S&P 500 Index ETF (SPY) daily

spy-2016_12_9-d
(click chart to enlarge)

Dow Jones Industrial Average ETF (DIA) daily

dia-2016_12_9-d
(click chart to enlarge)

Powershares Tech ETF (QQQ) daily

qqq-2016_12_9-d
(click chart to enlarge)

Russel 2000 Index ETF (IWM) daily

iwm-2016_12_9-d
(click chart to enlarge)

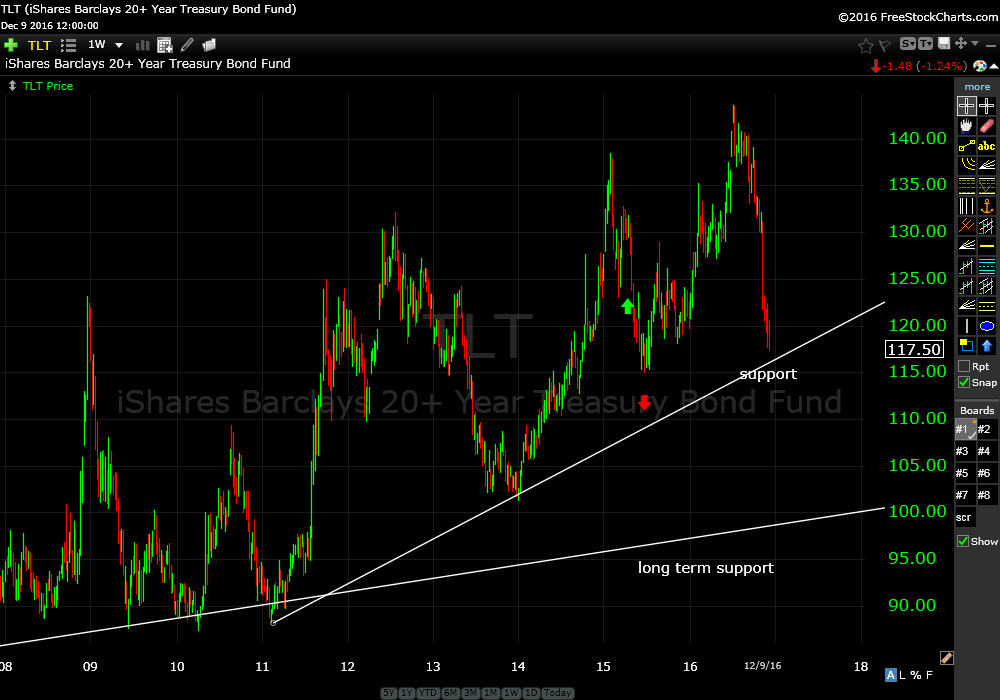
Continue to hold all open positions. Bond prices have gotten hit pretty hard over the past few months. TLT is approaching support so I’m looking for a bounce soon.

20 Year Bond Fund (TLT) weekly

tlt-2016_12_9-w
(click chart to enlarge)

If you have any questions…just ask.

Trade Smart,

Don

RECENT MARKET UPDATES

  • Blow Off Top?
  • Major Announcement!
  • Trade Alert (BE)
  • Important Notice
  • Weekly Market Commentary and Pre Announcement
Go to Members Home

Don Roth

Don Roth, Smart Chart Investor

Recent Market Updates

  • Blow Off Top?
  • Major Announcement!
  • Trade Alert (BE)
  • Important Notice
  • Weekly Market Commentary and Pre Announcement

Copyright © 2011–2026 · Smart Chart Trading, Inc · Privacy Policy · Terms of Use · Disclosure Information · Log in