If you are a long term investor, like me, do not sell the Inauguration. Buy some more stuff. I’m going to.
S&P 500 Index ETF (SPY) daily
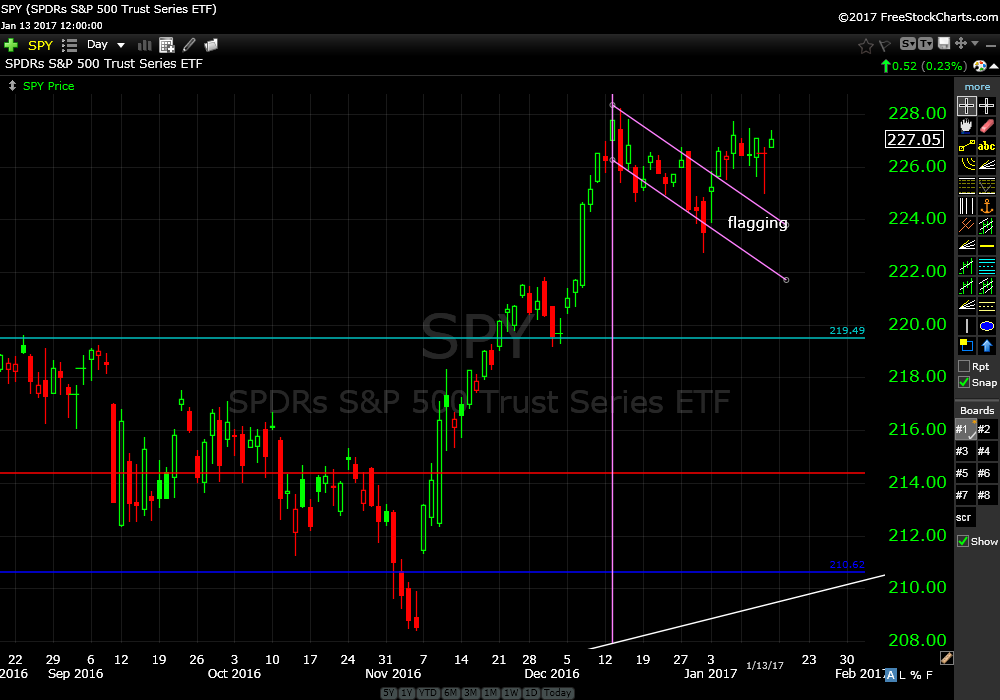
SPY looks healthy and ready for another leg up. Buy some more. Set your risk at closes below 219 for new SPY shares.
Remember…
You can always get out. Sometimes you never get in.
So, some interesting price action is going on…
iShares India Index (INDA) weekly
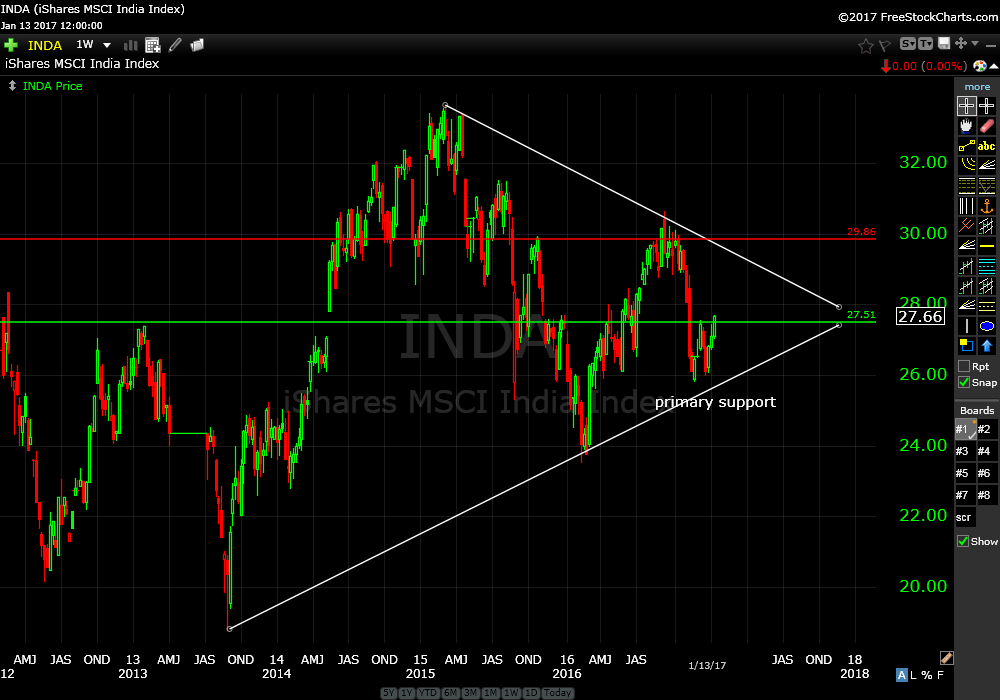
Price has popped off trend line support and has closed above 27.50. This has a good chance at going higher. Minimum play is to upper down sloping trend line. Risk is under primary support.
Facebook (FB) weekly
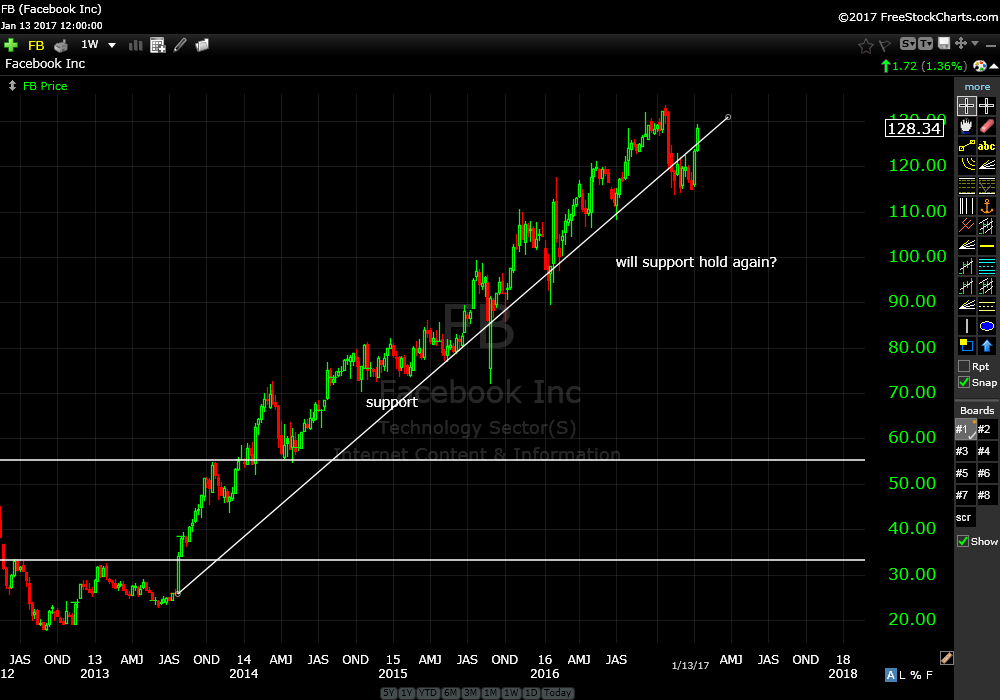
A momentum play. Just buy it. It has to just go higher. Set your risk at around 112.
Even I am on Facebook. Soon to go Live. I can’t imagine they are not attracting the best talent. Sorry, got a bit fundamental.
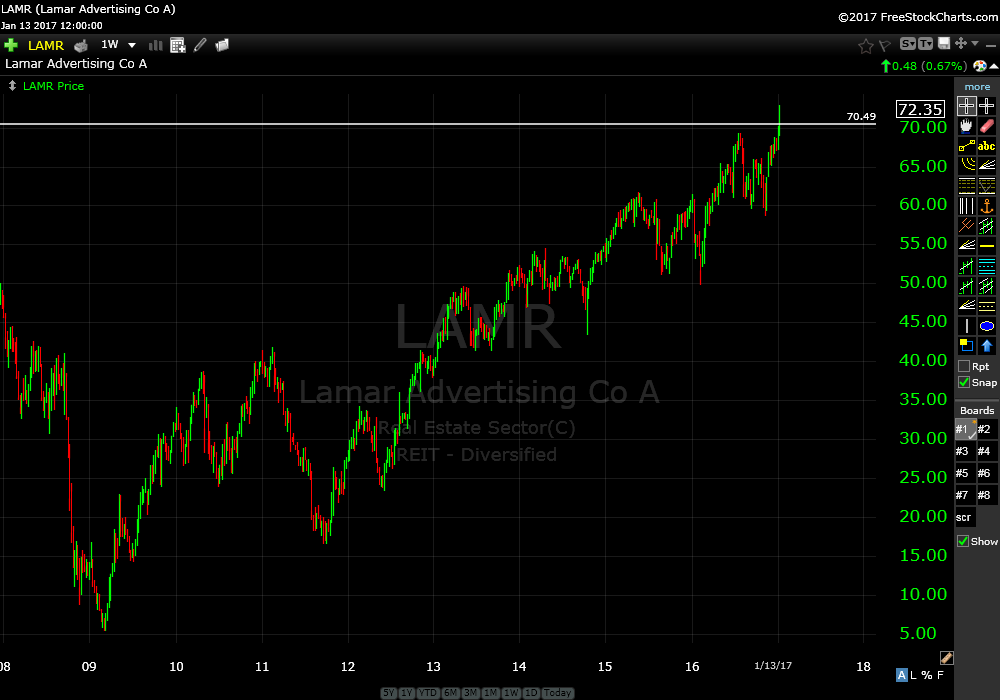
Lamar Advertising Co (LAMR) monthly
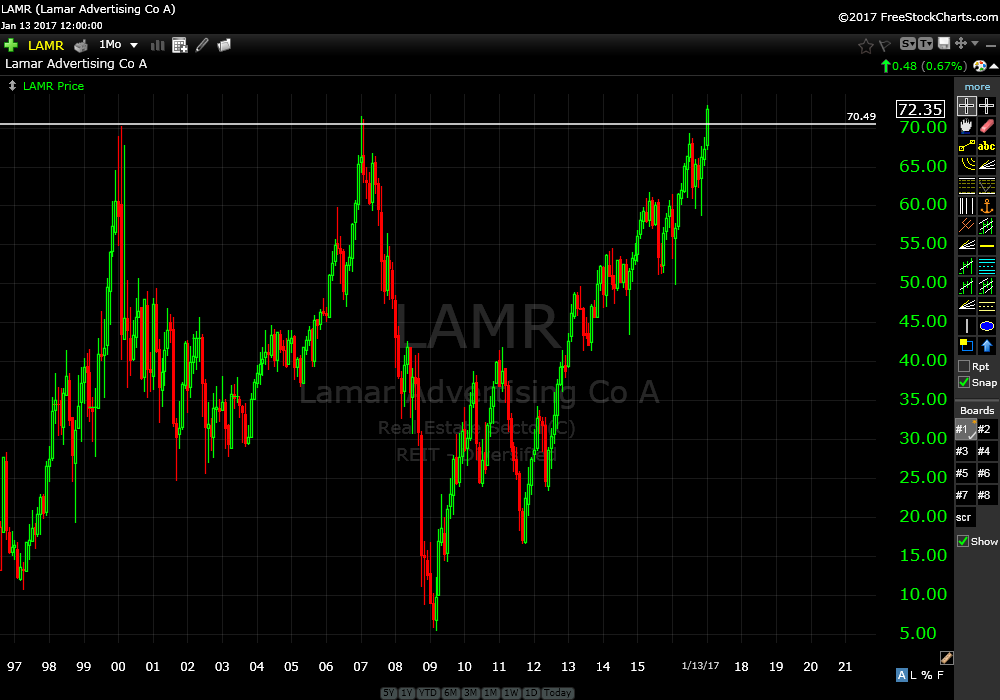
It is firing on all cylinders. Another momentum play that could soar with minimal risk.
Monthly chart (above) shows closing above all time highs.
Lamar Advertising Co (LAMR) weekly
Weekly chart (above) shows first close above all time highs.
Lamar Advertising Co (LAMR) daily
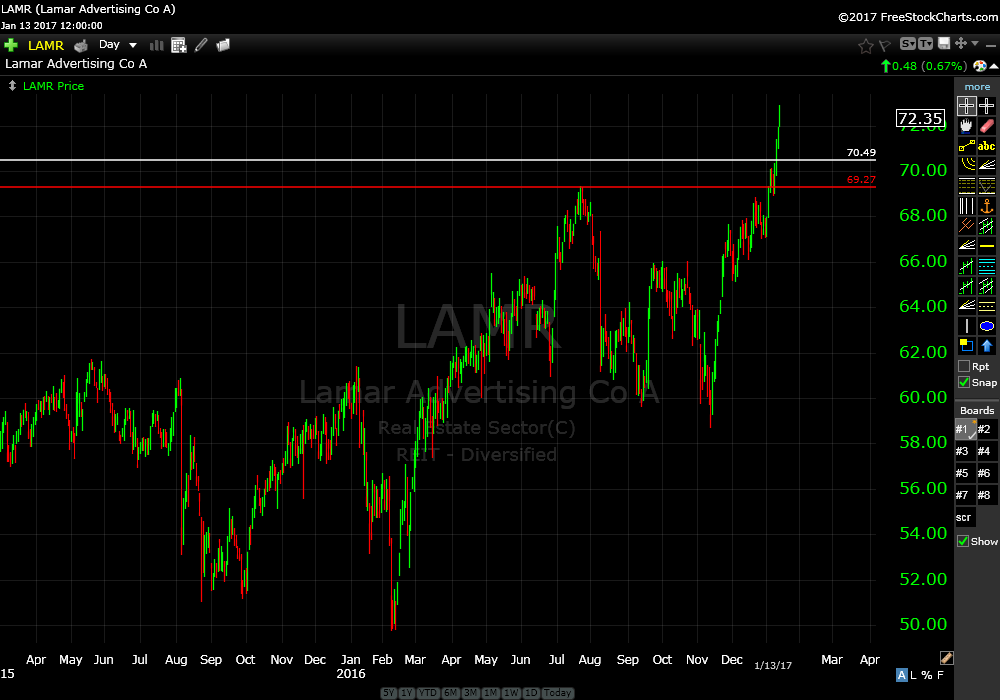
Daily chart (above) is popping.
Risk is around $68. 4% to 5%.
Mexico Index ETF (EWW) monthly
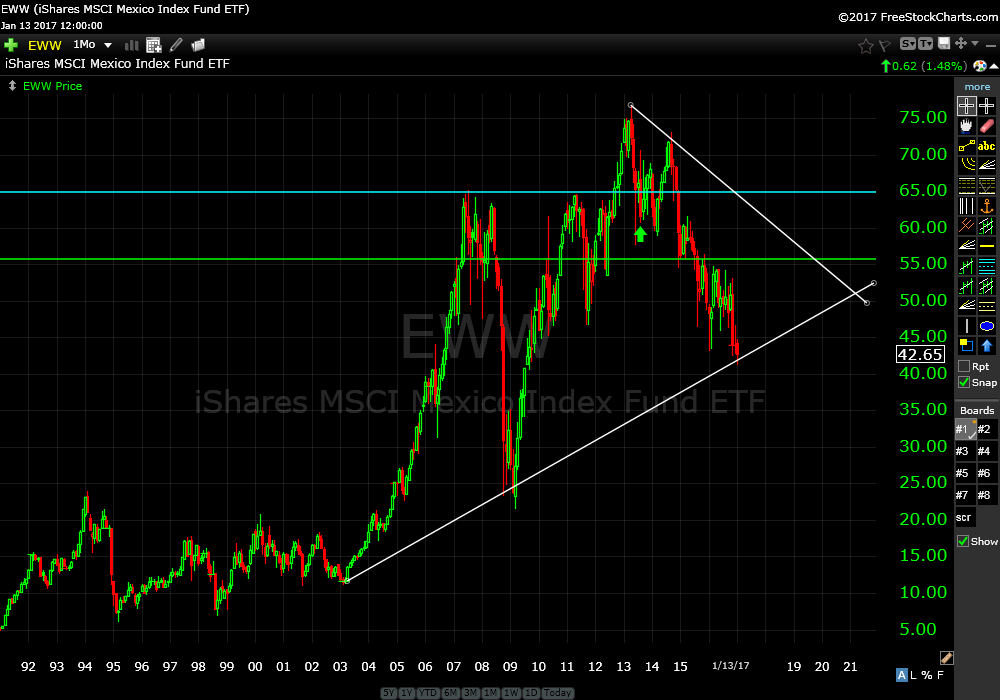
Popping off long term support from 2002 after a decline of 46% from 2013. Looks like a good “reversion to the mean” trade.
Monthly chart (above) shows price is holding at support.
Mexico Index ETF (EWW) weekly
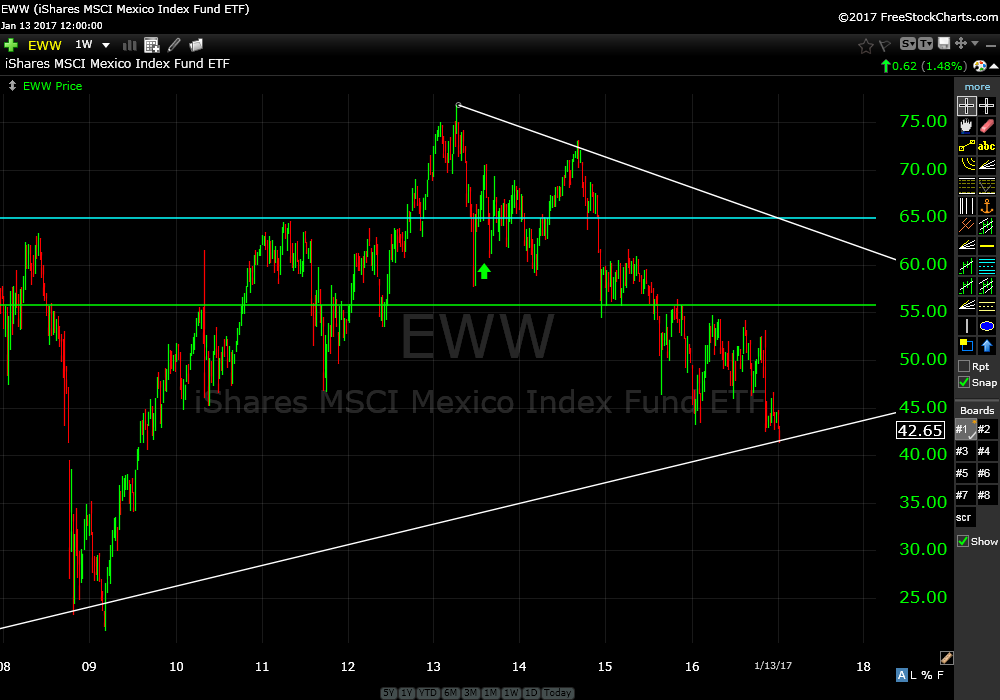
Weekly chart (above) shows price support.
Mexico Index ETF (EWW) daily
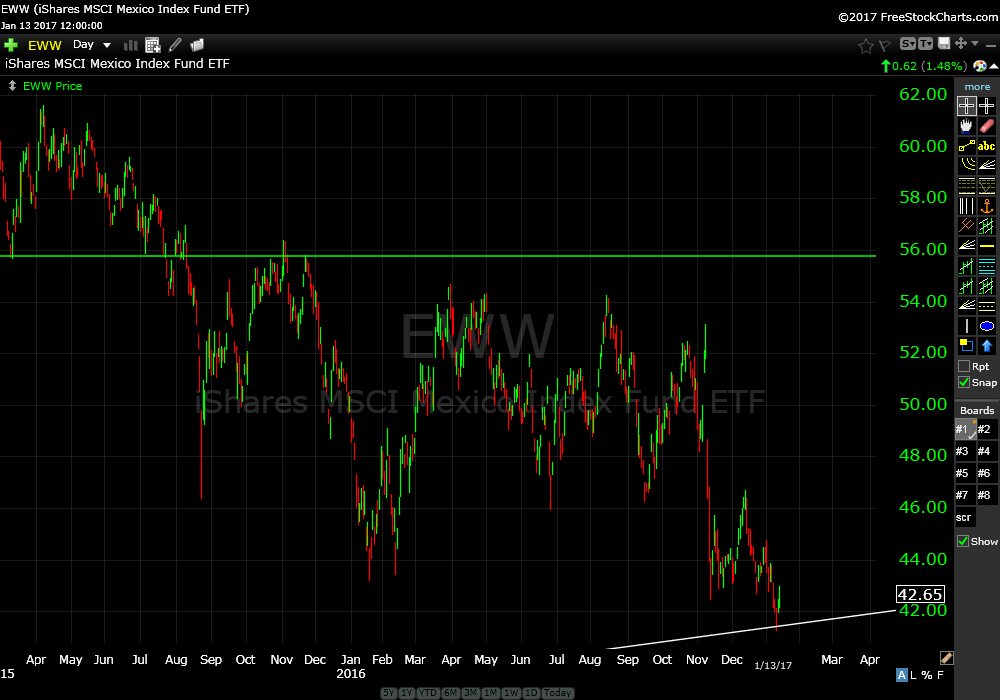
Daily chart (above) shows some confirmation.
This is an early entry but it looks good. Risk is under the white upwards sloping trend line.
Mexico isn’t going to fund the wall. Just buy it and know your risk.
Global Social Media Index ETF (SOCL) weekly
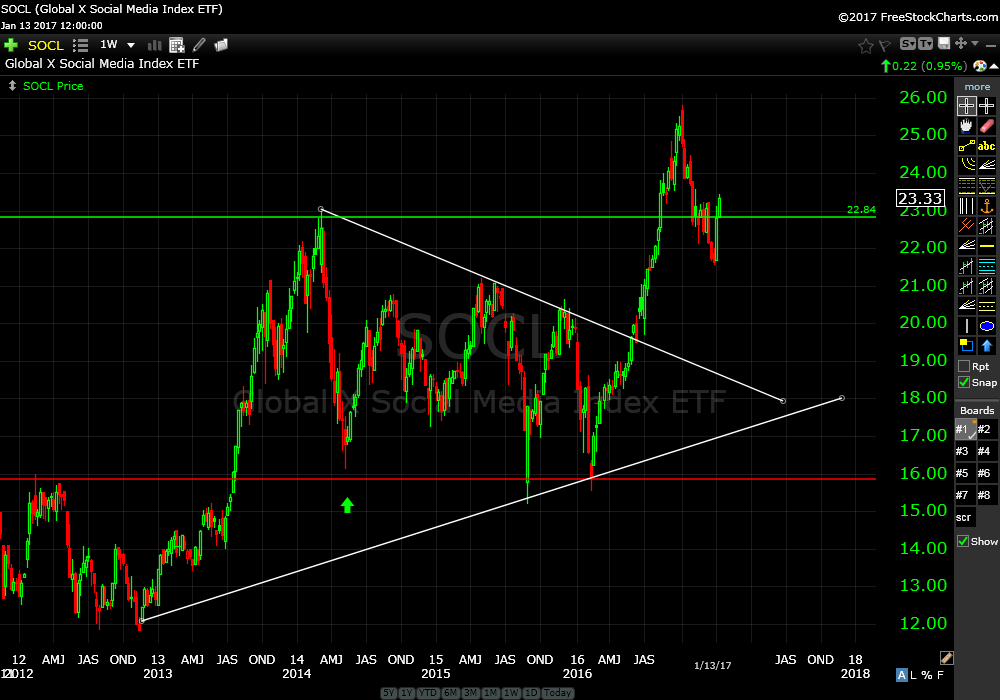
Social media ETF. Trade it on momentum and get out just under $21.
Low risk, high reward investment.
Medtronic PLC (MDT) weekly
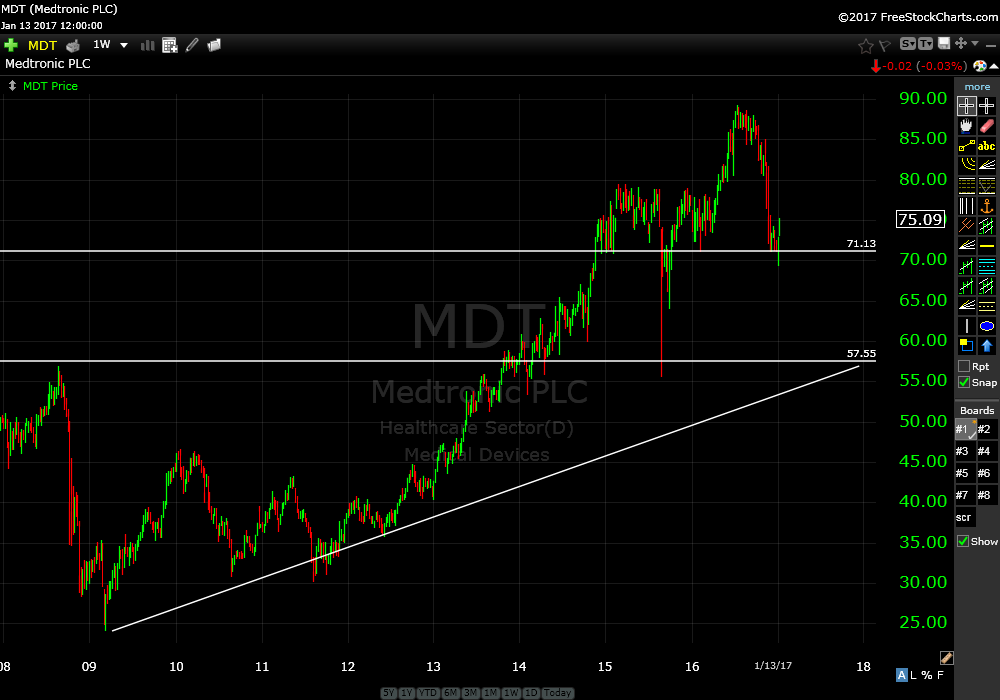
I have always liked this company. Price has made a 20% correction and has popped off support at $71.13.
Buy it here and your risk is under $69.
Trump will be our President on Friday. Everyone knows this. It is already a non event.
I’m buying.
Continue to hold all positions.
Also, don’t you just love all the new shows on TV from Hulu, Amazon and Netflix?
Looking to buy AMZN again soon.
Trade Smart,
Don