SPDR S&P500 Index ETF (SPY) weekly
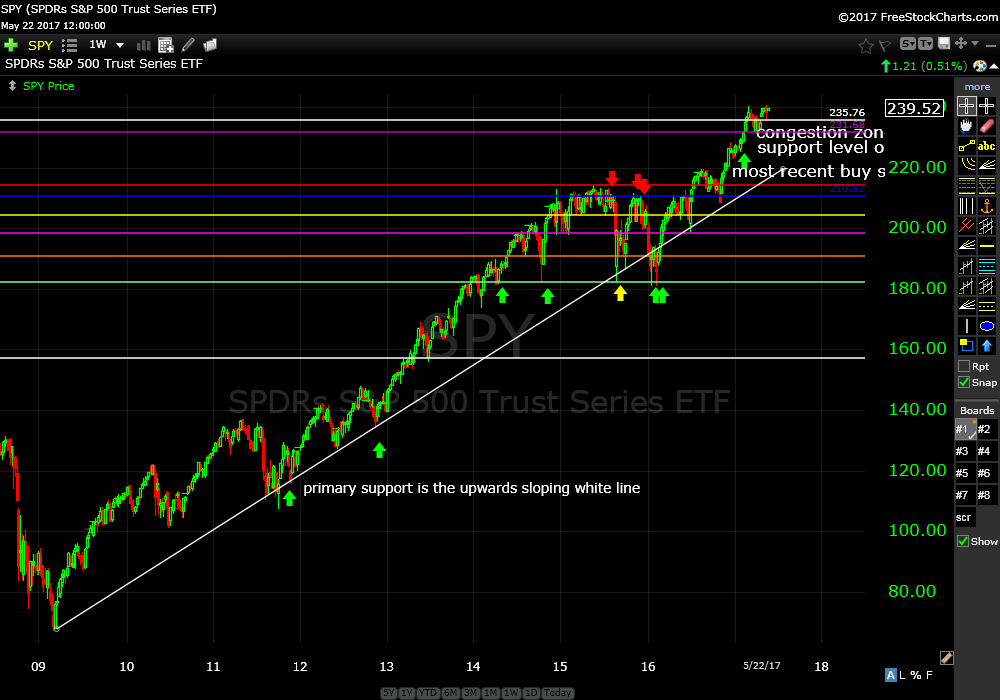
Continue to hold. Looking at the weekly chart you can see the first buy signal we made on SPY, November 29, 2011, three months after our web site went live. Up about 100% on that initial recommendation.
SPDR S&P500 Index ETF (SPY) daily
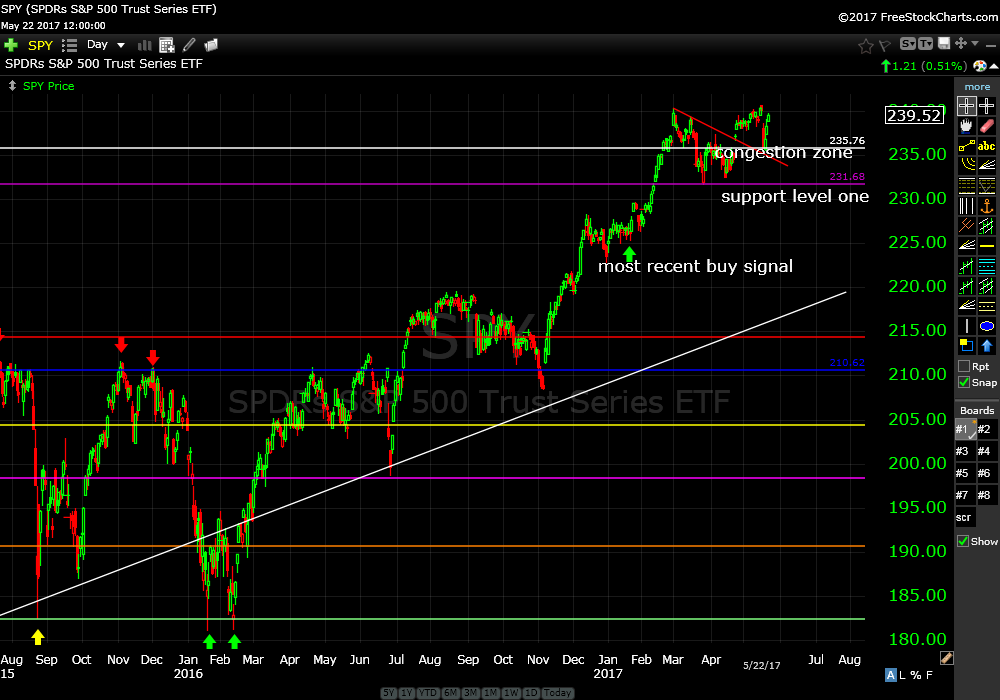
Looking at the daily chart of SPY you can see price bounced off of the congestion zone, cleared the top of last Wednesday’s pullback and almost filled the gap between last Tuesday’s close and last Wednesday’s open…bullish.
Power Shares QQQ Trust ETF (QQQ) monthly
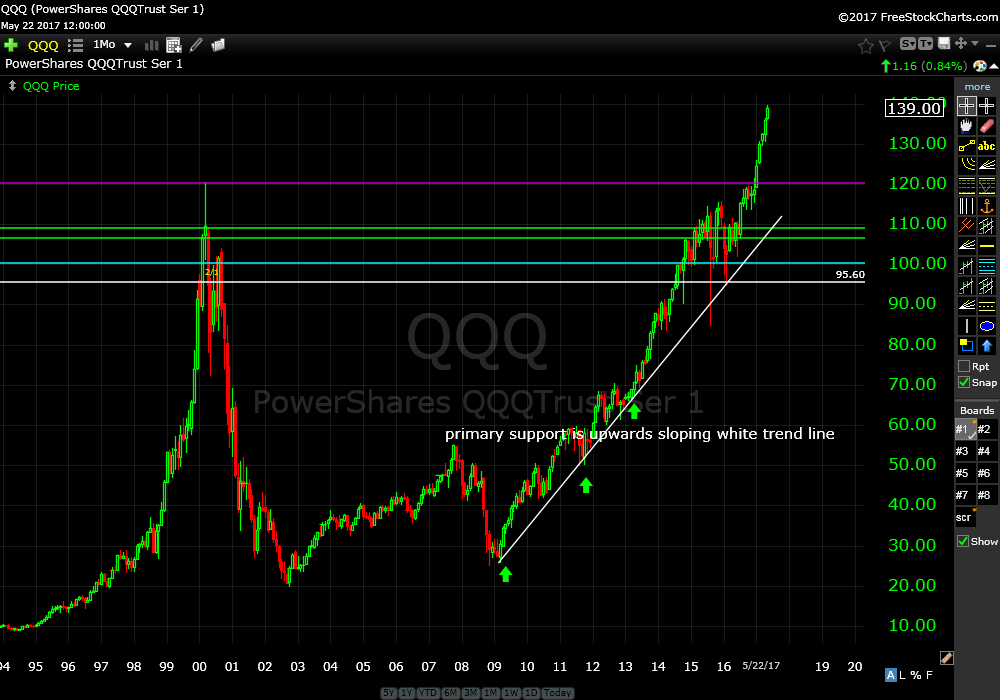
Continue to hold. Our first buy signal for QQQ was on March 14, 2013. We would have recommended QQQ in 2011 but at that time we were primarily providing research on the S&P 500 Index and education…not buy and sell signals for other assets.
Currently up over 100%. You can see QQQ has ripped higher since taking out the previous highs from 2000.
SPDR’s Select Technology Sector ETF (XLK) monthly
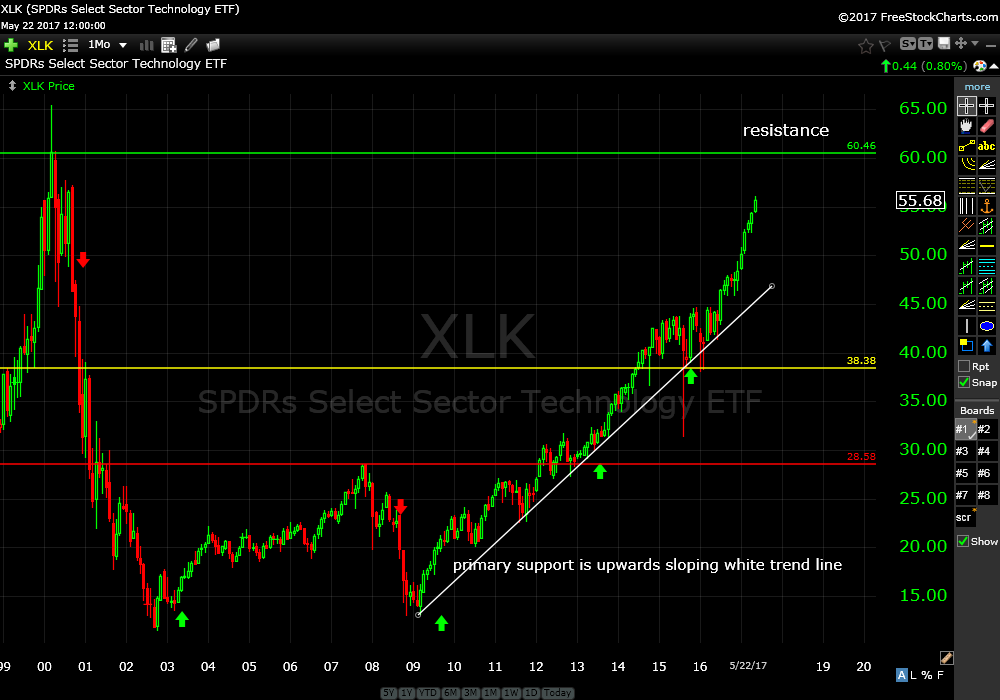
Continue to hold. Up almost 100% from our buy signals on July 2, 2013 and up about 45% from October 11, 2015. Next target is $60.
iShares Telecommunications Sector Index Fund ETF (IYZ) daily
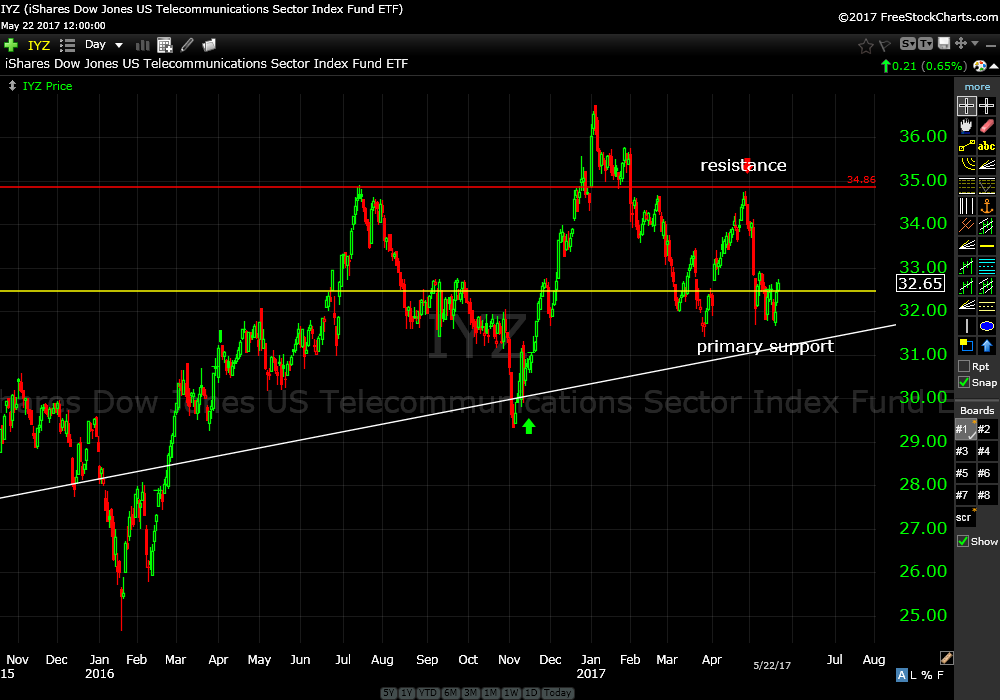
Currently up about 6%. You might ask why we didn’t take profits when price failed at resistance. We could have but remember, we are trying to capture large moves. This requires letting price “breathe”.
Price is currently reverting to the mean, the primary support level. If price gets a bounce at this rising support level we can add to our position. If price fails at this level, we exit for a small gain or loss.
You will never capture large moves by getting out at the first sign of price reversion.
Yes, I do see the head and shoulders pattern. Patterns aren’t as reliable as some might have you believe.
Now, on to the more recent trades…
iShares MSCI India Index ETF (INDA) weekly
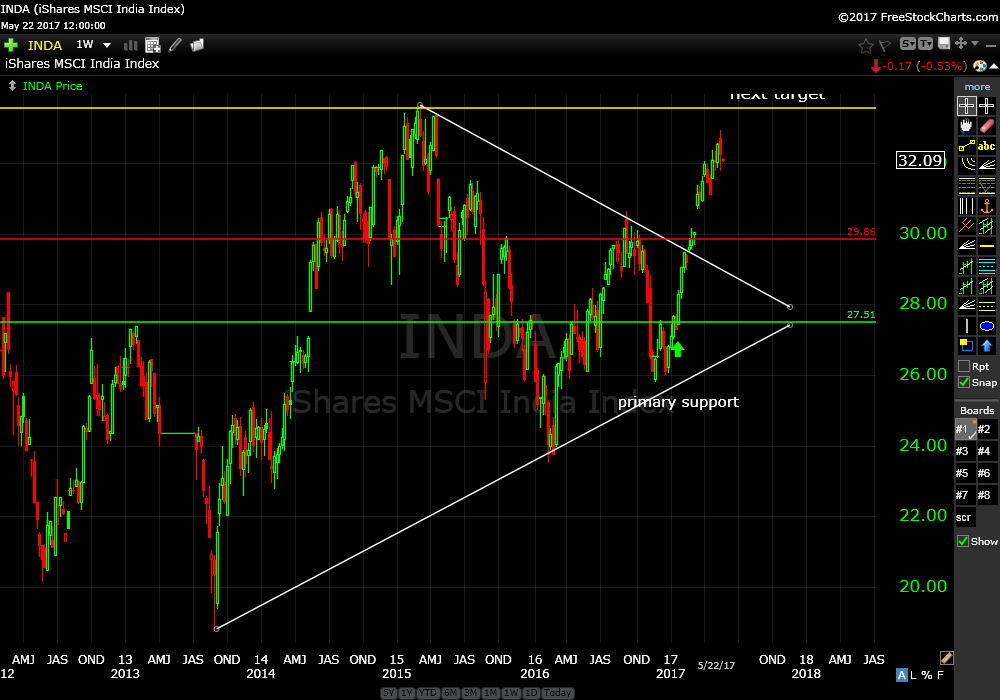
Sometimes, making money in the biggest and toughest game in the world is like taking candy from a baby.
Up 16% from January 17, 2017. Next target is $33.50, yellow horizontal line which represents highs from 2015.
Medtronic PLC (MDT) daily
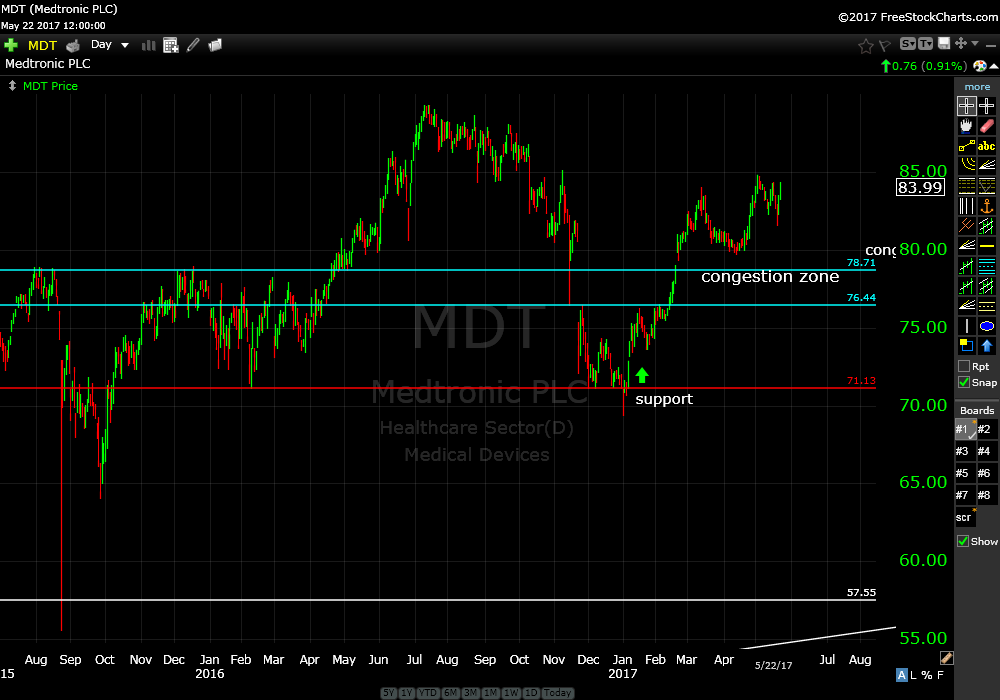
Up 12% from January 17th. Got this one on sale as well. Let it ride.
Global Social Media Index ETF (SOCL) daily
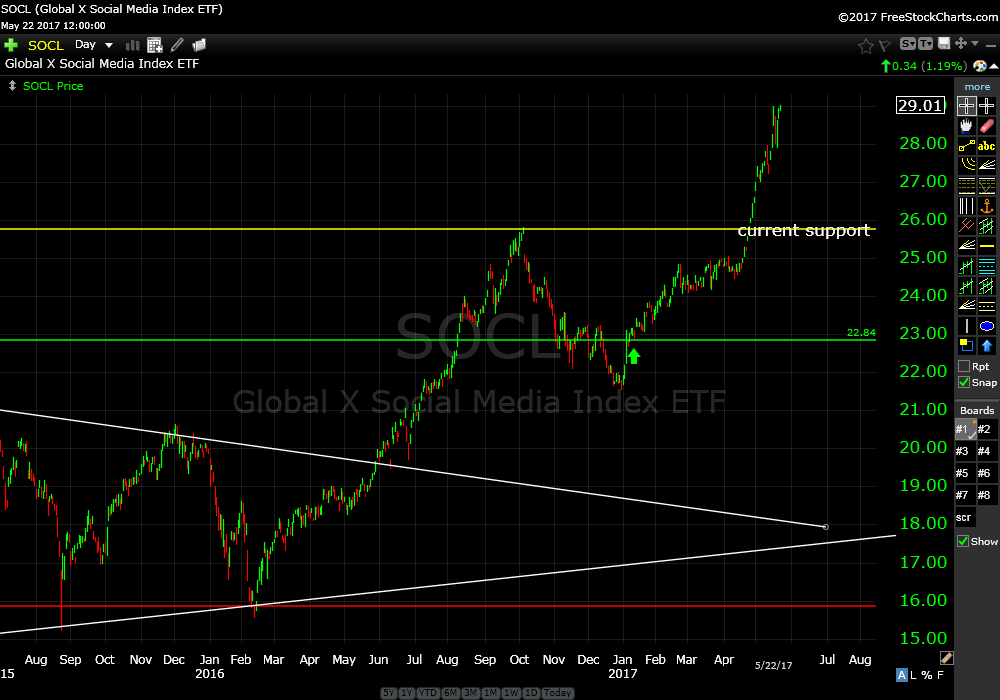
Up over 24% from January 17th. Continue to hold. Just click “Like”. Next target $500.
Lamar Advertising Co A (LAMR) daily
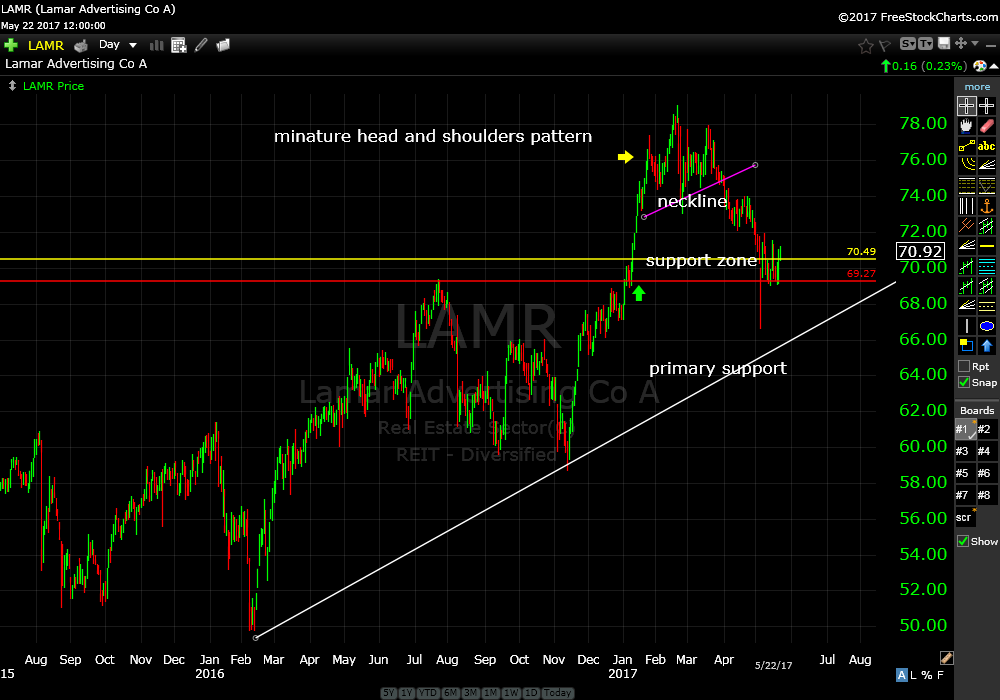
Loss of about 3% from January 17th. There was a little bearish head and shoulders pattern and when the neckline (purple line) broke we could have exited the trade for a short term gain.
Don’t forget, the more you compress time in your trading the more difficult it becomes to capture up trends that can last for years.
Price has bounced off support zone. Continue to hold.
Facebook Inc (FB) daily
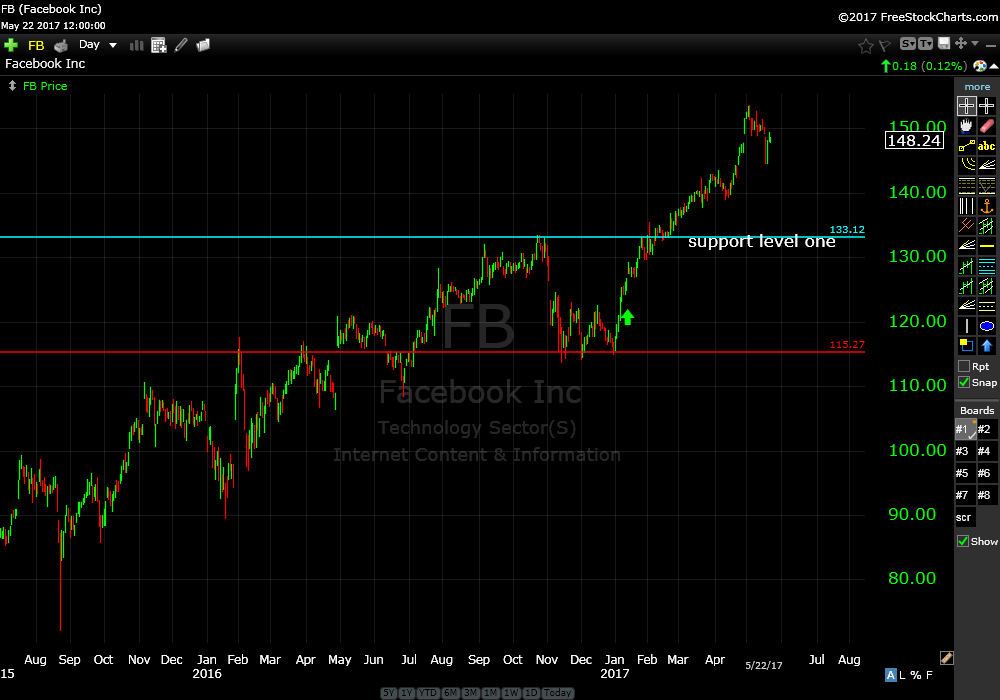
Up 15 % from January 17th. Price has ripped higher from our buy recommendation and made new highs. I “Like”.
Continue to hold.
iShares Barclay’s 20+ Year Treasury Bond Fund ETF (TLT) weekly
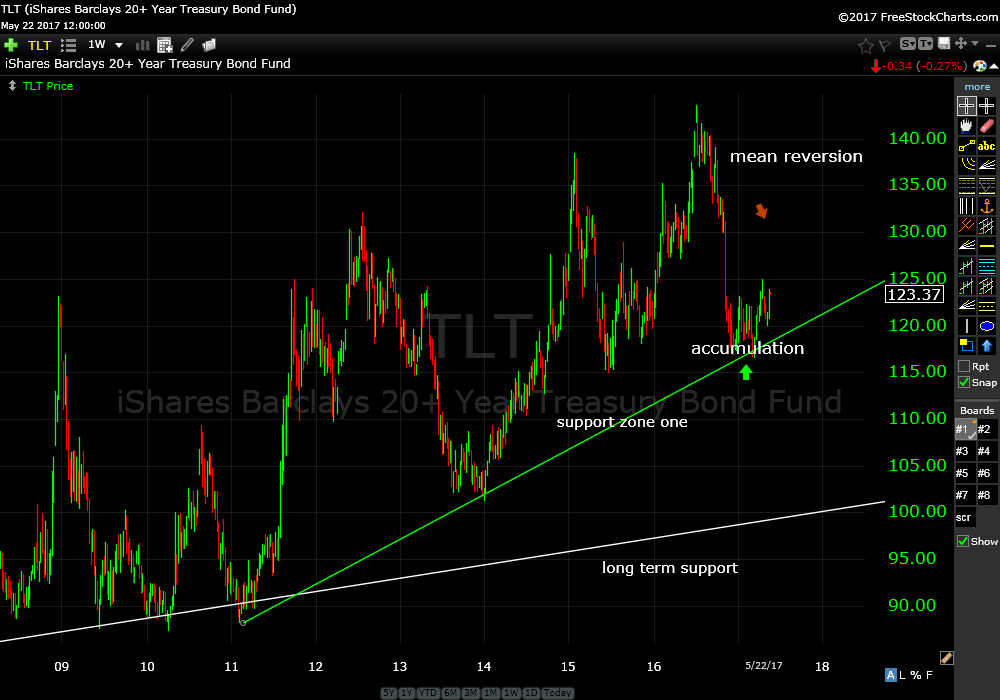
Up about 2%. Continue to hold. Accumulation taking place along and above support zone one. Plus, it’s probably a good hedge.
Schwab International Equity ETF (SCHF) daily
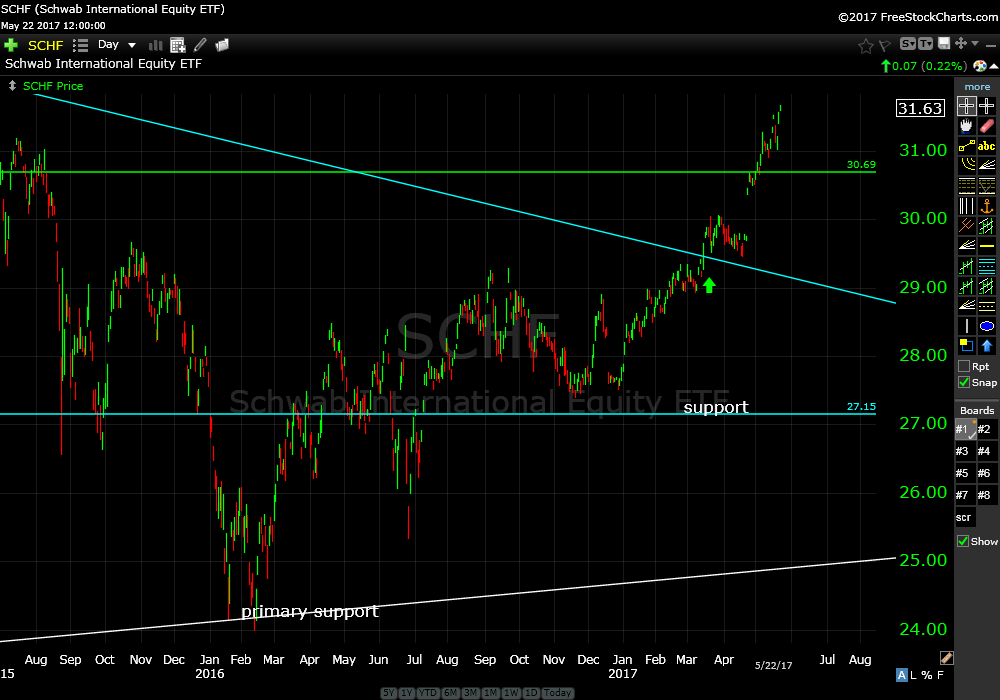
Up 6% in two months. Continue to hold. Next target is $32.
It’s on a run, let it go.
SPDR EURO STOXX ETF (FEZ) daily
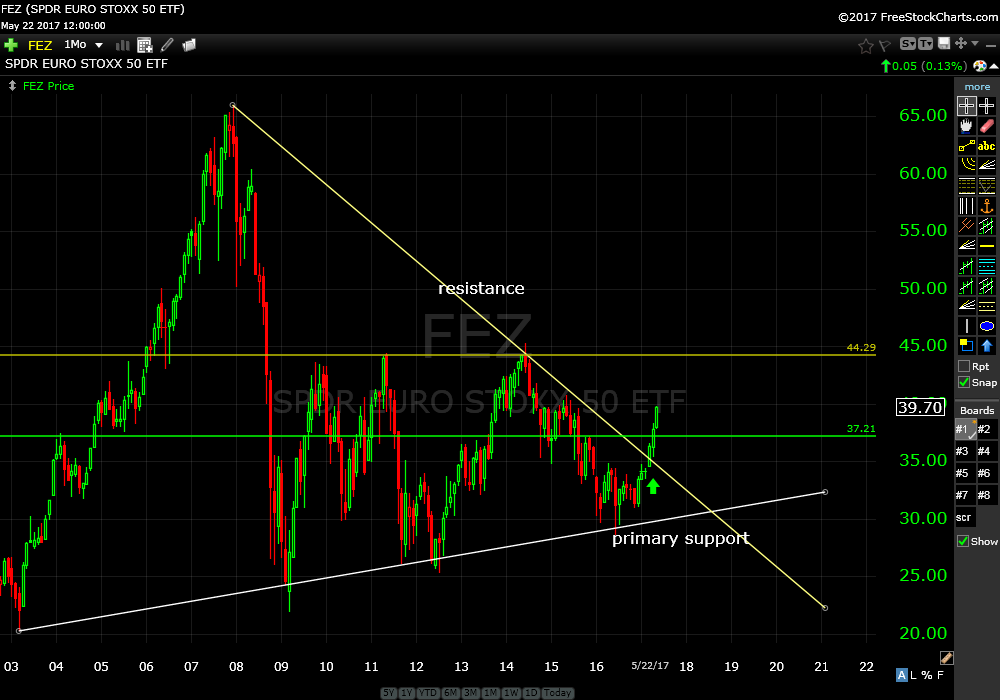
Up over 9% from March 29th.
You can see on the monthly chart that price ripped higher after clearing resistance shortly after our recommendation. Our next target is $44.
iShares Core MSCI Emerging Markets ETF (IEMG) weekly
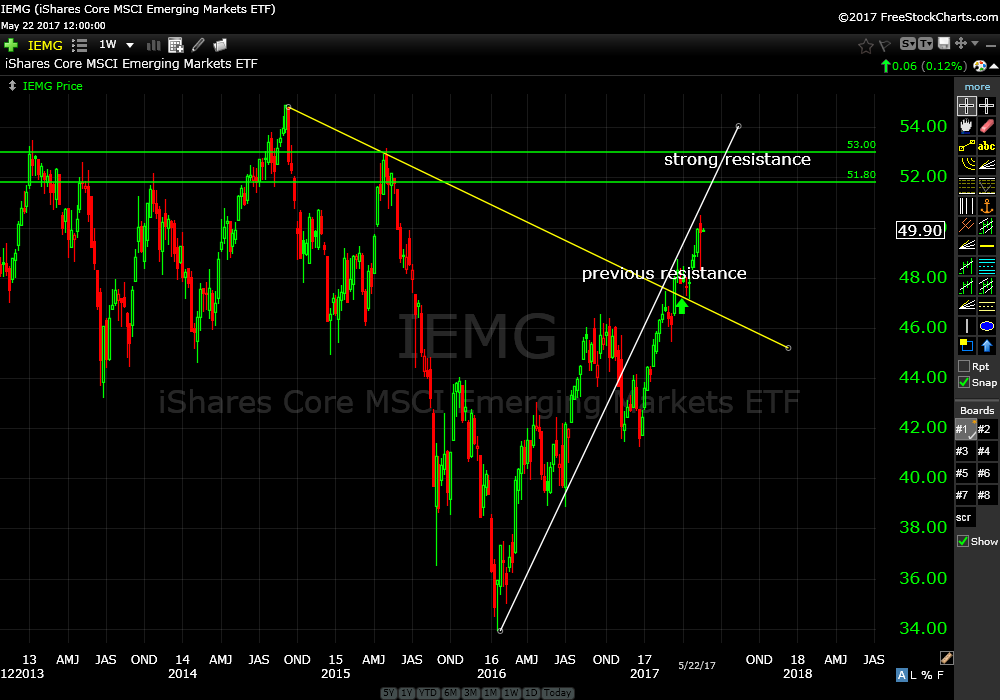
Up about 3% from March 29th after our recommendation and breaking previous resistance, the yellow down sloping trend line.
Looking at the weekly chart you can see price is running into strong resistance where price has been rejected in 2013, 2014 and 2015. $52 is our next target area.
South Korea Index Fund ETF (EWY) weekly
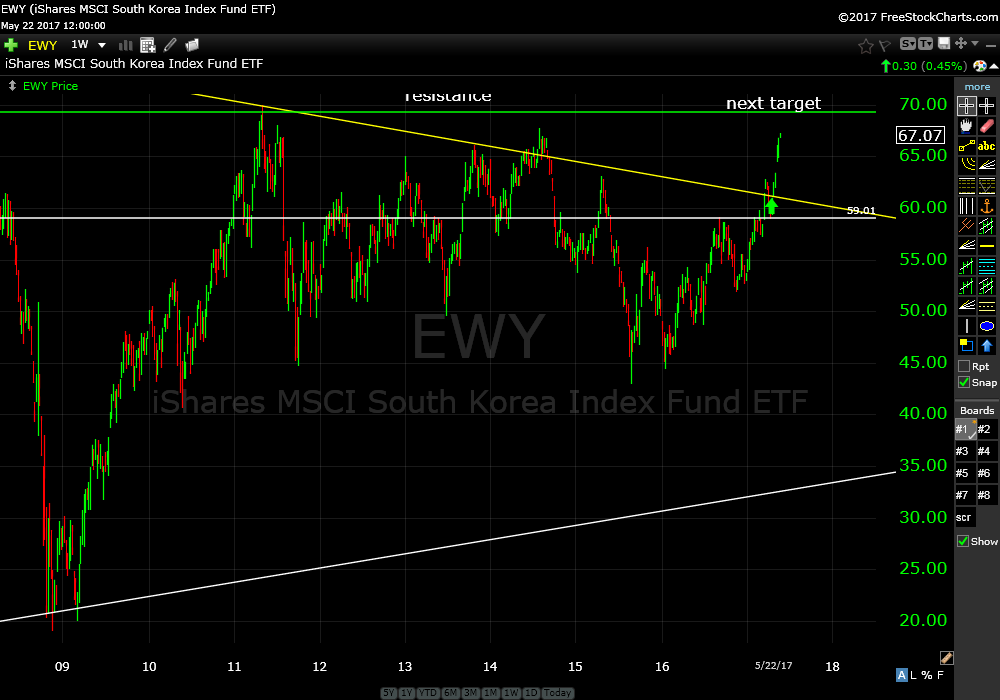
Up about 7% from March 29th. Next target is $69. Continue to hold.
iShares MSCI China Index Fund ETF (MCHI) weekly
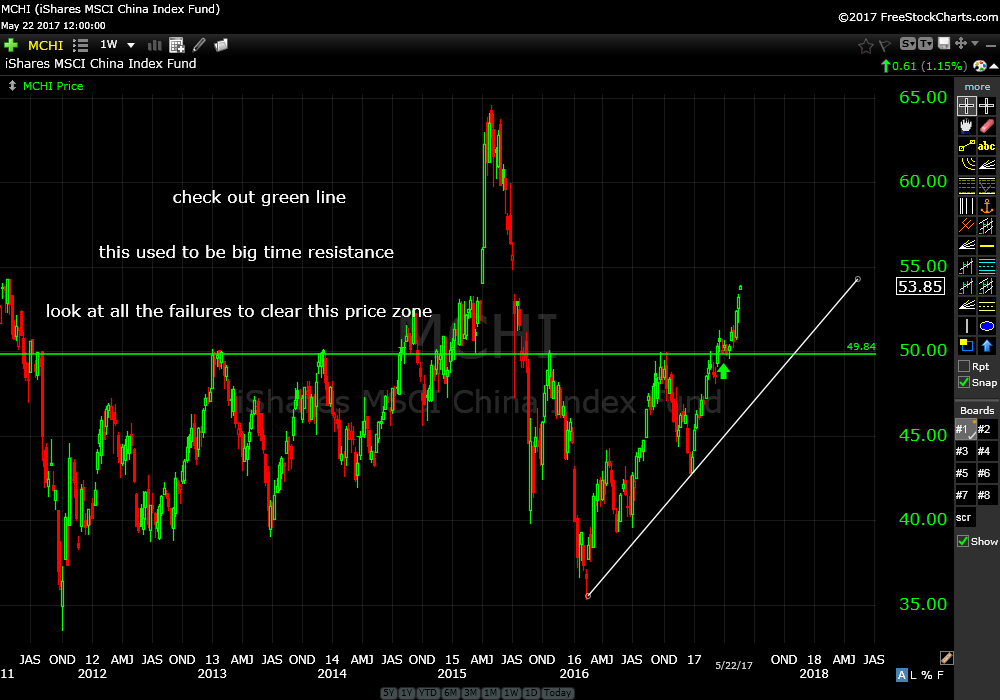
Up about 7% from March 29th. Just blasted off after clearing this multi year zone of resistance. Price might stall in this area. We will see.
iShares MSCI Japan Index Fund ETF (EWJ) monthly
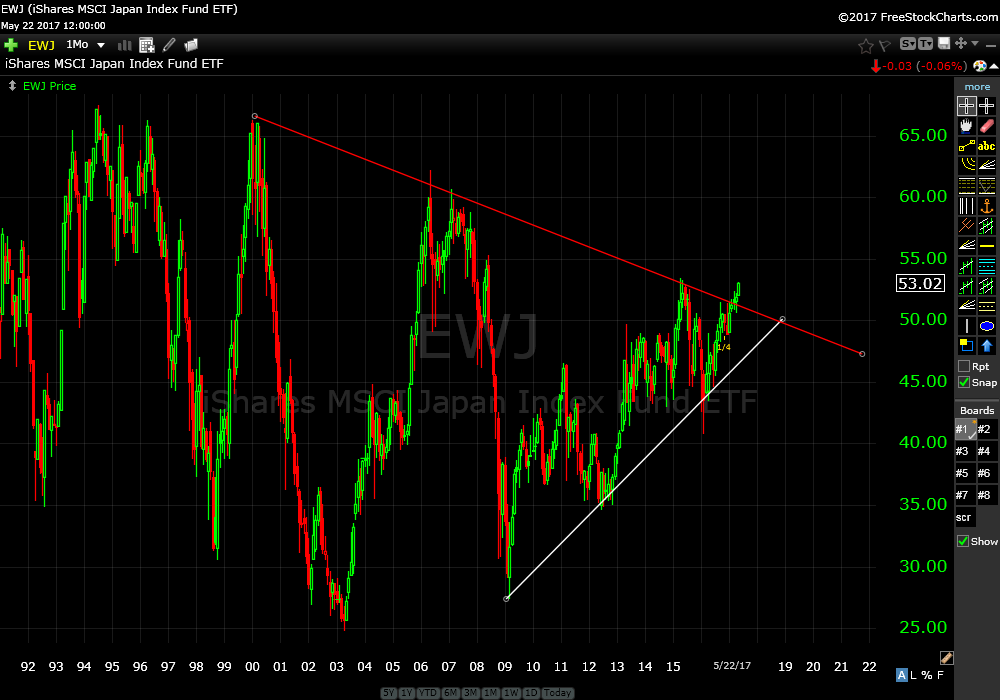
Looking at a monthly chart, Japan appears to be breaking out as well.
Continue to hold MCHI.
Tesla Inc (TSLA) weekly
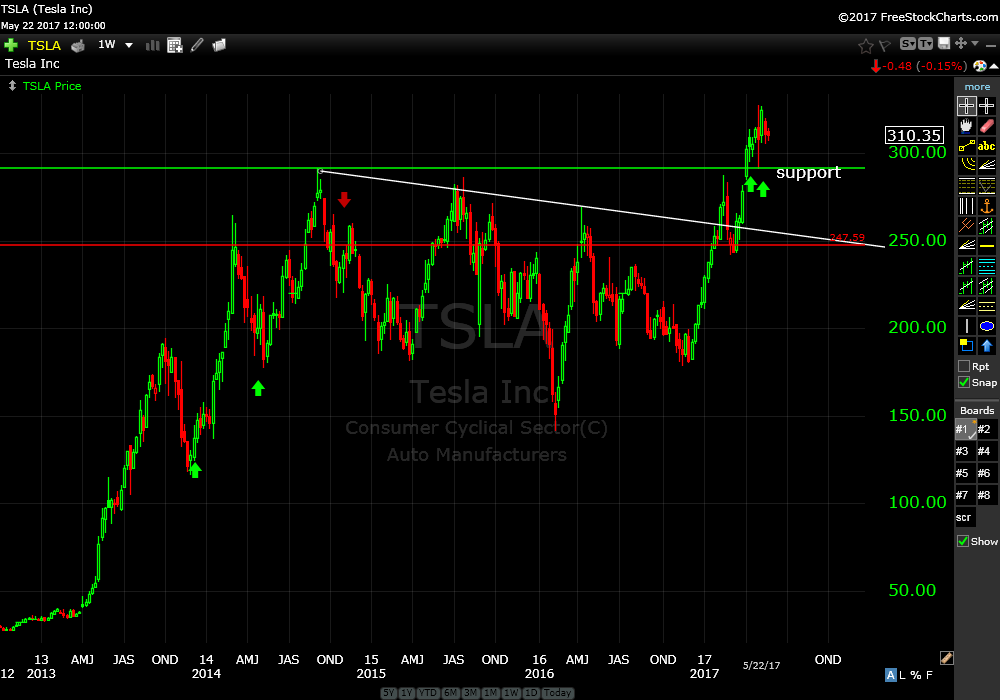
I just love Tesla. We have called price action on TSLA pretty well over the past few years. I want one too.
We recommended buying TSLA on April 4th and May 8th. We are up a little. Continue to hold.
SPDR’s Select Sector Energy ETF (XLE) monthly
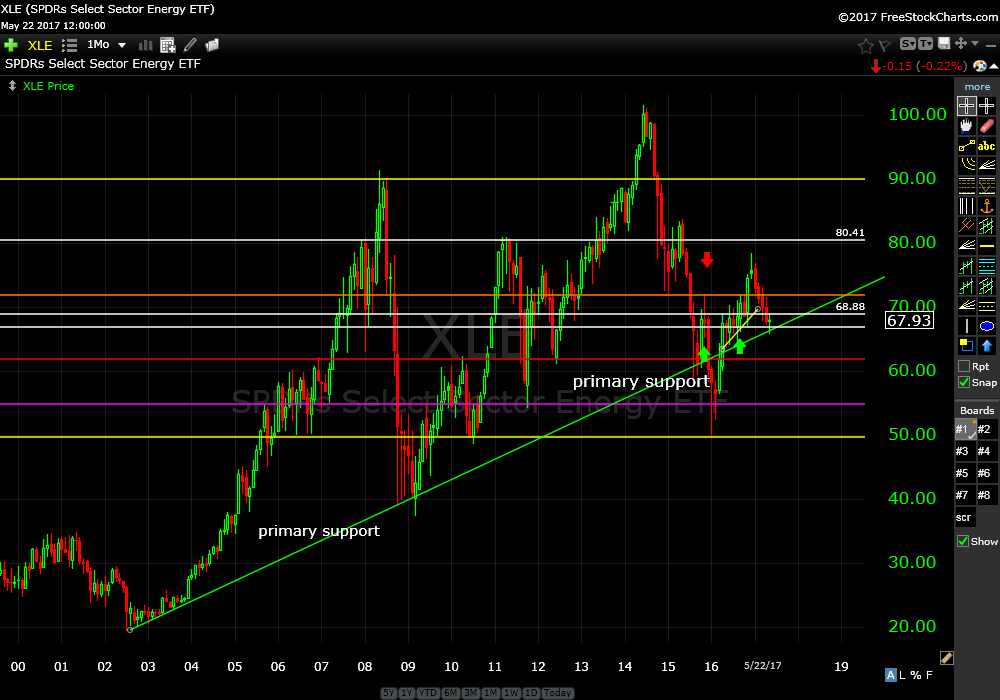
Just recommended on May 8th. It’s inching up on primary support from 2002. It’s a good entry even if it turns out to be wrong.
Amateur traders don’t like to take losses. Professional traders accept losses.
And finally…
Who doesn’t like Apple Butter?
Jm Smucker (SJM) weekly
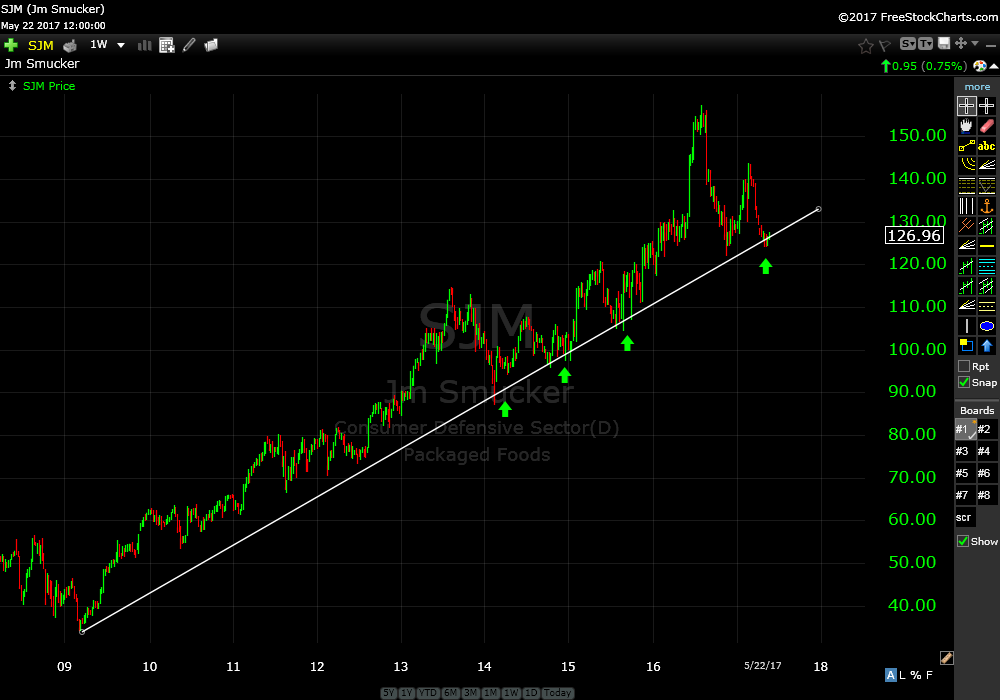
It’s on sale for 20% off. Nice mean reversion. I recommend it. I’m buying some.
Performance as of Monday, May 22nd closing prices.
Trade Smart,
Don