Intel Corp (INTC) monthly
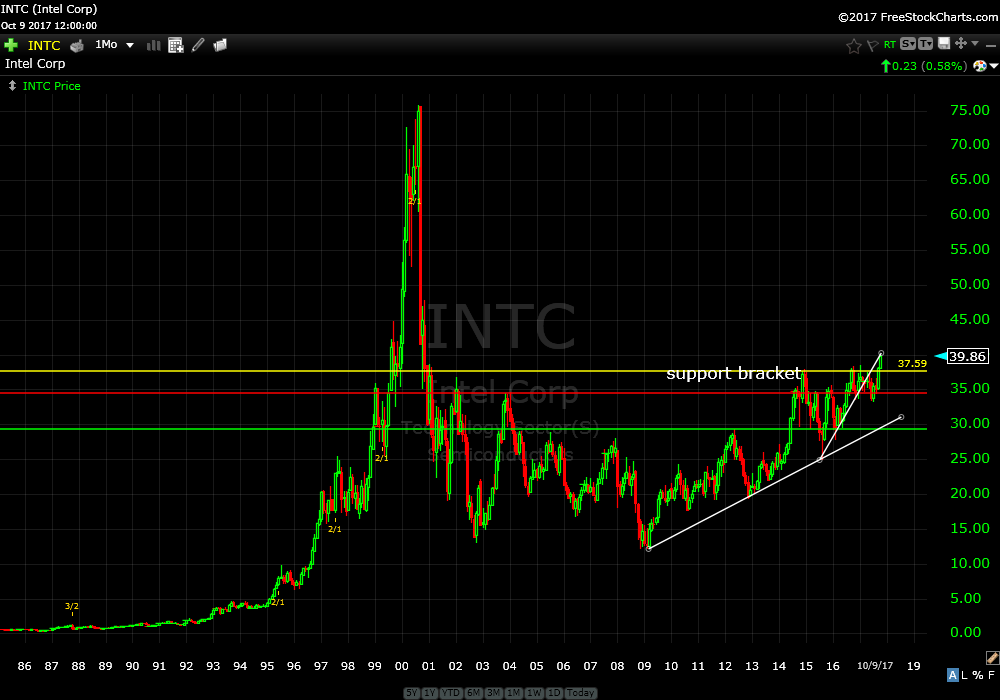
If you look at the monthly chart you can see price has remained under $35 since the Dot Com crises 16 years ago. Price has finally broken out. This is very positive price action that should get noticed over the next few months and probably get bid higher.
Intel Corp (INTC) weekly
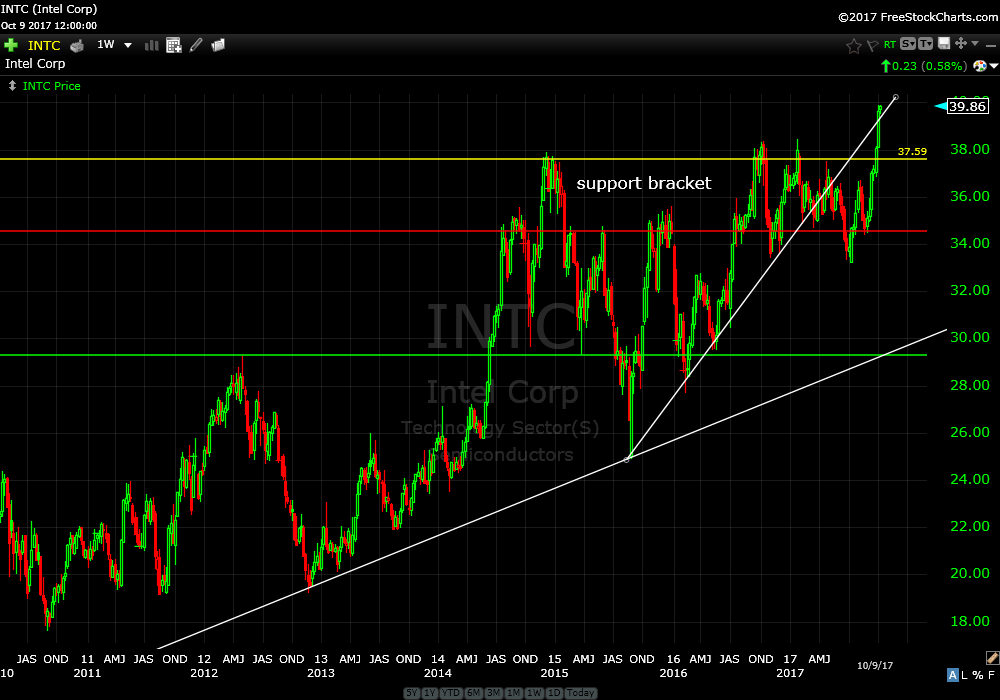
Looking at the weekly chart, you can see the support zone that is between the yellow and red horizontal lines. Real risk is under $35 so about 15%. You can always exit with closes under $37, yellow line, but that might be too close to let price action play out.
So, to do this trade correctly is to do it right. Plan on risking 15%…closes below the red horizontal line.
I’m buying some tomorrow.
Know your risk.
Trade Smart,
Don