What’s on the docket for today?
- A trade alert,
- A couple potential opportunities on the horizon,
- And a quick check on our XLE recommendation.
Let’s get into it.
KBR Inc (KBR) weekly
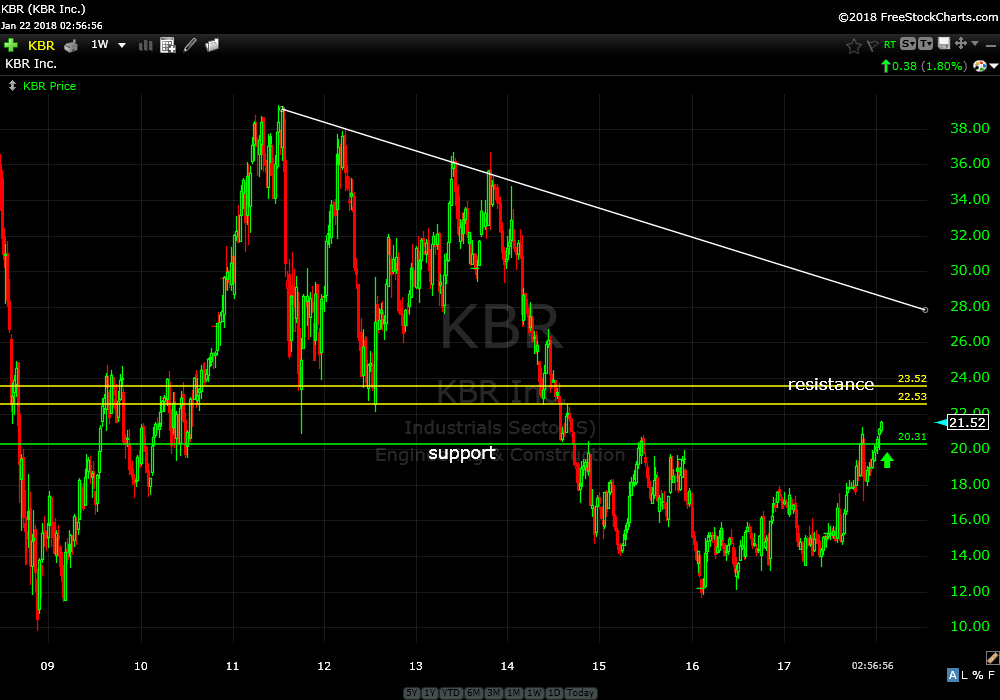
Price just cleared resistance (green horizontal line) which is now support and is approaching higher resistance (two yellow lines). A good three year base from 2015 through 2017 should provide a good foundation to continue higher. Next hurdle is clearing $24. I’m rating this a buy.
HAL and XOM are looking interesting as well…not quite yet though.
SPDR’s Select Sector Energy ETF (XLE) weekly
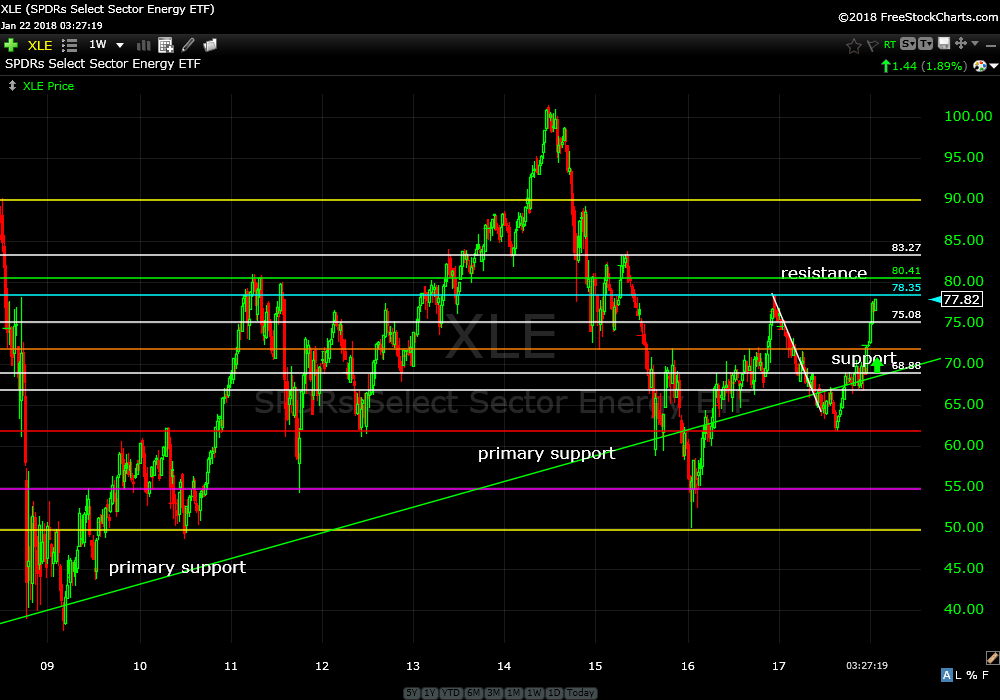
My recent XLE recommendation is up about 4%. Looking at the weekly chart you can see price is approaching resistance, the area bracketed by the blue and green horizontal lines. This price zone is important for the entire energy sector. If price can clear this zone the next hurdle is $83.
Continue to hold all open positions.
Trade Smart,
Don