Days like Friday make me sick to my stomach. It would have been so much easier to erase 16 days worth of gains in a slower fashion. Say, maybe slash 1,000 Dow points over a few weeks. Why the rush to take it all away in a week and most of it gone in one day. Stupid.
There is no predicting this kind of move except to say they happen every so often. So, now what…
SPDR’s S&P500 Trust Series ETF (SPY) daily
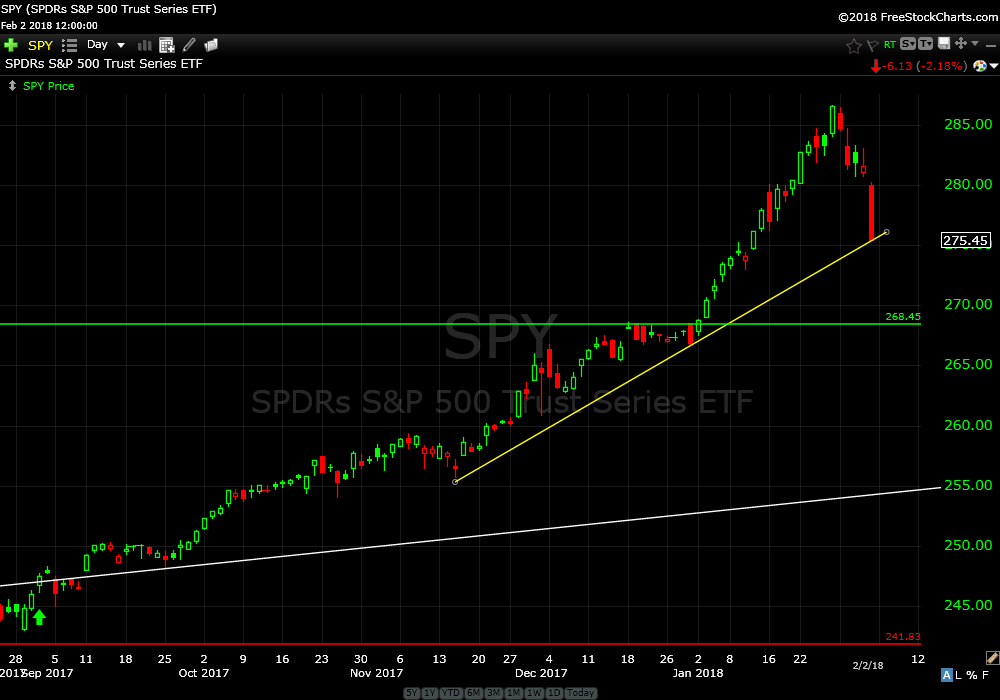
The daily chart shows Friday’s close right on top of short term support, the yellow upwards sloping yellow line.If price breaks this level soon I expect price to correct down to around $268.
SPDR’s S&P500 Trust Series ETF (SPY) weekly
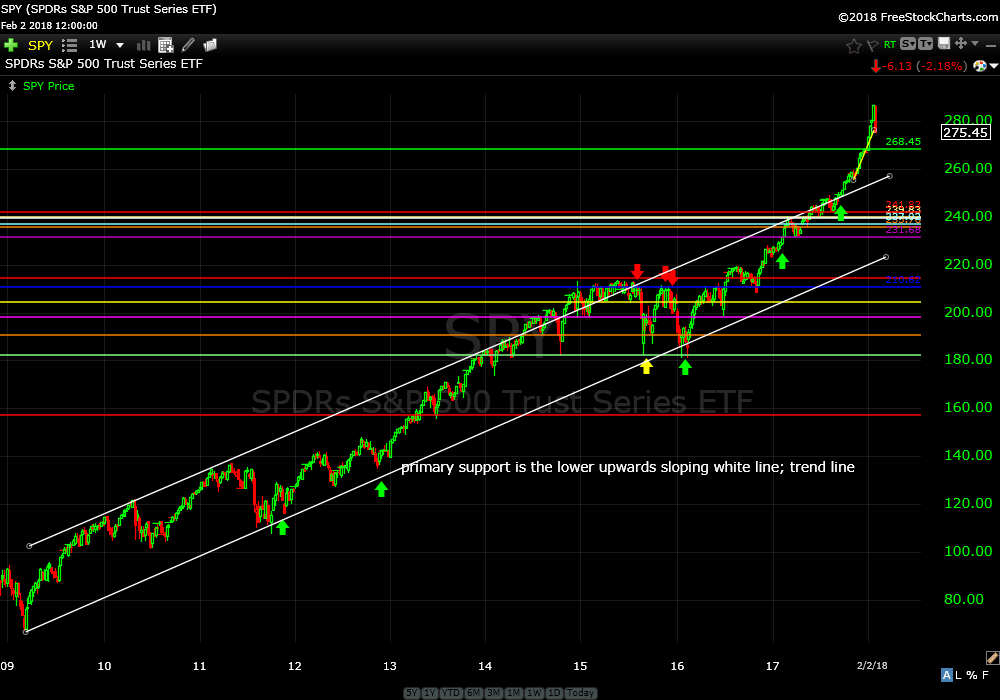
See the weekly chart for some perspective. If price fades back to a more supportable slope path it will be healthier for price to stair-step higher. So, fasten your seat belts for the near future.
SPDR Dow Jones Industrial Average ETF (DIA) daily

This daily chart, unlike SPY, shows price violated short term support (yellow line) on Friday. The next good support level is $248 which is about 700 Dow points lower.
Power Shares QQQ Trust Ser 1 (QQQ) daily
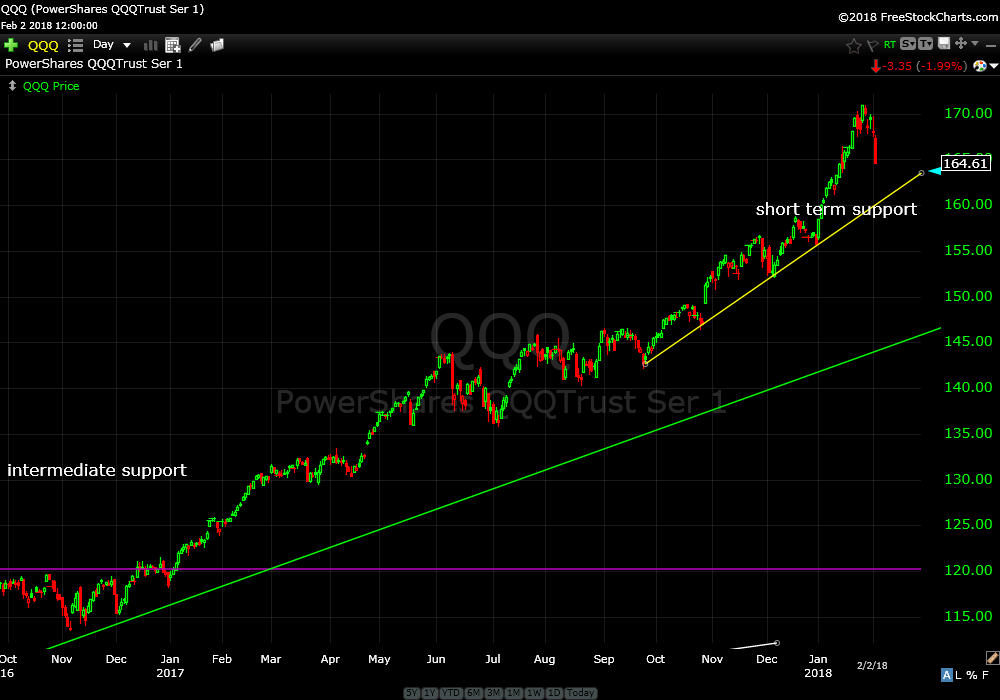
The daily chart shows price is trading above short term support (yellow line).
Power Shares QQQ Trust Ser 1 (QQQ) weekly
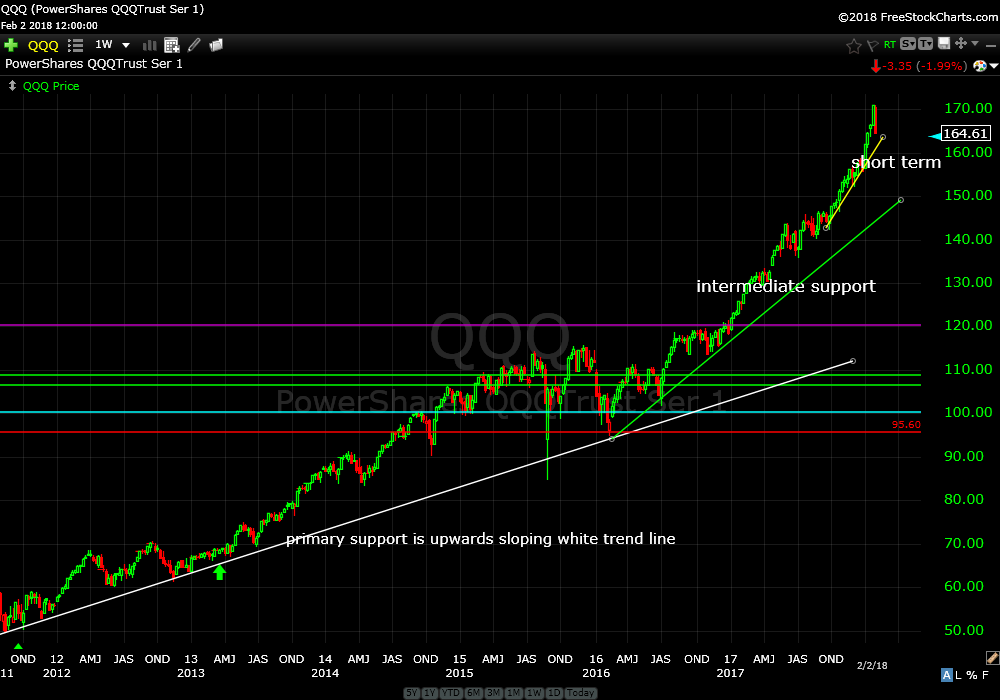
The weekly chart shows that a correction down into intermediate support (green line) would be quite reasonable. Painful but reasonable.
At first blush, overall price action looks to be reverting to lower levels before the next leg up. This is by no means some sort of signal that the bull market is over. Don’t believe anyone that tells you otherwise at this point.
Remember, the stock market is attempting to fool the most people at the same time so this could just be a big flush of new money.
Energy got crushed as well this week.
SPDR’s Select Sector Energy ETF (XLE) daily
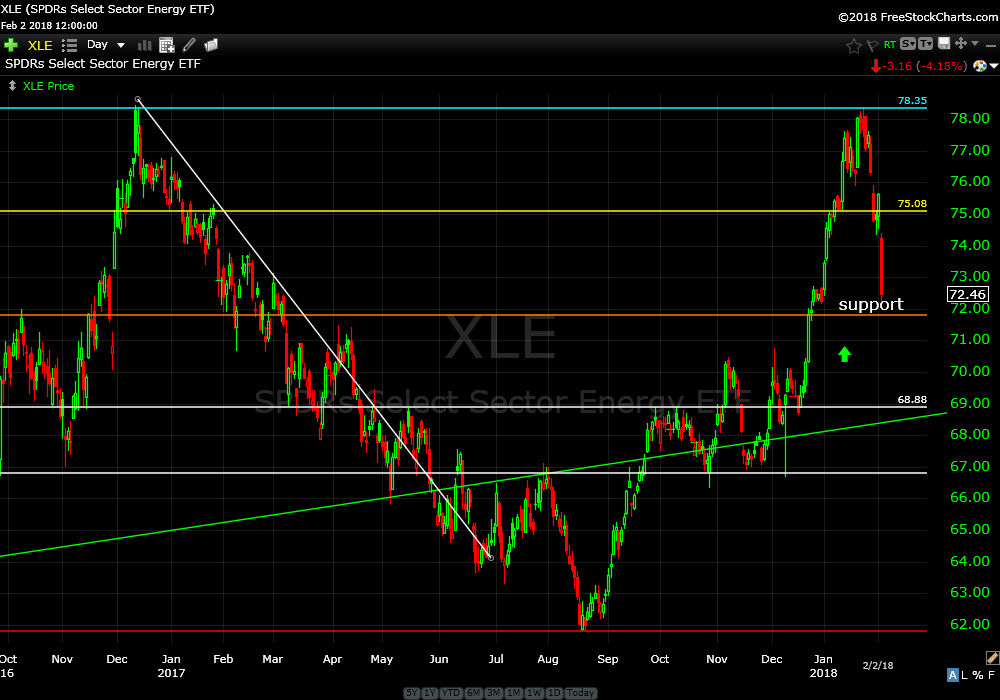
XLE has dropped 7% almost into support (orange line) this past week. Could this be a buying opportunity? We should know fairly soon.
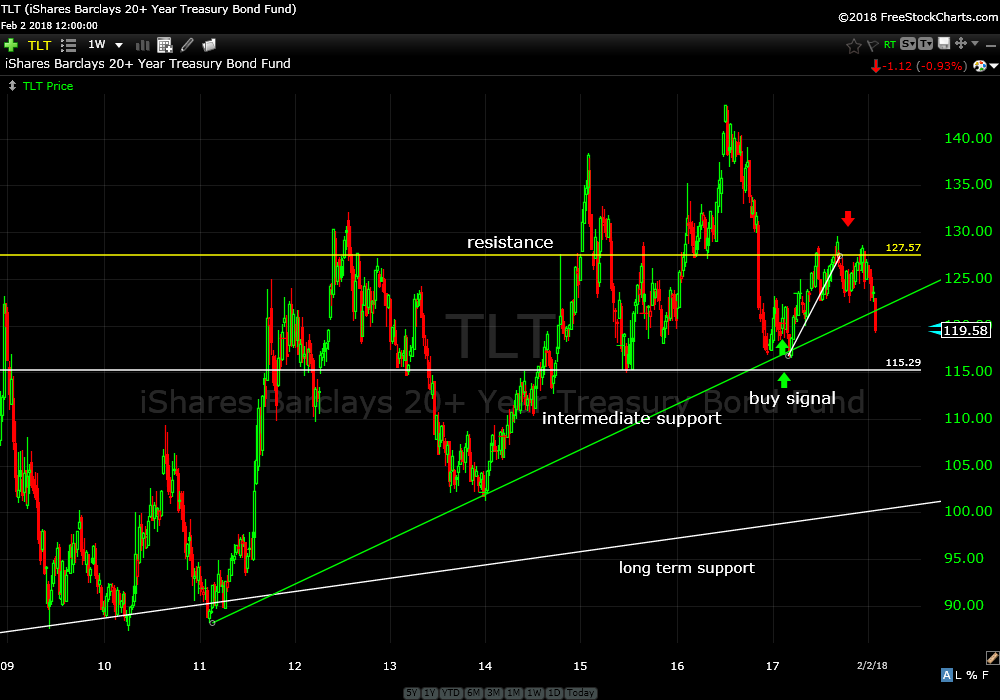
Believe it or not I’m not recommending selling anything yet. I do think there is a bit more pain ahead though. TLT, the ETF iShares Barclays 20+ Year Treasury Bond fund has broken intermediate support, the upwards sloping green line. This might be problematic for equities.
iShares Barclay 20+ Year Treasury Bond Fund (TLT) weekly
Friday was really ugly but it’s not wise to make decisions on one days worth of price action. Sometimes its hard to do nothing.
Trade Smart,
Don