Another day with huge range and big volume. SPY, the SPDR’s S&P 500 Trust Series ETF recovered about half of Monday’s losses. The Dow had similar price action.
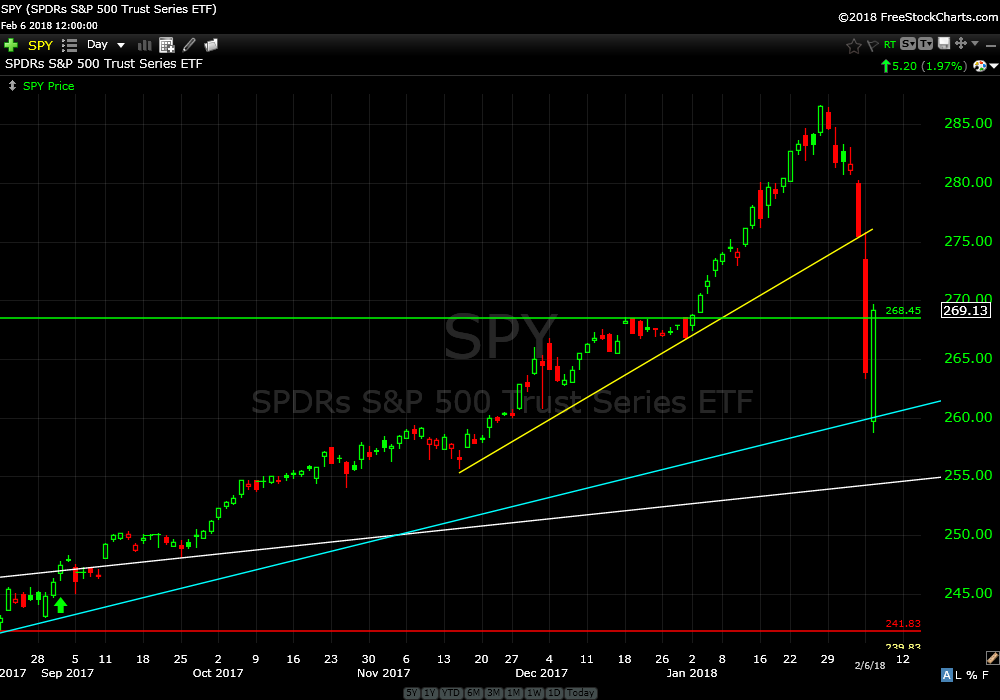
The SPY daily chart shows price traded down into support (upwards sloping blue line) and bounced exactly on this support level and proceeded up from there. The Dow (DIA) looks the same.
SPDR’s S&P 500 Trust Series ETF (SPY) daily
In fact, all open positions are bouncing on pretty good support. If price can work its way to bottom at these levels (today’s lows) we have a good chance to work higher.
I think this still needs to play out over a few weeks but I am looking forward to buying opportunities.
I actually bought some DIA on Monday and some AAPL today. These are pretty high risk trades with the market moving so fast. For this reason, I didn’t recommend these trades.
Keep your seat belts on please.
Trade Smart,
Don