It all began on Friday, February 2nd. That was the day of the first big sell off. The low that day on SPY was 275.41. Price has since round tripped to almost the penny of that low with a high of 275.32 last Friday, closing at 273.11.
SPDR’s S&P 500 Trust Series ETF (SPY) daily
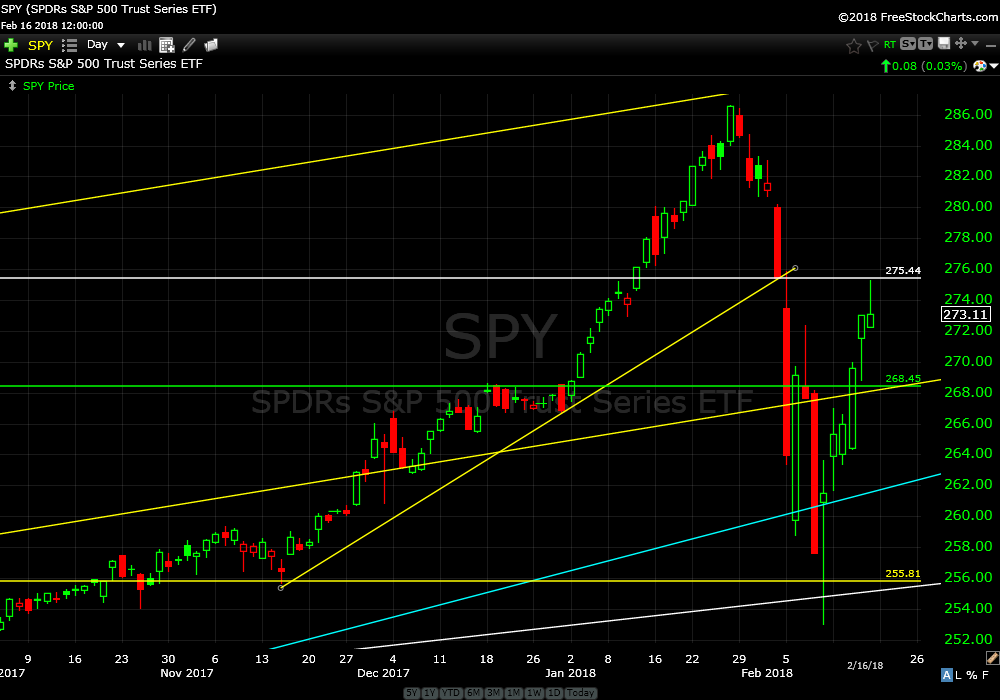
I was surprised at the speed of the “correction” and I’m surprised at the speed of the “recovery”. I expected more back and fill, more testing of the lows. Maybe we will get that this coming week. Volatility is not over.
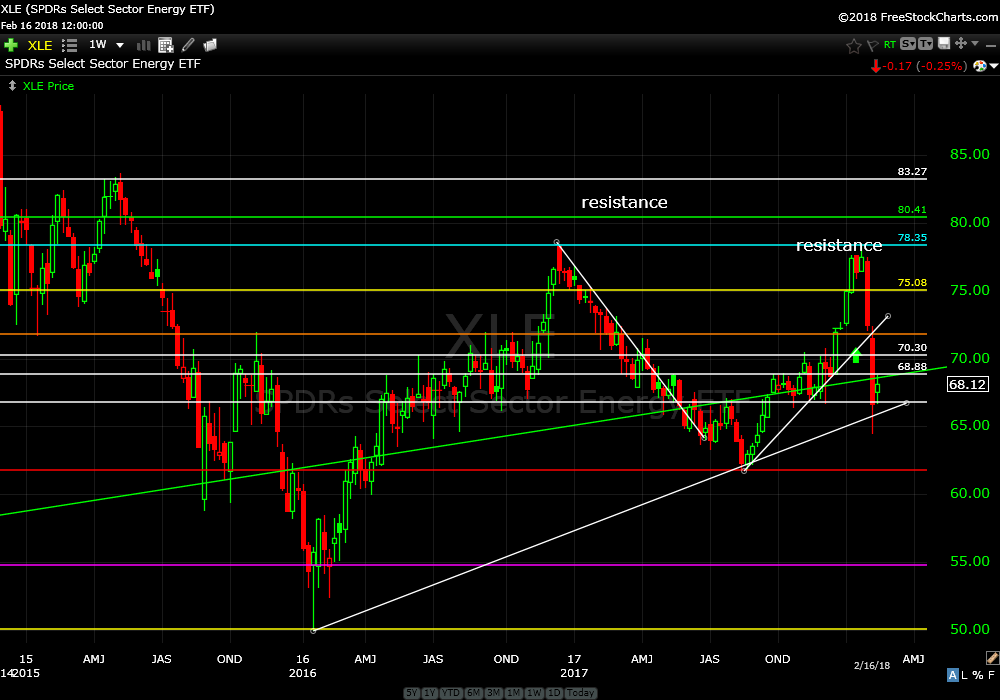
Energy (XLE) has not recovered as well as the broader market however it’s a less crowded trade than prior to the dump. Plus, price has pretty good support underneath current levels. Continue to hold.
SPDR’s Select Sector Energy ETF (XLE) weekly
What has performed well?
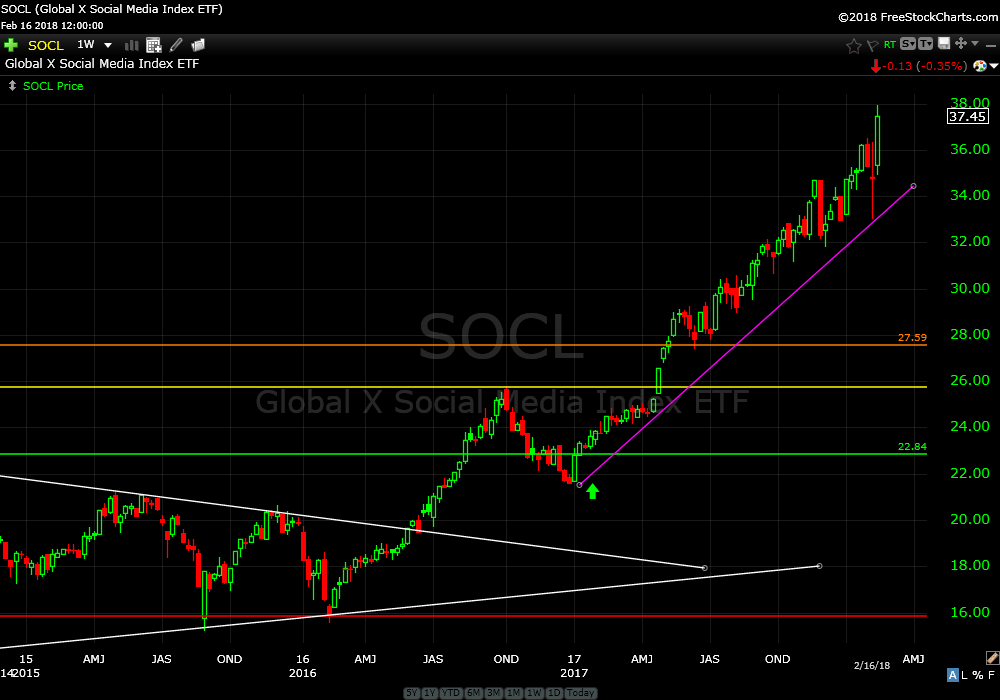
The ETF for social media (SOCL) made new highs this week. The top four components are Twitter Inc, Tencent Holdings Ltd, Facebook Inc and Snap Inc. Continue to hold.
Global X Social Media Index ETF (SOCL) weekly
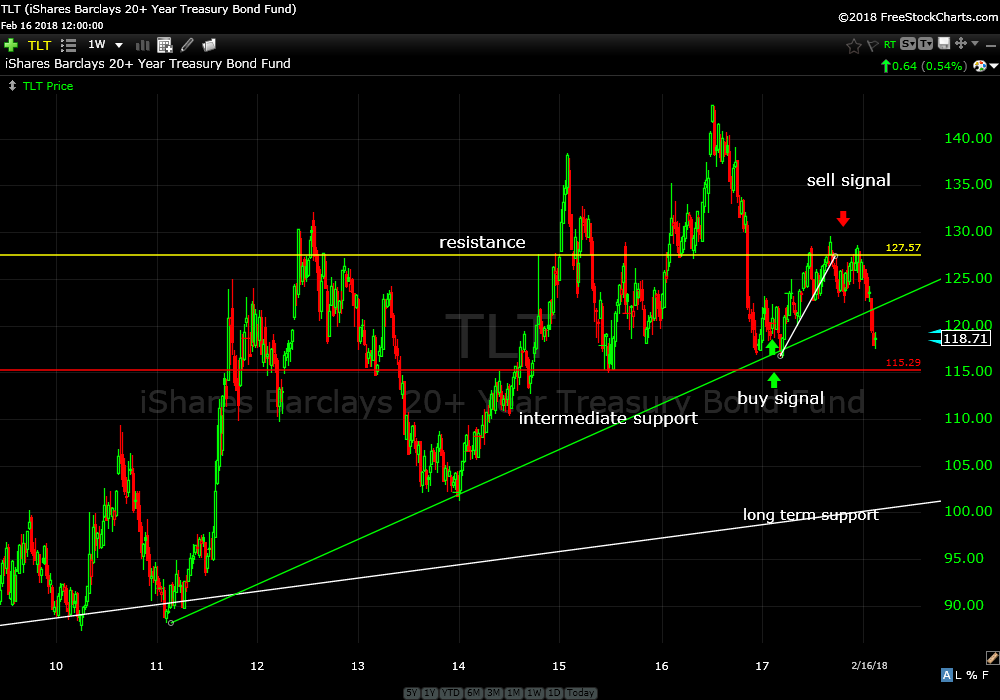
Interest rates continue their recent rise. You can see on the weekly chart of TLT, the ETF for 20+years Treasury Bonds, that bond prices continue to fall and have traded down through intermediate support, the upwards sloping green line. Price action indicates higher interest rates as bonds track towards the 115 price level.
iShares Barclays 20+ Year Treasury Bond Fund (TLT) weekly
$US has been falling since early 2017 and is currently just above support, the purple horizontal line. If this support level fails we are likely going lower.
Power Shares DB US Dollar Index Bullish Fund (UUP) weekly
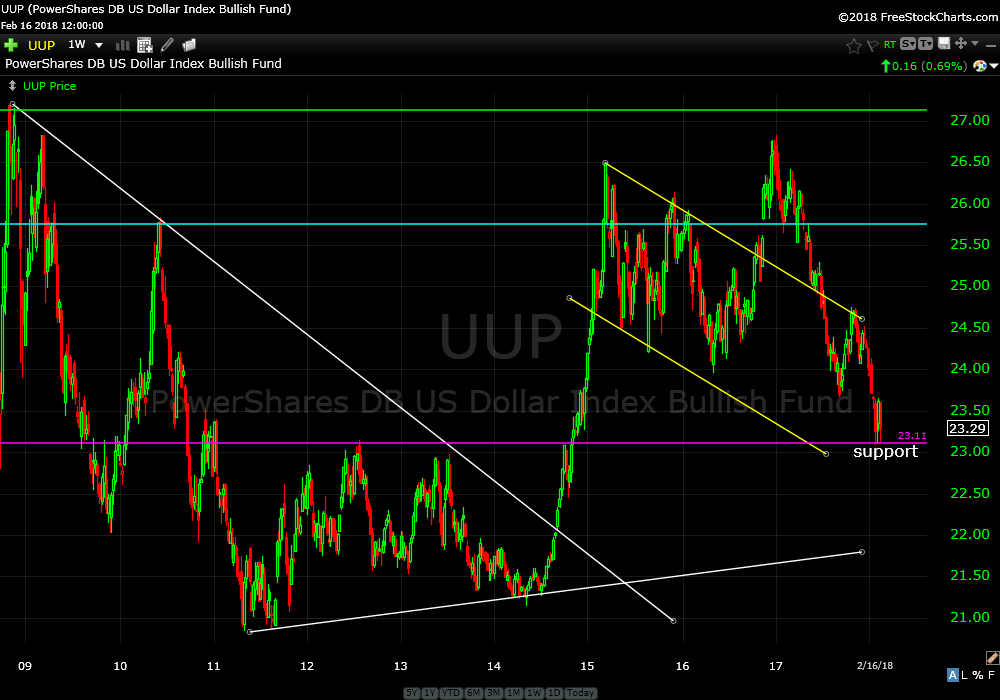
For the past few years the $US has been rising and interest rates have been falling, however, since early 2017 the $US has been falling and interest rates began to fall into suit and drift lower until recently. The recent sudden spike in rates might support a stronger $US considering price support under UUP. But, then you have to price in the deficit, inflation expectations, Fed speak and the barometric pressure of Peru. Too confusing for me. I’ll just rely on price action relative to key levels.
What isn’t confusing is that price action will continue to try and confuse us. What “feels” wrong is usually right. It feels like equity prices will test recent lows over the coming days. Buy signal? Ha!
Continue to hold all open positions and tighten your seat belt a little bit.
By the way, I’m on the beach in Mexico writing this. Isn’t technology great?
Trade Smart,
Don