Although it’s reasonable to expect equity prices to fade back inside of the rising channel from the bottom in 2009 the reality is that no one knows what will happen.
Last weeks price action paints a pretty clear picture of the confusion. The weekly chart of DIA, the ETF proxy for the Dow, shows last week’s wide range of price action (5%) and narrow weekly change (.5%). After spending the week all over the map DIA closed within .5% of the open on Monday. Technically speaking, investors are confused.
SPDR Dow Jones Industrial Average ETF (DIA) weekly

DIA and SPY closed Friday right at the support level that represents the upper bracket of the rising channel from the bottom in 2009 (see weekly charts from the 2009 bottom). I don’t consider closing below this rising level very important. In fact, I consider it healthy and needed to sustain reasonable growth. See DIA daily chart.
SPDR Dow Jones Industrial Average ETF (DIA) weekly (ww)

SPDR’s S&P 500 Trust Series ETF (SPY) weekly

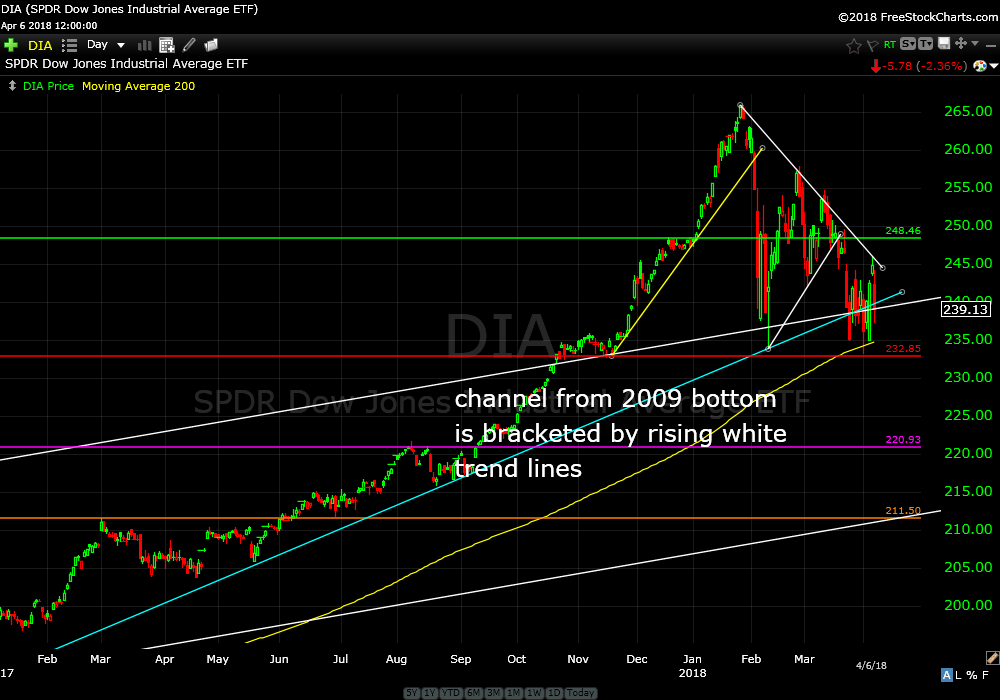
SPDR Dow Jones Industrial Average ETF (DIA) daily
I think recent price action in equities, bonds and the $US has confused all of us into a daze. Have you bought anything recently? I haven’t bought anything since MJ a month ago. I’m sure most of us mortals are sitting on the sidelines waiting for some confirmation that a bottom has been put in or there is a wholesale change unfolding.
I think it’s totally reasonable to be patient considering recent price action. I am secretly getting excited about potential buying opportunities at lower prices while I gag when the Dow finishes down 500.
Be brave and Trade Smart,
Don
PS. Continue to hold all open recommendations.