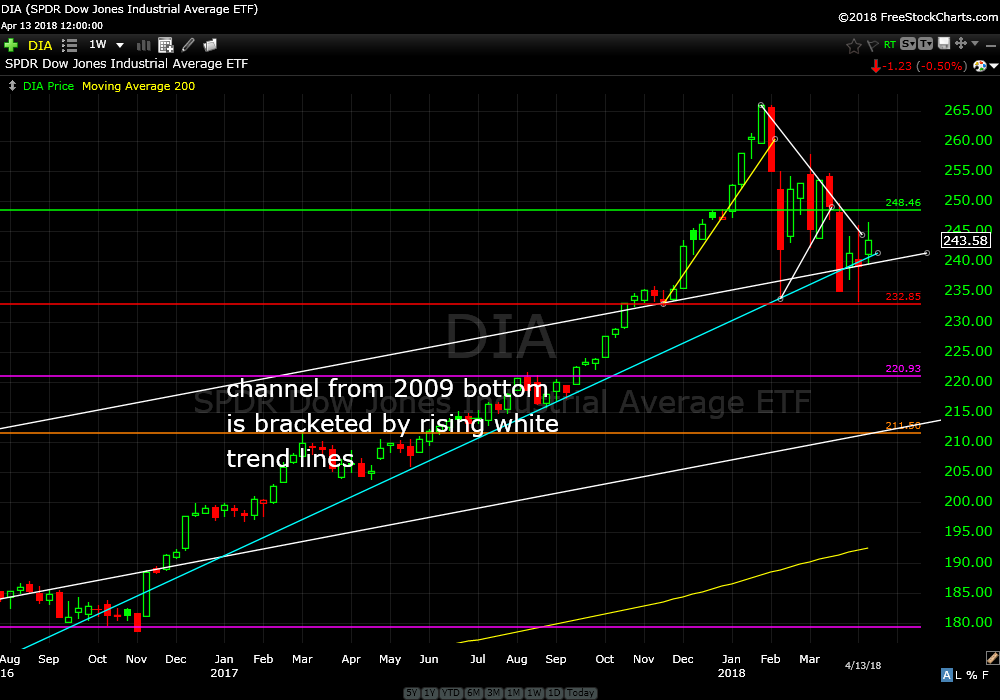
The Dow, S&P 500 Index and Nasdaq all finished moderately higher last week with less extreme price action. The weekly charts for DIA, SPY and QQQ show price is still above the rising channel from 2009.
SPDR Dow Jones Industrial Average ETF (DIA) weekly
SPDR’s S&P 500 Trust Series ETF (SPY) weekly

PowerShares QQQTrust Ser 1 (QQQ) weekly

The big mover last week was energy. XLE, the S&P 500 Energy Sector ETF gained 6% after eight weeks of churning above support from the bottom in early 2016.
The top four components of XLE are Exxon Mobil Corp (XOM), Chevron Corp (CVX), Schlumberger Ltd (SLB) and ConocoPhillips (COP).
Exxon Mobil Corp (XOM) monthly

The monthly chart shows support from 2003 has been violated. Price action does not look good.
Chevron Corp (CVX) weekly

CVX looks a little better. Price closed the week above the high made in late 2016. That’s really the only good news considering trend line support is weak.
Schlumberger Ltd (SLB) monthly

SLB actually looks pretty good. The monthly chart shows good long term support.
ConocoPhllips (COP) monthly

COP looks good as well especially after clearing the high made earlier this year.
SPDR’s Select Sector Energy ETF (XLE) weekly

XLE looks like it wants to break out but resistance could be tough around $80. Continue to hold for now.
ETFMG Alternative Harvest ETF (MJ) weekly

MJ bounced off support last week after getting sucked into the downdraft of the market turmoil we have experienced this year. Have all the sellers left the room? I might have to buy more of this.
Tesla Inc (TSLA) weekly

TSLA jumped after tagging support from early 2016. The weekly chart also shows the 200 week moving average acting as additional support over many years. This is potentially setting up as another good opportunity. You can see the buy and sell signals I have recommended over the past few years. I love owning and trading TSLA. Stay tuned.
JD.com Inc (JD) weekly
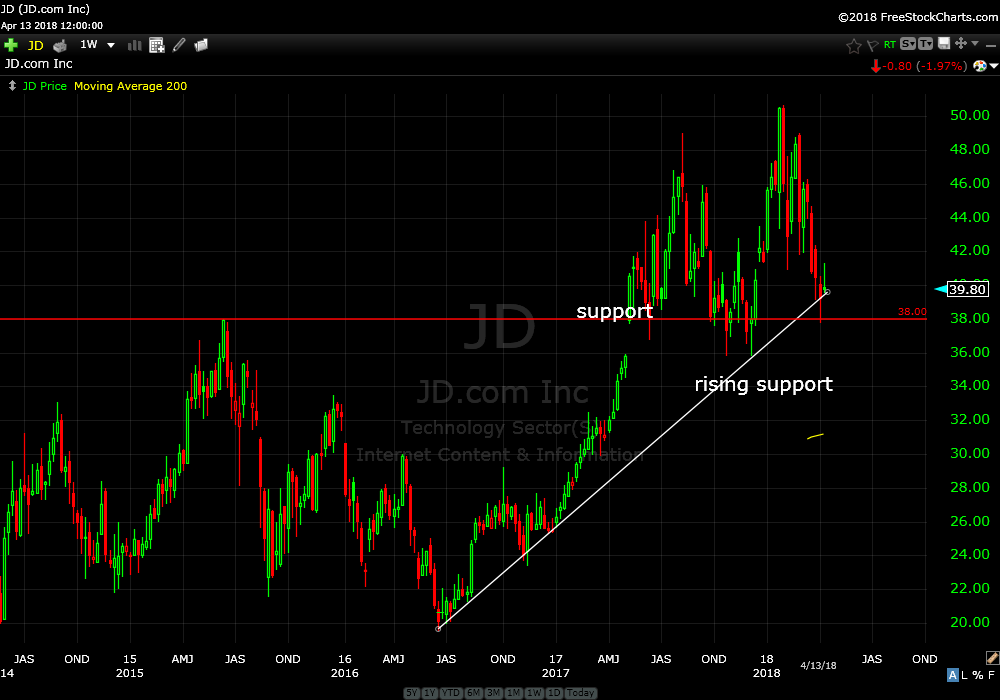
JD looks like it’s on sale. Down 20% from earlier this year price is right on top of two support levels; the high from 2015 and rising support. I’m starting to like this one. Be patient.
Celgene Corp (CELG) weekly
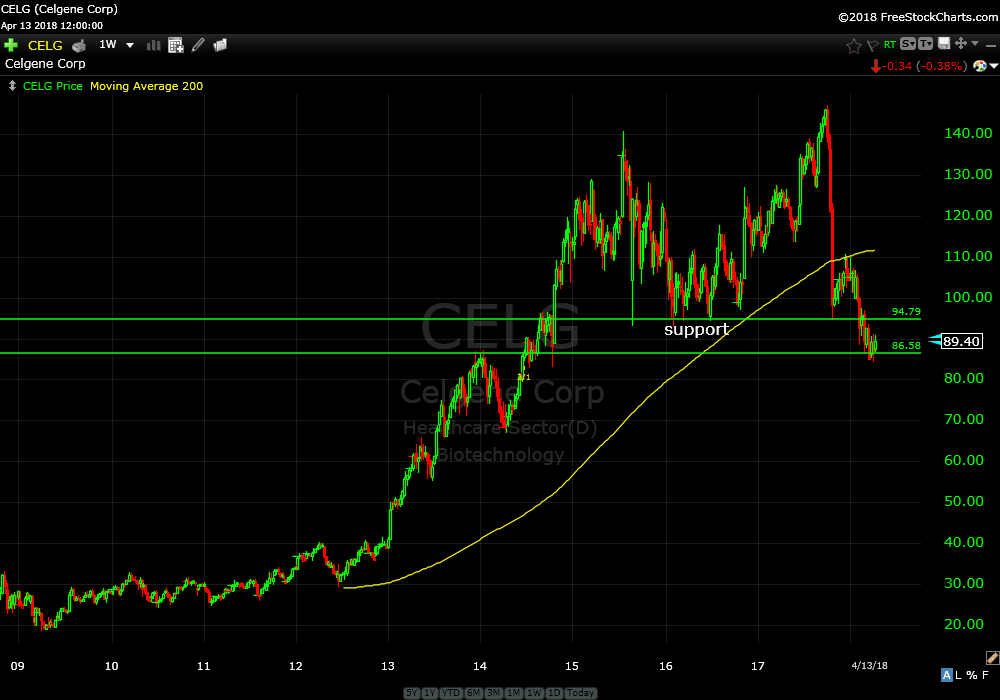
After correcting about 40% over the past six months price has settled on support. This one needs more time to marinate but is starting to look good as well.
SPDR S&P Biotech ETF (XBI) weekly

The weekly chart shows sloppy rising support. After breaching resistance, the high from 2015, price has come back into support. If resistance can get taken out a third time, it might be a charm. This one needs more confirmation.
iShares S&P Latin America 40 Index Fund ETF (ILF) monthly
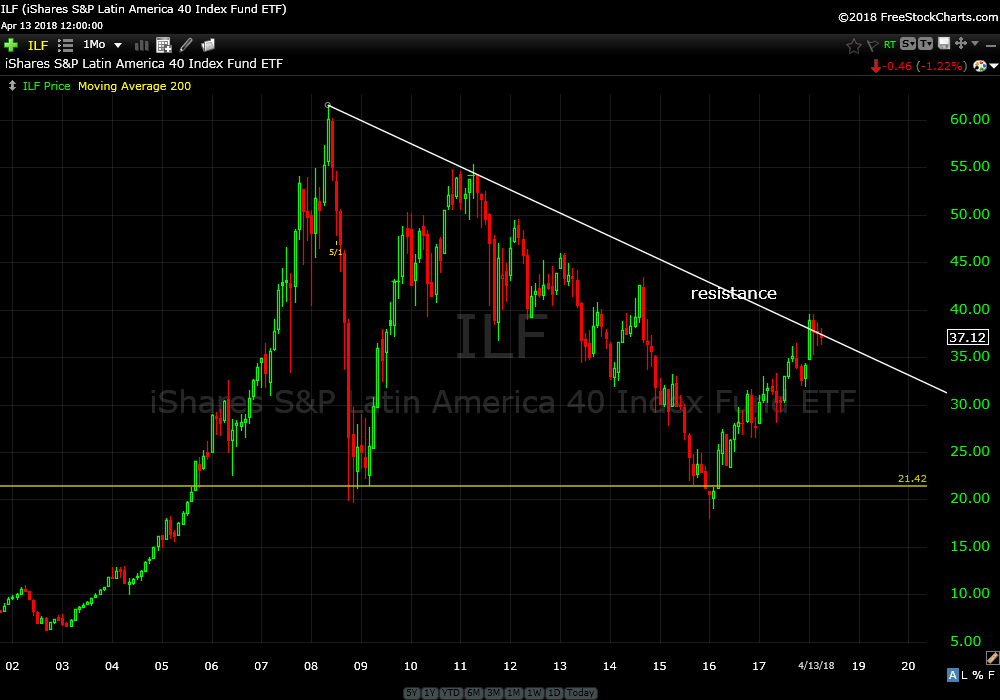
ILF appears to be setting up for a short sell opportunity. Price has been struggling to clear resistance for three months. I would like to see more selling confirmation before recommending this.
Overall price action seems to be normalizing with lower intraday ranges and fewer intraday large reversals. I’m seeing more opportunities setting up as well. Slow but sure the market will stabilize.
Continue to hold open recommendations and stay tuned for pending opportunities.
Trade Smart,
Don