I do. Price bounced 13% off support this week.
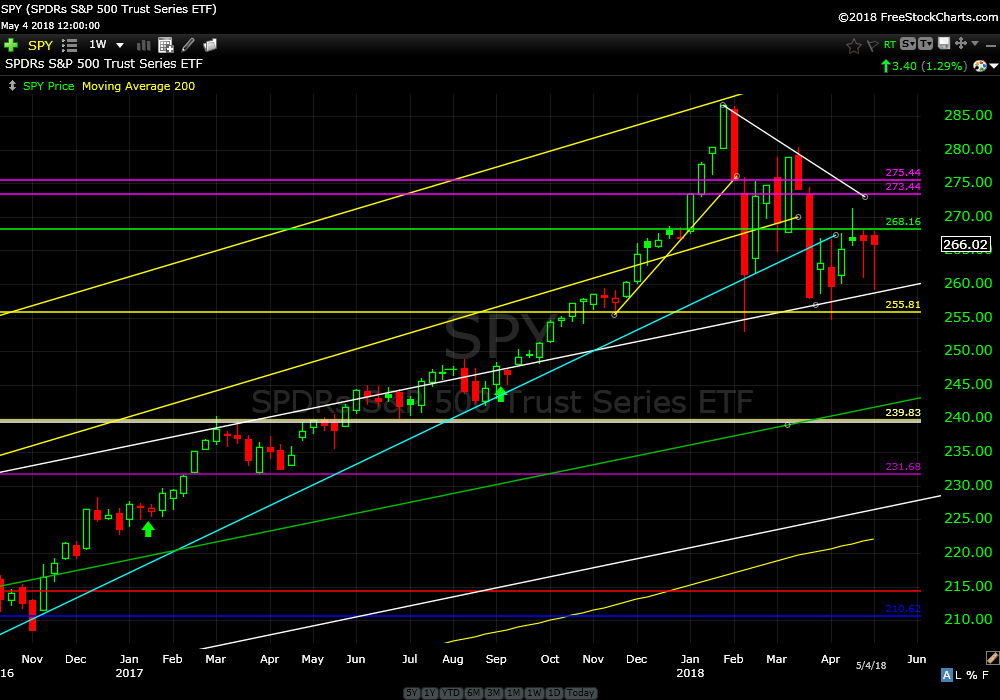
Price action in the S&P 500 index last week was a repeat of the prior week; big range, testing lower and closing near the high of the weeks range. This is bullish, however, price can’t seem to bust back up through resistance at 268 SPY.
The weekly chart from late 2016 will give you a nice visual of the calm market of 2017 compared to the craziness so far this year. I still expect volatility to be present through Q2.
Continue to hold.
SPDR’s S&P 500 Trust Series ETF (SPY) weekly
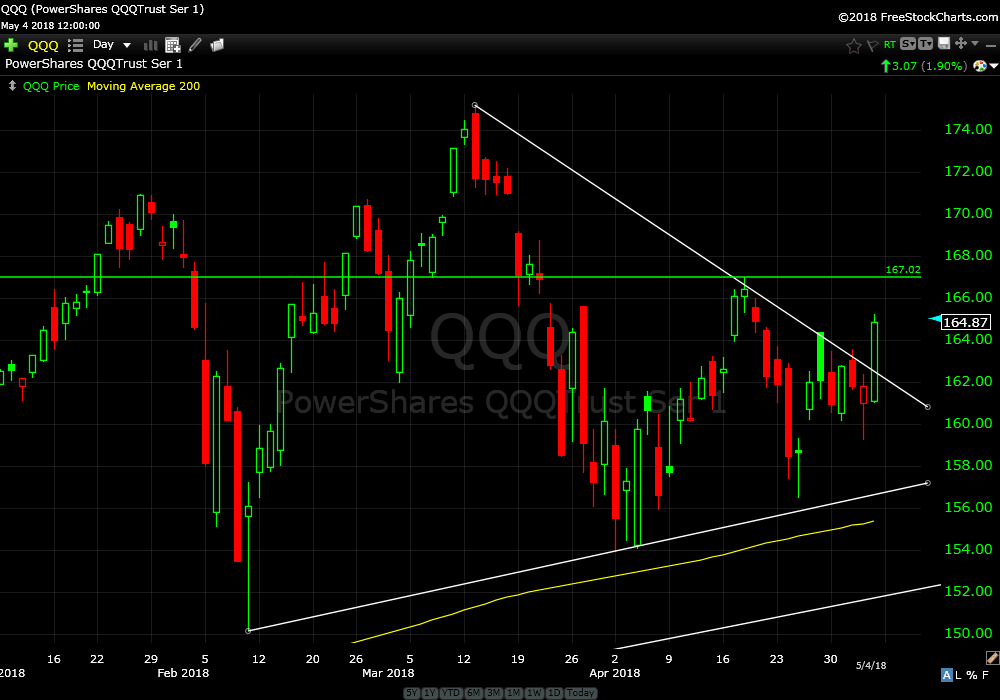
QQQ price action on Friday was short term bullish closing up and through weak resistance. The next level to get through is 167.
Continue to hold.
PowerShares QQQTrust Ser 1 (QQQ) daily
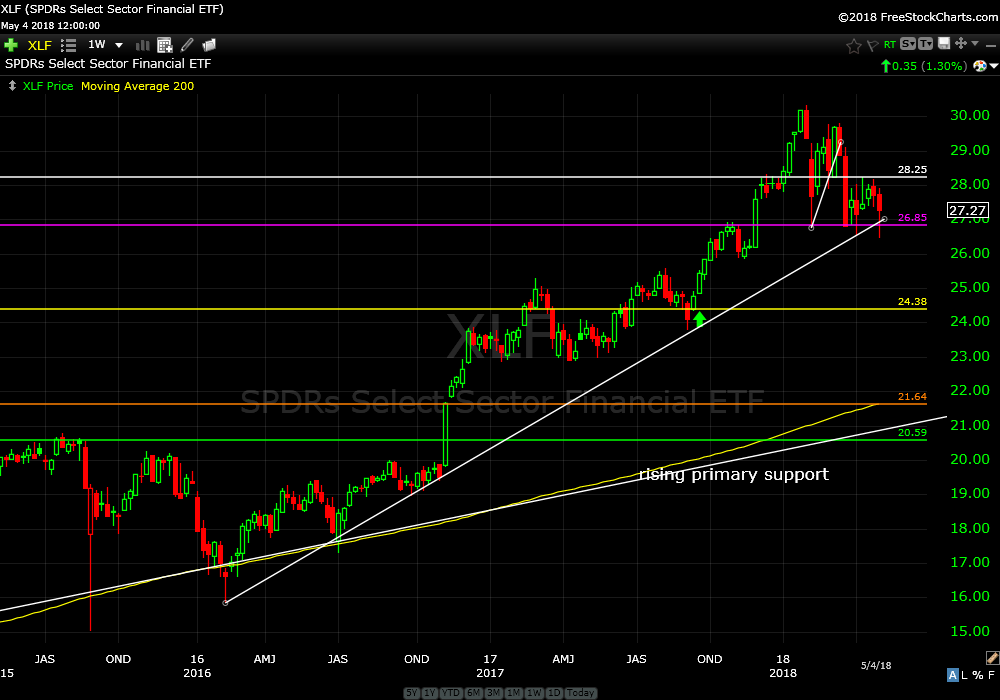
Financials had a down week but like the broader market closed at the higher end of the weekly range. Price tested the air below support and reversed higher. This might be another good entry soon if price can get green next week (confirmation).
Select Sector Financials ETF (XLF) weekly
Continue to hold.
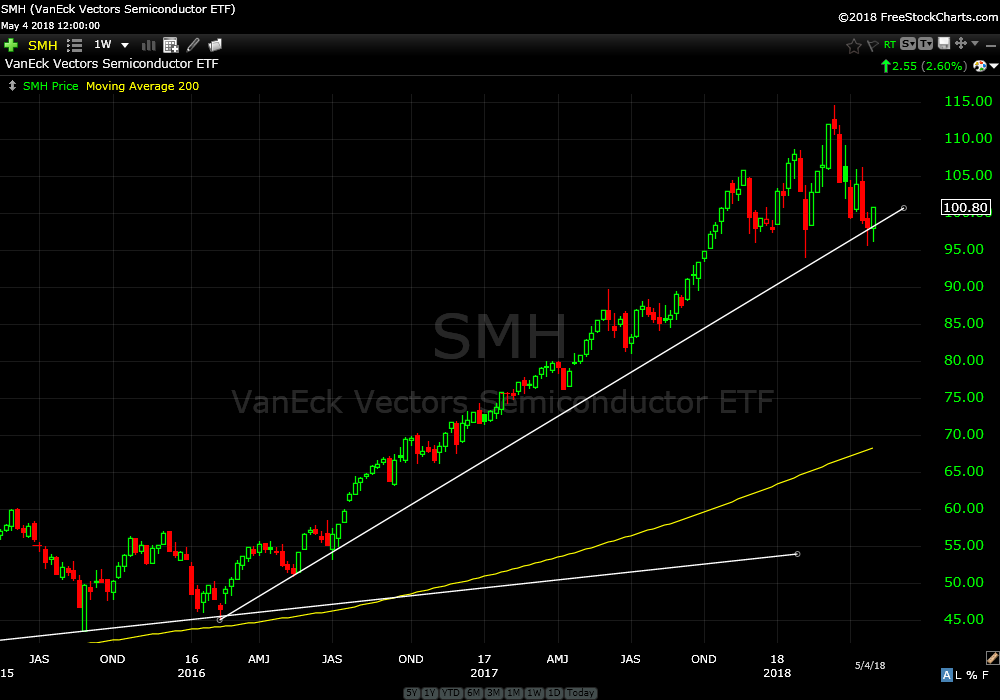
Semiconductors have been on my short list. SMH has corrected down into support and got a nice bid last week. I’m putting this on the buy list.
VanEck Vectors Semiconductor ETF (SMH) weekly
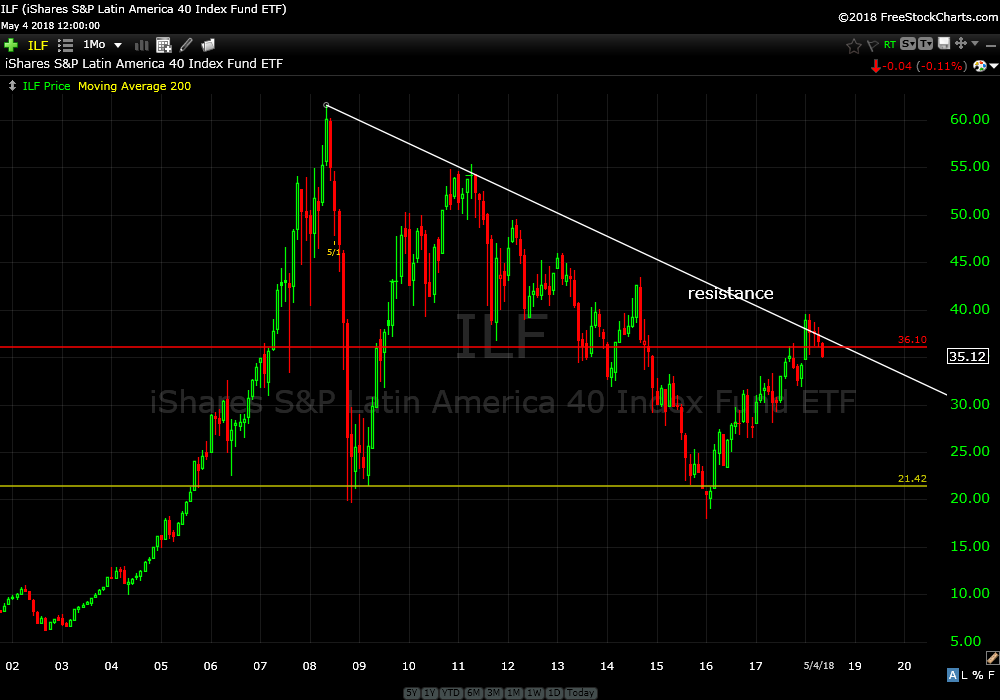
The monthly chart for ILF shows price has failed at resistance. This ETF that is composed of 40 of Latin Americas largest companies looks like it is going lower. $30 is the first target for a short sell. I don’t recommend short selling if you don’t understand the risks.
Latin America Index Fund ETF (ILF) monthly
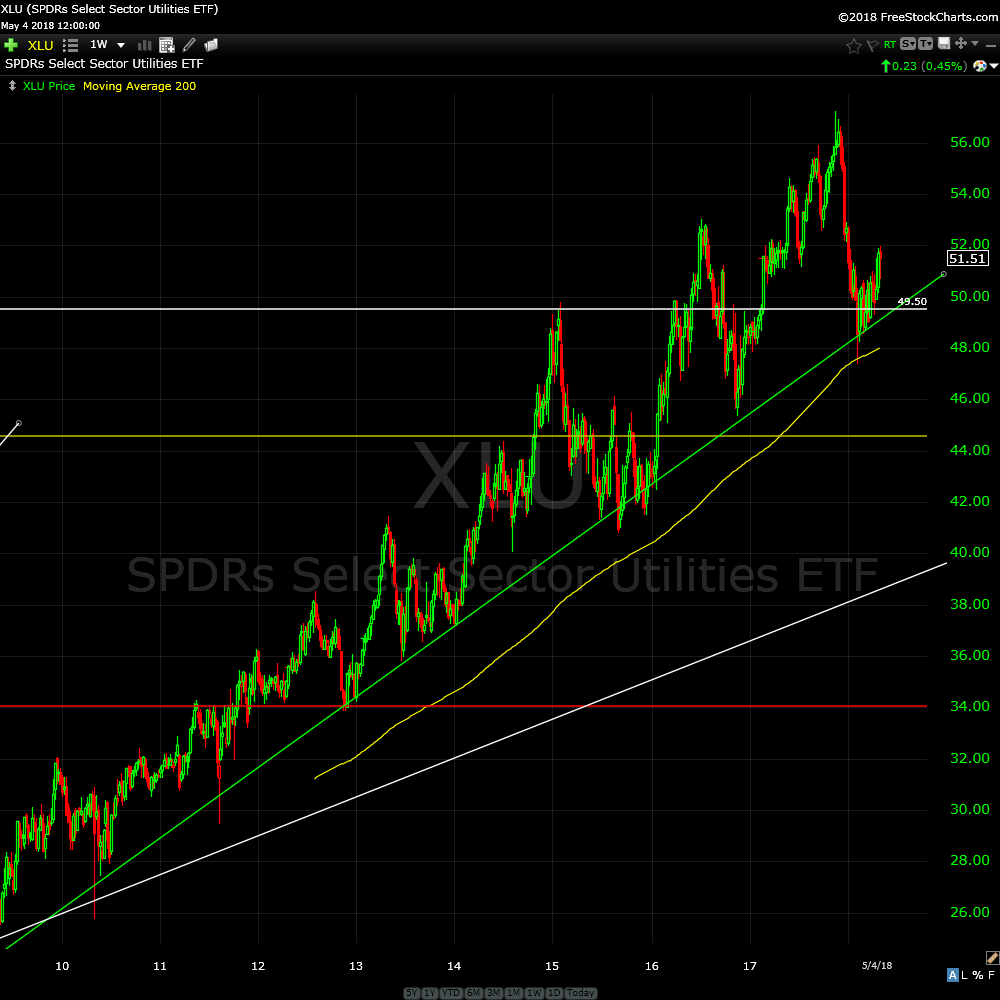
Price action for XLU, the Utility Sector ETF, is bullish. After correcting down into support it just keeps grinding higher. This is going on the buy recommendation list. With a yield of 3.41% and bullish price action I am a buyer on Monday.
Utility Sector ETF (XLU) weekly
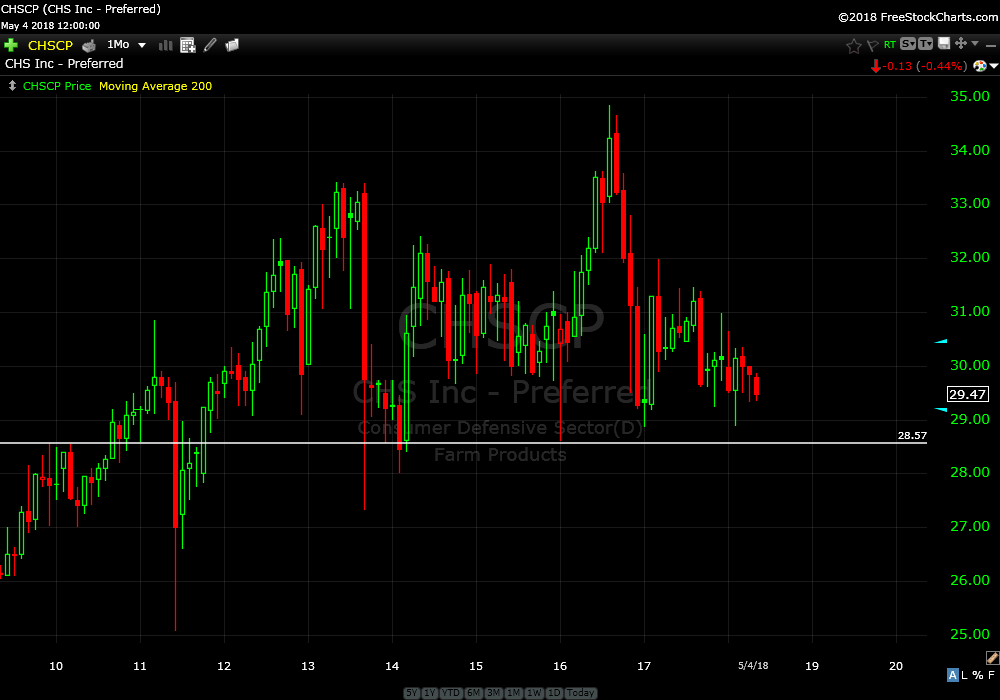
Speaking of yield, check out the monthly chart of CHSCP, the preferred shares of CHS Inc, an agricultural cooperative. With a current yield of 6.74% and relatively steady price action consider this for some of your “sideline” cash. Expect income…not capital gain.
CHS Inc-Preferred (CHSCP) monthly
Apple (AAPL) closed the week with an all time high closing of $183.83. We have so many Apple devices I’ve lost track. We first owned an Apple computer in 1986. I wish I bought the stock then instead.
Apple Inc. (AAPL) weekly
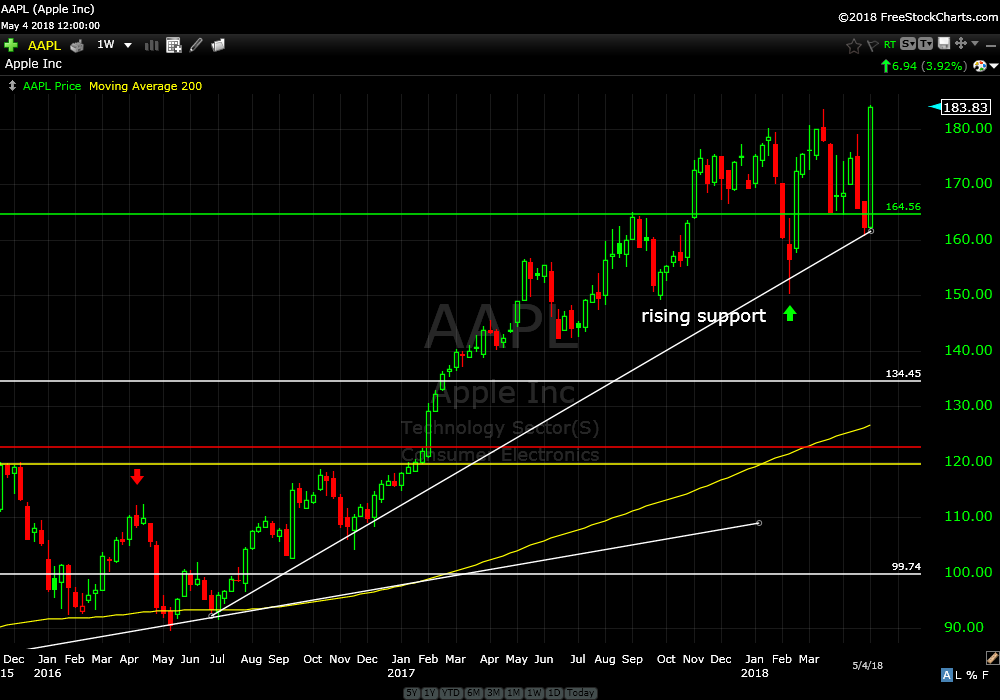
I did buy AAPL stock again on February 9th ,the day the Dow was down 1100 points. When the Dow was down around 500 AAPL was stalling above support so I bought some at 160. Then later that day the Dow tanked to down 1100 and AAPL went to 150. See green arrow on chart for buy.
I didn’t recommend it at the time as the market was so volatile and I didn’t think it was a good idea to recommend more risk. Also, I bought AAPL near support but without confirmation. I didn’t wait as I usually do for the support bounce.
When one enters a trade after confirmation price is going to be higher than support therefore more risk. When buying at support without confirmation there is less price risk but more directional risk.
So, looking back at the weekly chart of Apple (AAPL) you can see that was a bottoming week that tested support and then rallied. This price chart really shows the power of support. It will just never cease to amaze me how accurate correct support and resistance levels can be.
How do you like Apple now?
I have studied and traded virtually every technical indicator; Fibonacci, RSI, volume, MACD, etc and nothing is as accurate or consistent as good support and resistance levels. Keep it simple. something like Occam’s razor.
Continue to hold all open recommendations.
Have a great week.
Trade Smart,
Don