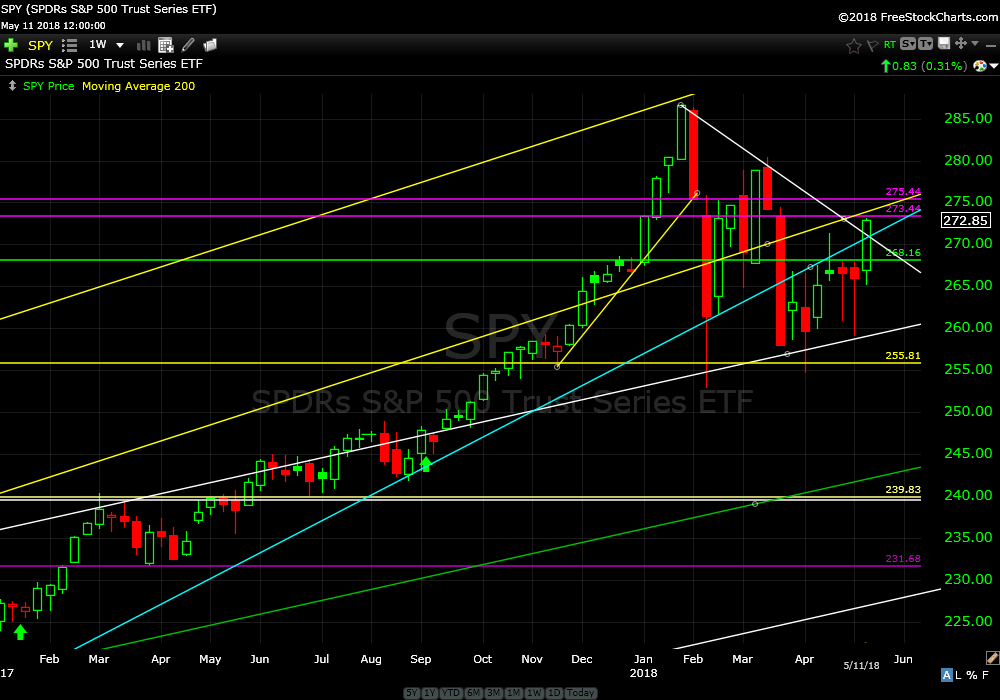
SPY, the ETF proxie for the S&P 500 index gained 2.5% last week as price broke up and through the 268 resistance level that has been a struggle to clear and close above for the past three weeks. This is good, positive price action.
Actually, the whole world was up this past week. Well, Mexico wasn’t.
Continue to hold positions in recommended country index ETF’s.
SPDR’s S&P 500 Trust Series ETF (SPY) weekly
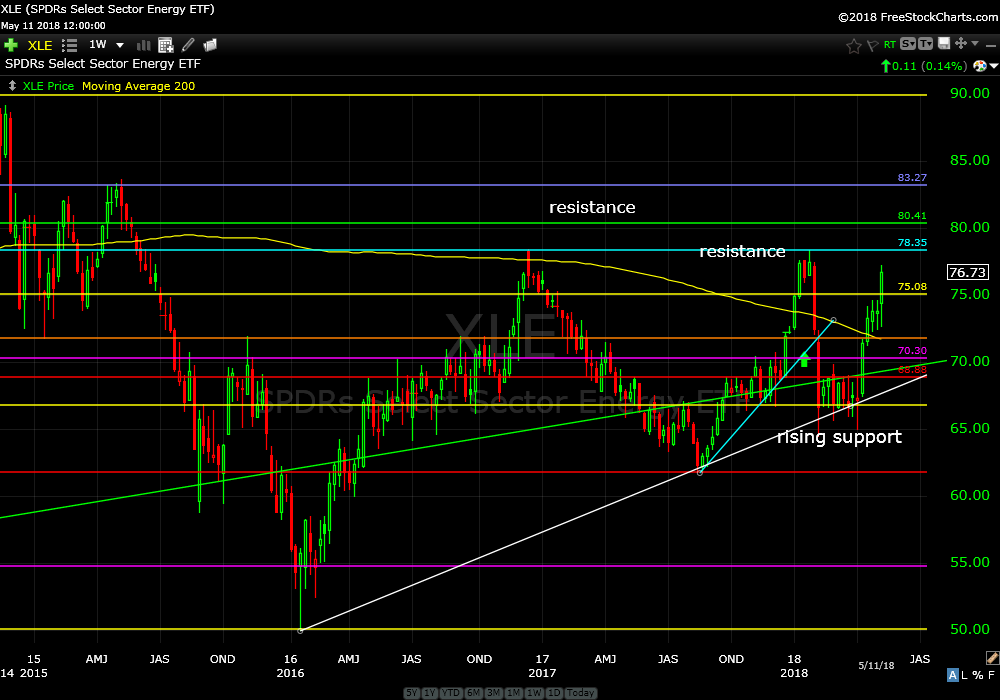
Energy continues to rip. XLE, the energy sector ETF, consolidated around support for 8 weeks after the February dump and has since been on a tear. Price is about to knock on multiple resistance levels represented by the blue, green and purple horizontal lines. These are all important levels.
The first level, 78.45, was rejected in late 2016 and again early this year. It’s rare to see a triple top so there is a good chance recent momentum can push up and through resistance soon. The next levels to watch are $80.50 and 83.50.
Look at the power of support on the weekly chart. During the 8 weeks of consolidation price never closed below support on a weekly basis. There was a lot of daily testing of lower prices but obviously a lot of institutions were accumulating positions during this time…then boom…the sellers were gone.
Continue to hold.
SPDR’s Select Sector Energy ETF (XLE) weekly
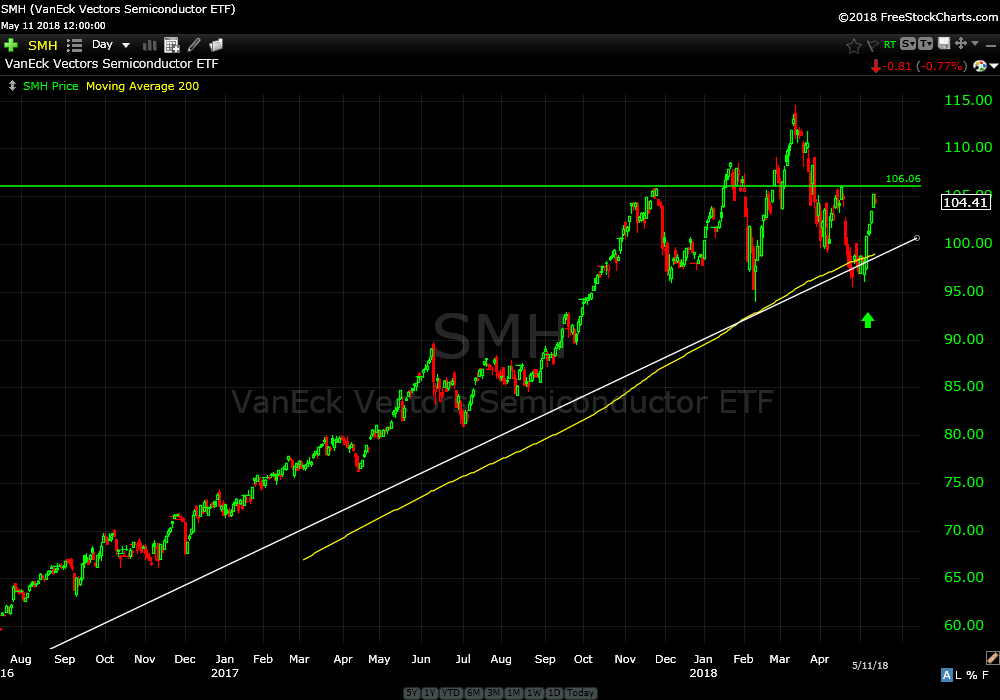
SMH, the semiconductor ETF I recommended last week popped nicely off support gaining about 4% on the week. It looks like price will be retesting the resistance zone again.
Continue to hold.
VanEck Vectors Semiconductor ETF (SMH) daily
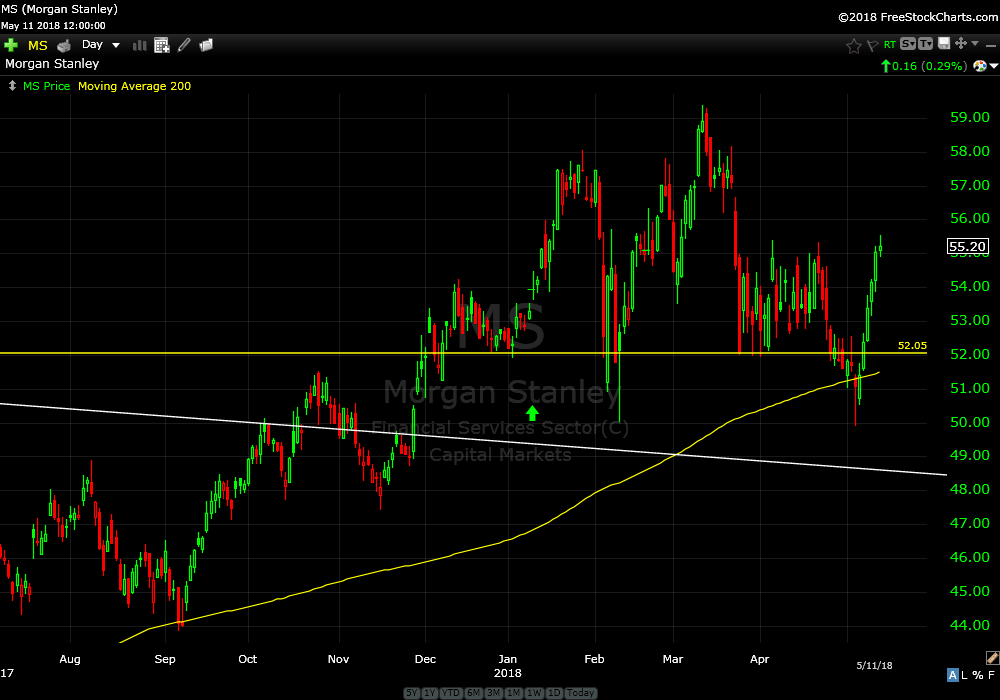
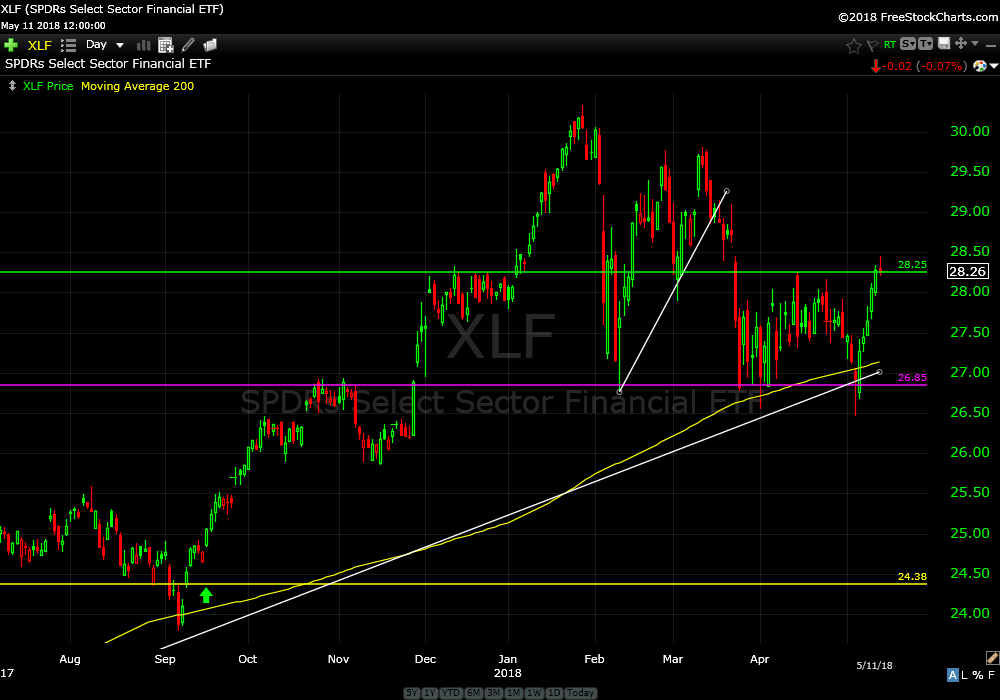
Morgan Stanley (MS) got a nice bid last week as well as XLF, the financial sector ETF. Looks like clear sailing ahead.
Continue to hold.
Morgan Stanley (MS) daily
SPDR’s Select Sector Financial ETF (XLF) daily
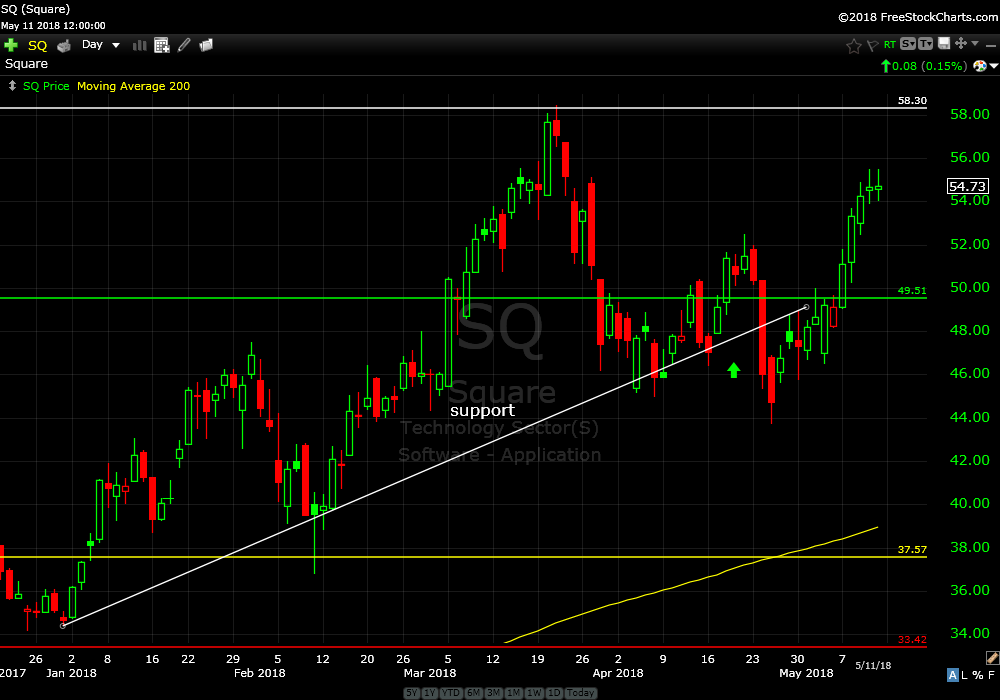
I recommended Square (SQ) a couple of weeks ago. After two days of bad behavior it has been zipping higher. Next hurdle is 58.00.
Continue to hold.
Square (SQ) daily
That’s enough charts for one reading. All open positions look good. Continue to hold.
Recent price action in the Dow and S&P 500 have been really good. Six green (up) days in a row breaking multiple resistance levels is impressive. Are we out of the woods yet? One never really knows but I’m very encouraged.
Price has been expensive for a solid six months trading above the bull channel from the bottom in 2009. Price is about 10% above my “fair value”. This doesn’t mean price will correct 10%. As fair value is rising in a bull market time can always catch up with price. Or, some combination of the two.
Have a great week!
Trade Smart,
Don