Last week made five weeks in a row of higher weekly closes for the S&P 500 index with little selling in sight. We went through resistance like a sharp knife through soft butter. I expected much more selling pressure through resistance. Maybe the sellers are planning on defending the all time high instead. One thing is for sure; buying pressure is exceeding selling pressure.
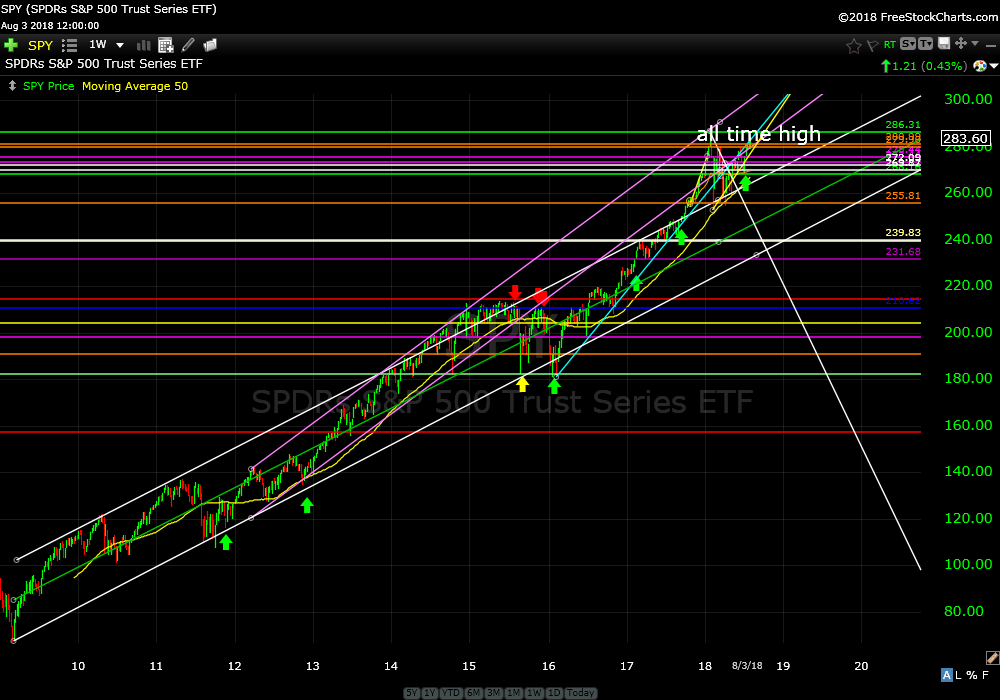
The only problem is that price is 13% above fair value even considering the February dump. Fair value is a rising price point along the upwards sloping green line which represents the middle of the rising channel formed by the two horizontal white lines originating at the market bottom in 2009. We can get back to fair value through price or time. Or, we can stay above fair value for a long time; SPY has been above fair value since November 2016.
That is really the only negative surrounding the S&P 500 Index. Bonds are still trading above critical melt down. Market leadership is normal with typical sector rotation. And, it makes total sense that technology is driving the index again…that first go around in the late 1990’s didn’t end too well. They say this time is different. By the way, who are “they”?
“They” say coffee is bad for you then a few years later “they” say coffee is good for you. Same thing with red wine, same thing with buy and hold same thing with everything. Who and where are these experts? “They” must be somewhere as “they” are always prognosticating something about something. I would just like to meet one of them one day. Sorry, got sidetracked.
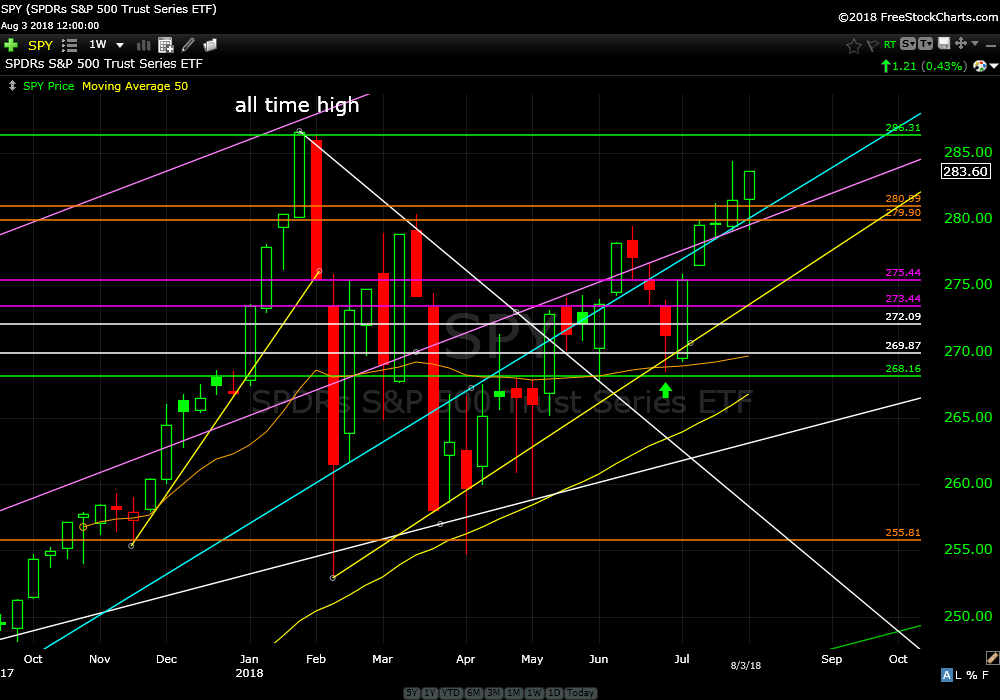
Check out the weekly SPY charts. One shows from the bottom in 2009 and the other is from late last year.
SPDR’s S&P 500 Trust Series ETF (SPY) weekly
SPDR’s S&P 500 Trust Series ETF (SPY) weekly
Buy recommendations:
Please note: The S&P 500 index is 1.039849% from it’s all time high. If there are any sellers left this is where they will be. If they have left the room we should see new SPY highs soon but if they are hiding at 286.63 SPY St. they will try and take her down at the all time high or just beyond. So, please be aware of your risk in making any new trades.
Again, I am recommending 1/5 position size on each of the following buy alerts.
Buckle up buttercup.
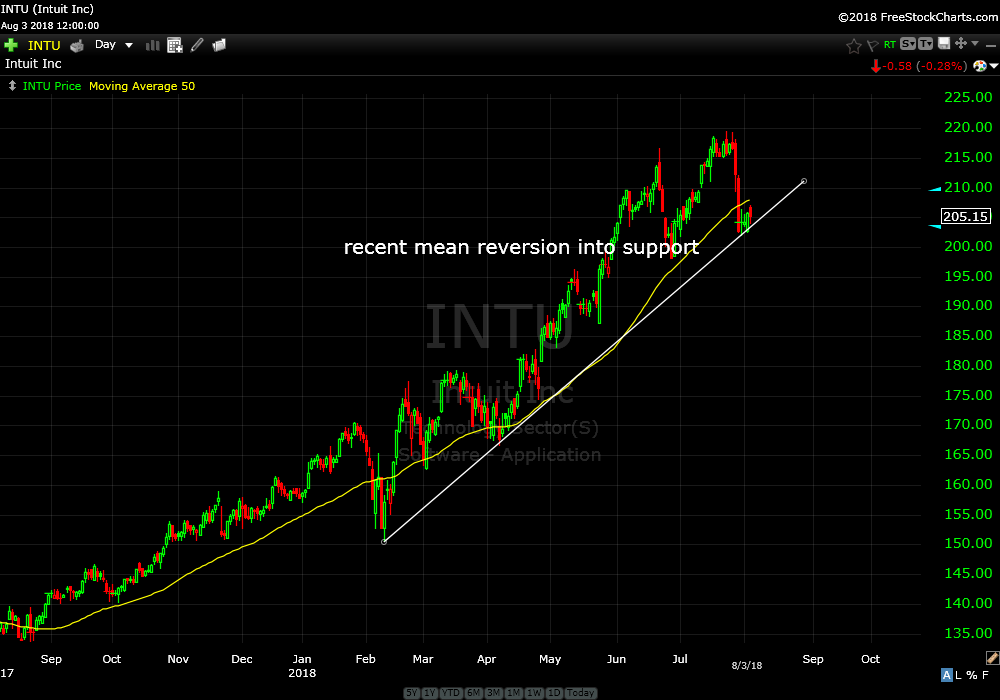
Intuit Inc (INTU) daily
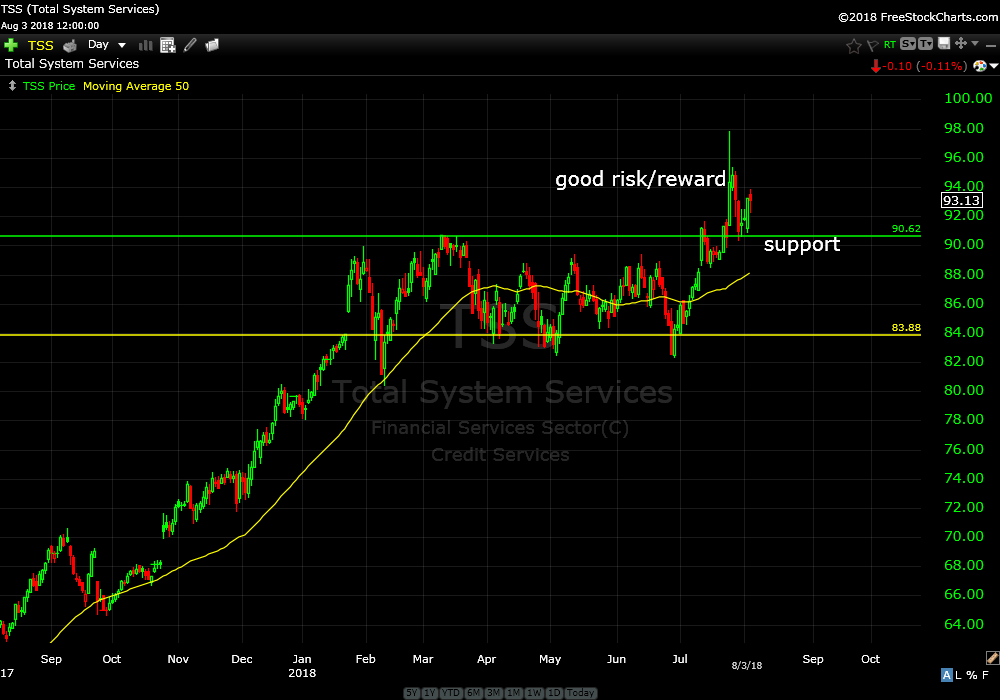
Total System Services (TSS) daily
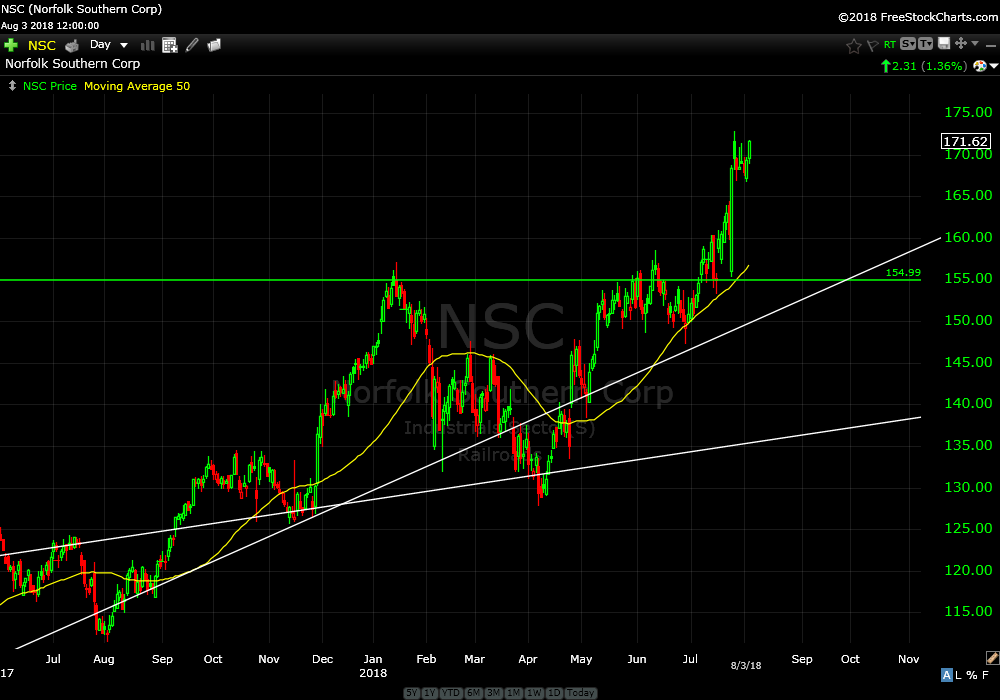
Norfolk Southern Corp (NSC) daily
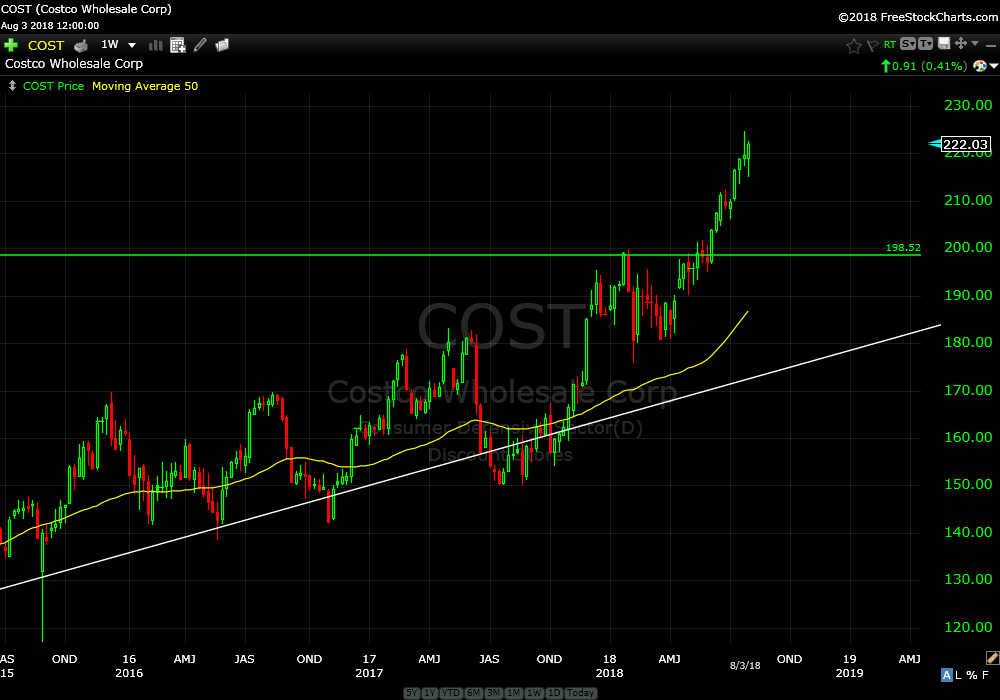
Costco Wholesale Corp (COST) daily
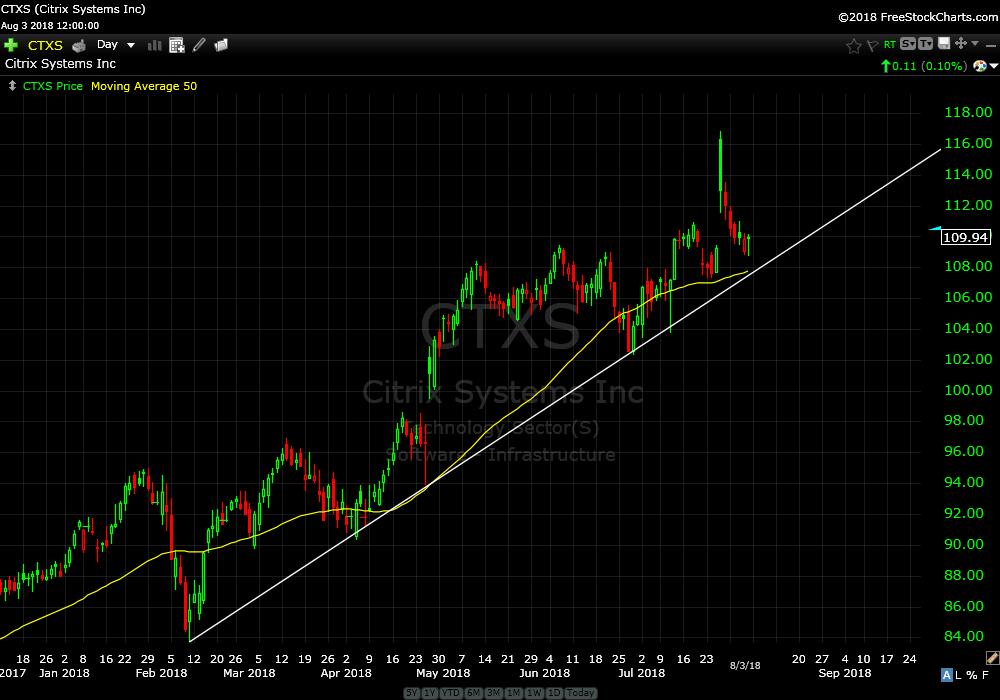
Citrix Systems Inc (CTXS) daily
Have a super week and if you have any questions just shoot me an email.
Trade Smart,
Don