We saw a little selling last week on Friday after trying to get up near the all time high from earlier this year. It was a “gap down” day with the open, close and daily range all below Thursdays range. See daily chart of SPY.
SPDR’s S&P 500 Trust Series ETF (SPY) daily
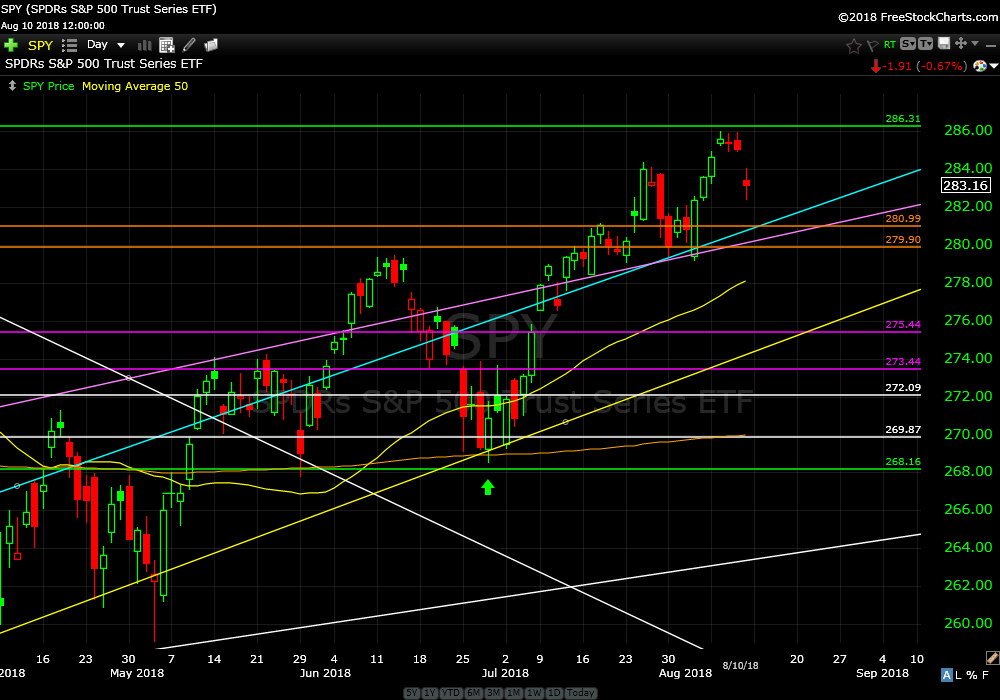
Gap down days tend to produce more selling and that’s what we will probably get. It’s probably healthy for the market to come back a bit after the recent run up from late June. I continue to look at these pullbacks as opportunities.
Trust me, I have no idea what the market will do on Monday but if I were a betting man I would say it will open up and try and get to 285 then sell off mid morning (Pacific time) to down near 281.
Whatever it does on Monday as of right now (Saturday night overlooking the Pacific in Carlsbad) the weekly and monthly structure of the market, price action, breadth, volume, rotation and momentum are all good.
SPDR’s S&P 500 Trust Series ETF (SPY) weekly
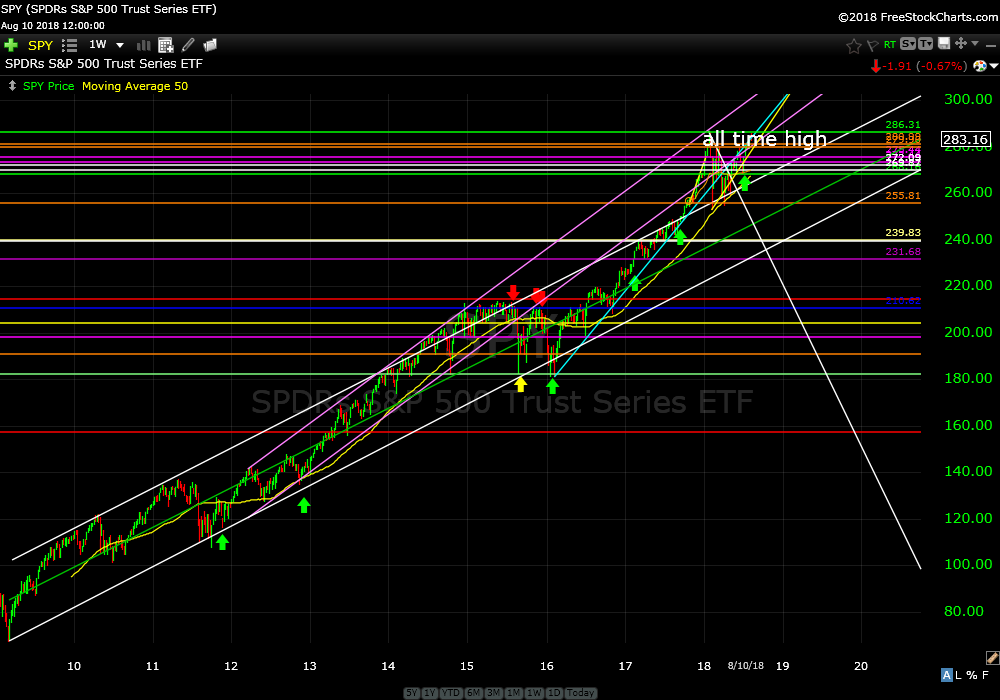
No sell signals.
I do have a bunch of opportunistic charts but some weeks are just better left to let the market come back a bit. If it goes up so be it. If it goes down we get better prices.
Trade smart my friends and have a wonderful week.
Don