I wish people who are in the business of providing buy and sell signals would publish their performance history. How hard is that and why don’t they do it?
Mutual funds and hedge funds are not transparent either in their trading but at least you know how they performed…I hate mutual funds and I’m not really fond of most hedge funds…poor performance and high fees are not a good combination.
I’m referring to all the others out there who are rating stocks or recommending stocks to buy. I want to know their performance history. Then, when I find out who is really good over time I want to find out how he/she is doing it. I want to know the correlations they use.
So far, that’s why I continue to do my own thing. I can’t find anyone with better results. I’m not sure if that’s because no one publishes their results or I just can’t find them. I know they are out there…aren’t they?
Somebody knows somebody…right?
Remember, my technical methodology is designed to participate in most of the uptrend in bull markets and avoid most of the downtrend in bear markets.
My Performance
Performance history is from when I began publishing real time buy and sell recommendations in 2011. Includes all open and closed trades. As of August 31, 2018 after market close.
Number of trades: 133
Win%: 63%
Payoff ratio: 2.66
Average win: 29.66%
Average loss: 13.37%
If you were flipping coins for $1 per flip for 24 hours you would accumulate $72,000 with these performance metrics. These are really good numbers. The guy who designed my spreadsheet said he has never seen results as good as mine.
That’s all fine and dandy but I want to know how I really stand up. Shouldn’t everyone in the business of publishing stock ratings or buy/sell signals be required to make their performance history public? I think so.
It really pisses me off that this kind of information is so hard to find…or it’s just not available…?
Let’s review all of my open recommendations.
SPDR’s S&P 500 Trust Series ETF (SPY) weekly

SPY is up 140% from my recommendation on November 29, 2011. It’s also up 15% and 6.5% from 2017 and 2018 additional recommendations.
We had a little selling last week but nothing too serious. Price has filled a previous gap and come back down towards the recently cleared January high. Looks normal too me.
By the way, It just kills me how the media reacts to the market. One day the market is up 1% and everyone wants to talk about how great everything is and the very next day the market is down 1% and all you hear is how lousy everything is. If I didn’t know any better I would go crazy trying to figure out what to do listening to all the noise. This is why I put on headphones, listen to music and look at a chart. It’s so much easier…and so much more profitable.
Sorry, side rant.
Continue to hold.
Invesco QQQ Trust Ser 1 (QQQ) weekly

QQQ is up 162% from my recommendation. What’s not to like?
Continue to hold.
SPDR’s Select Sector Technology ETF (XLK) weekly

XLK is up 139% from one of my recommendations and up 71% on the other. Nothing out of the ordinary going on here.
Continue to hold.
Global X Social Media Index ETF (SOCL) weekly

SOCL is up 35% from my recommendation. I really hate selling this one but it has violated trend line support and there is not much visible nearby support. It is likely to go lower. I am recommending selling. Ka-Ching.
Sell.
Facebook Inc (FB) weekly

FB is up 27% from my recommendation. Recent price action has not been good. The good news is that after breaking shorter term support levels price is fast approaching primary support. This is where the buyers live.
Continue to hold and be ready to add.
SPDR’s Select Sector Health Care ETF (XLV) weekly

XLV is up 17% from my recommendation. It just made another new all time high. Looks good to me.
Continue to hold.
SPDR’s Select Sector Energy ETF (XLE) weekly

XLE is down 3% from my recommendation. It has been having a difficult time clearing resistance at $78. Although it has been moving sideways for a few months the lows keep getting higher although the highs remain stalled. This type of price action usually results in a breakout to the upside. As long as support holds I’m long.
Continue to hold.
KBR Inc (KBR) weekly

KBR is down 6% from my recommendation. Price action is similar to XLE. As long as it doesn’t violate rising support from earlier this year I’m bullish.
Continue to hold.
Square (SQ) weekly

SQ is up 76% from my recommendation. Lots of green going on here.
Continue to hold.
VanEck Vectors Semiconductor ETF (SMH) weekly

SMH is up 4% from my recommendation. SMH struggles to clear all times highs as it absorbs supply from 2001. Price has been compressing for the past six months which usually leads to large breakouts. This one could go either way but until rising support is violated I would recommend holding.
Continue to hold.
SPDR’s Select Sector Utilities ETF (XLU) weekly

XLU is up 5% from my recommendation. Price action is good; year over year higher highs and higher lows with good structural rising support.
Continue to hold.
iShares MSCI Mexico Index Fund ETF (EWW) weekly

EWW is up 7% from my recommendation. Price consistently surges higher at rising primary support. It also consistently struggles to clear $52. This is another one that has many years of sideways accumulation. As long as rising support holds this one has a good chance to run up to $65.
Continue to hold.
IDEXX Laboratories Inc (IDXX) daily

IDXX is about even from my recommendation. It sold off a bit last week but week over week price action continues to be strong.
Continue to hold.
Fidelity National Information Services Inc (FIS) daily

FIS is also about even from my recommendation. As long as it remains above $102 short term I like it.
Continue to hold.
Verisk Analytics Inc (VRSK) daily

VRSK is up 8% from my recommendation. Ripping.
Continue to hold.
Motorola Solutions Inc (MSI) daily

MSI is up 2.5% from my recommendation. Price action looks healthy.
Continue to hold.
Citrix Systems Inc (CTXS) daily

CTXS is about even from my recommendation. Price broke and closed below rising support on Friday. This looks to me like “Ye old trend line fake break”. With good support (area bracketed by horizontal green lines) just below rising trend line support the break will eliminate some weak hands and potentially get a bid inside the bracket and resume its uptrend. that’s what it looks like to me.
Continue to hold.
Costco Wholesale Corp (COST) daily

COST is up 8% from my recommendation. Makes total sense to me. I love that place!
Continue to hold.
Norfolk Southern Corp (NSC) daily

NSC is up 2% from my recommendation. It’s chugging along nicely.
Continue to hold.
Total System Services (TSS) daily

TSS is up 5% from my recommendation.
Continue to hold.
Intuit Inc (INTU) daily
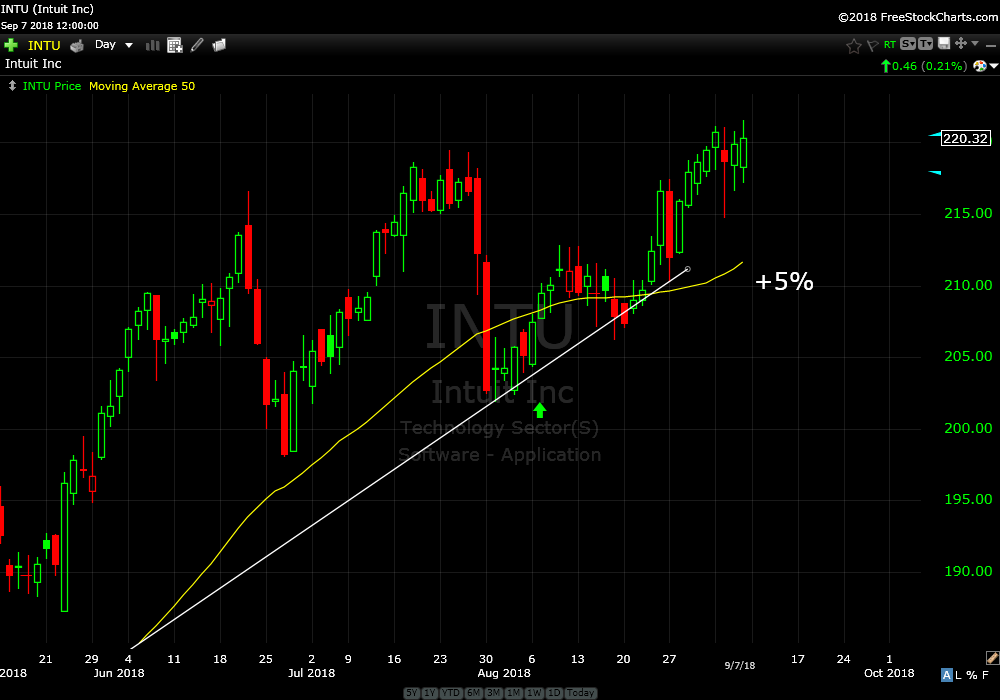
INTU is up +5% from my recommendation. Rising support continues to provide good entries.
Continue to hold.
United States Oil Fund LP (USO) daily

Price is about even from my recent recommendation. Rising support consistently catches a bid and then clears its previous high. Ride it while it continues.
Continue to hold
Check out this chart of the S&P 500 Index vs the pundits…hahahaha

That’s all for today. If you have any questions or specific charts you would like me to review, please feel free to email me here. Premium members receive this service at any time, but I will provide free one-time chart analysis for free members this week.
Trade smart,
Don