Smart Chart Investor

Beyond Buy and Hold: Using Technical Analysis to Reduce the Risk of Long-term Investing

  • Member Login

That Got Ugly Quickly

October 11, 2018 by Don Roth

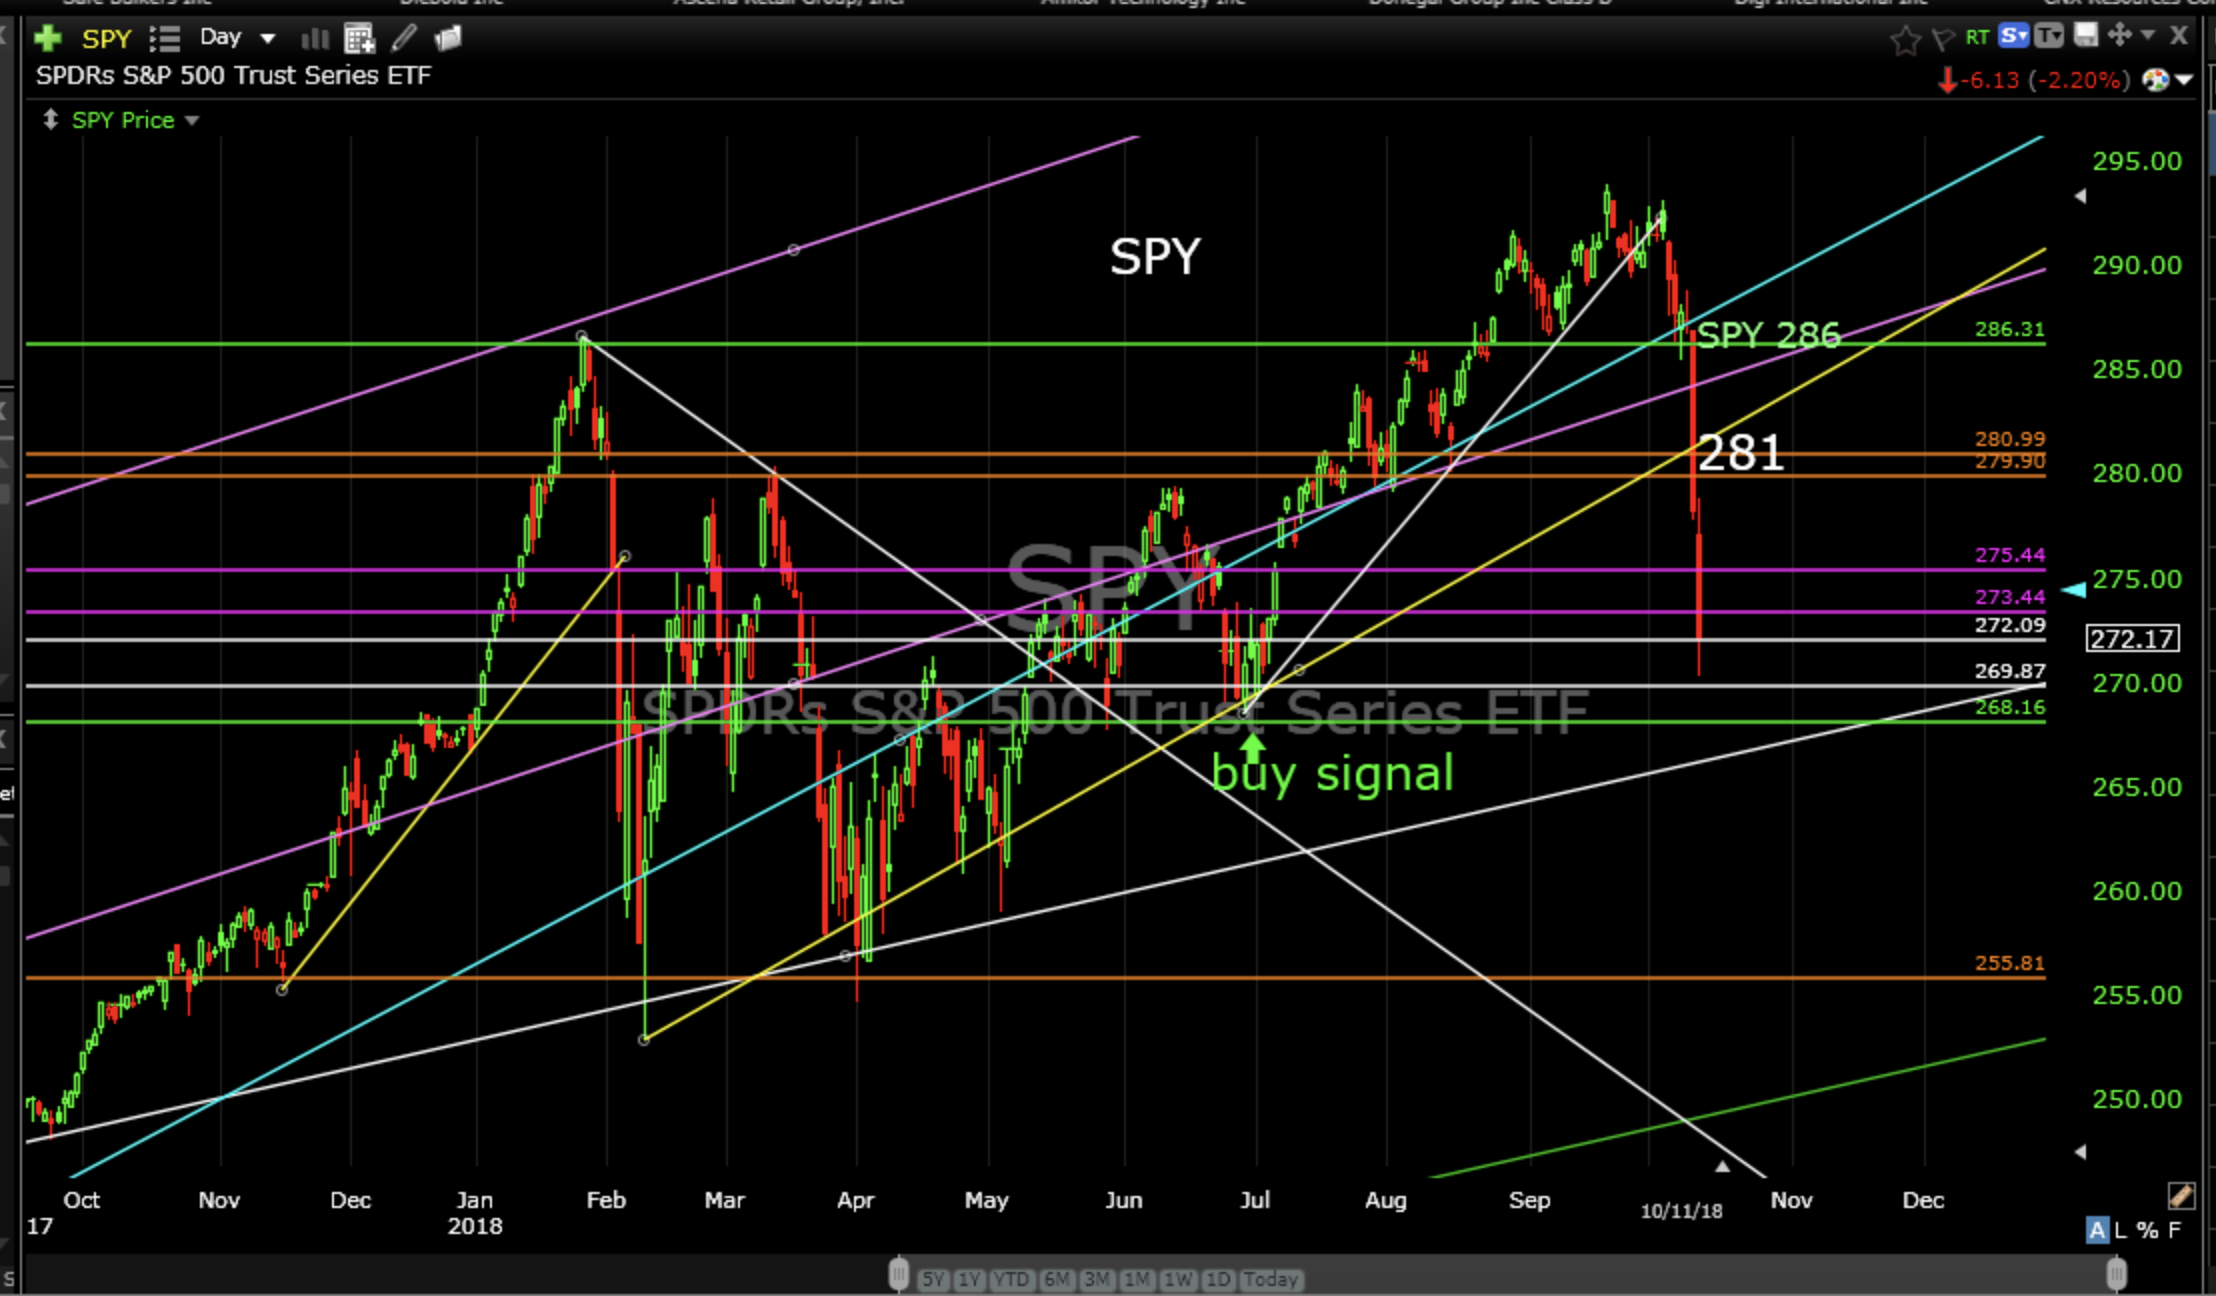
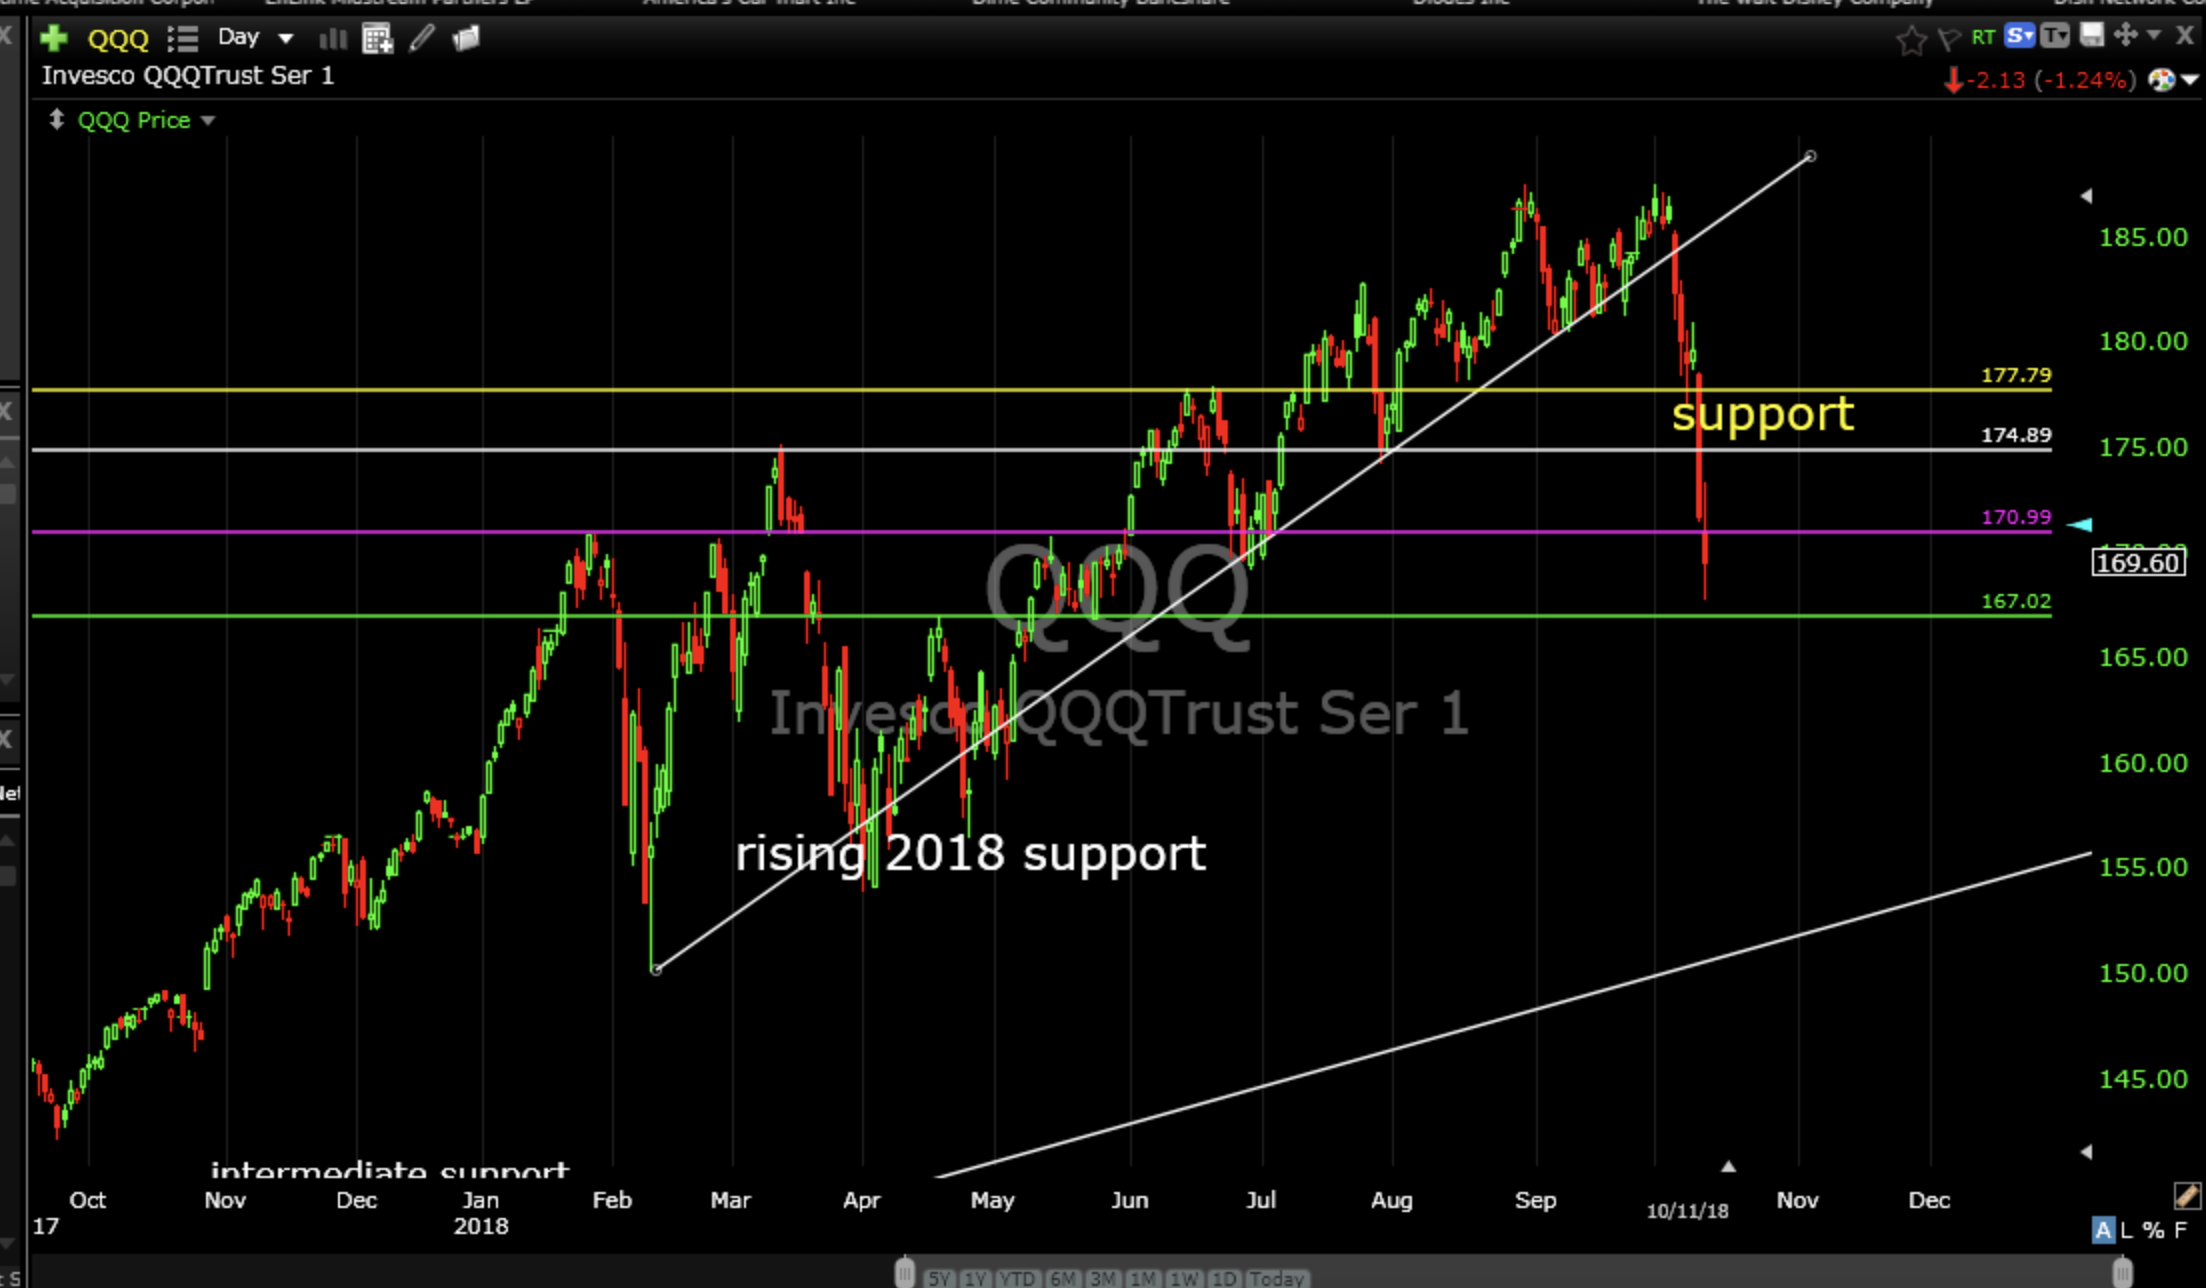
The technical term for what happened the last two days is “Holy Shit Batman”. It was certainly fast and furious. As bad as it was, SPY and Nasdaq are still up for the year and prices are just back to July.

S&P500 Index ETF (SPY) daily

(click chart to enlarge)

Invesco QQQ Trust (QQQ) daily

(click chart to enlarge)

So, do we buy the dip or sell the rip?

Probably a little bit of both.

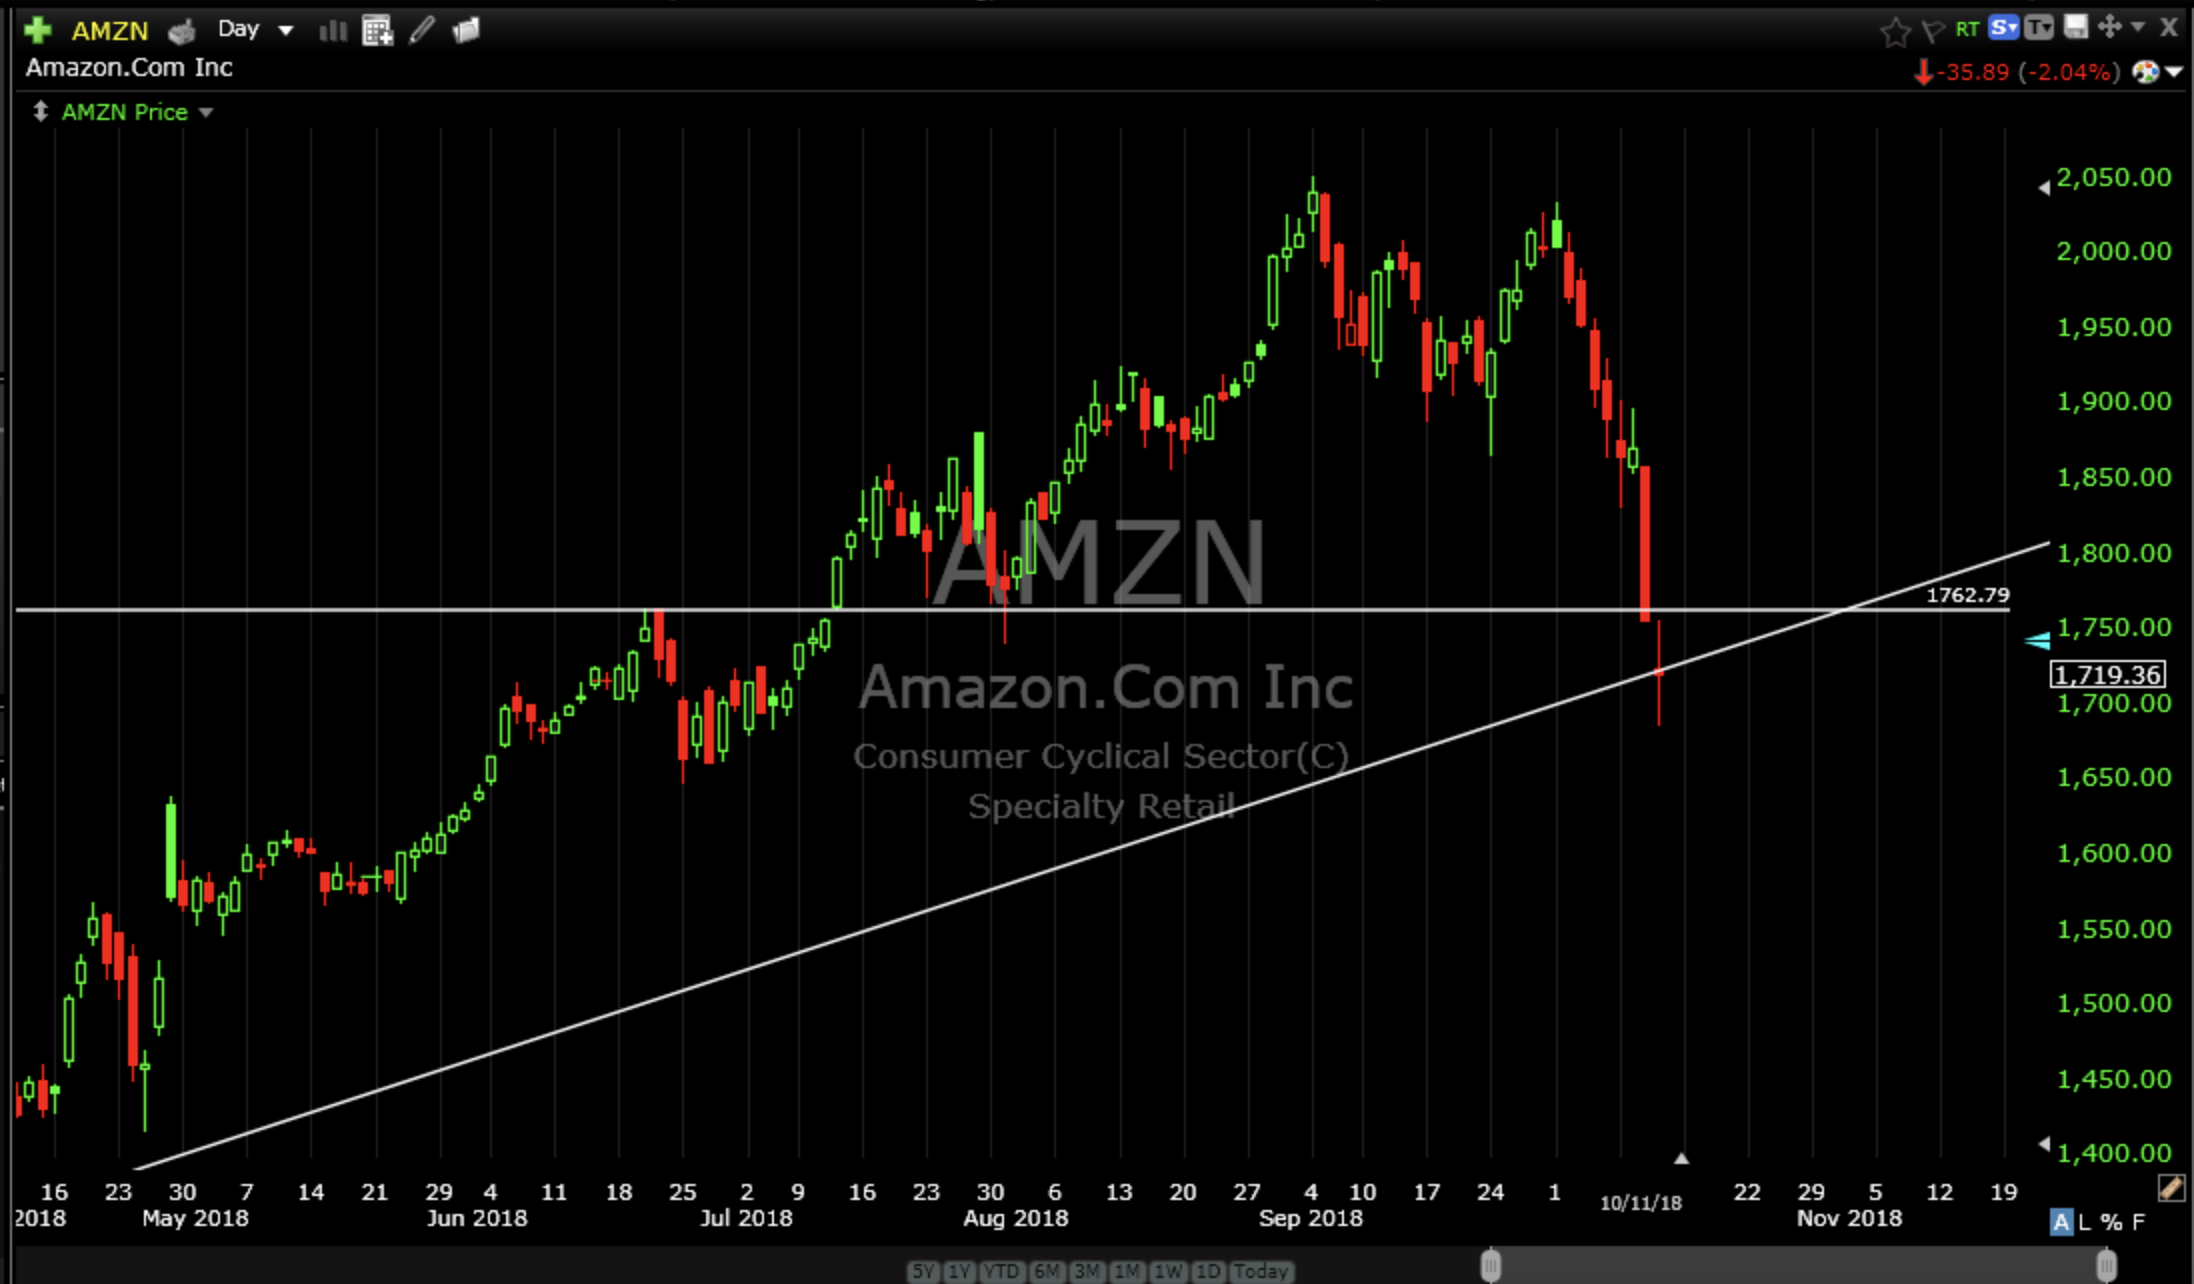
Amazon.Com Inc (AMZN) is looking interesting as well as Square (SQ).

Square (SQ) daily

(click chart to enlarge)

​​​​​​​
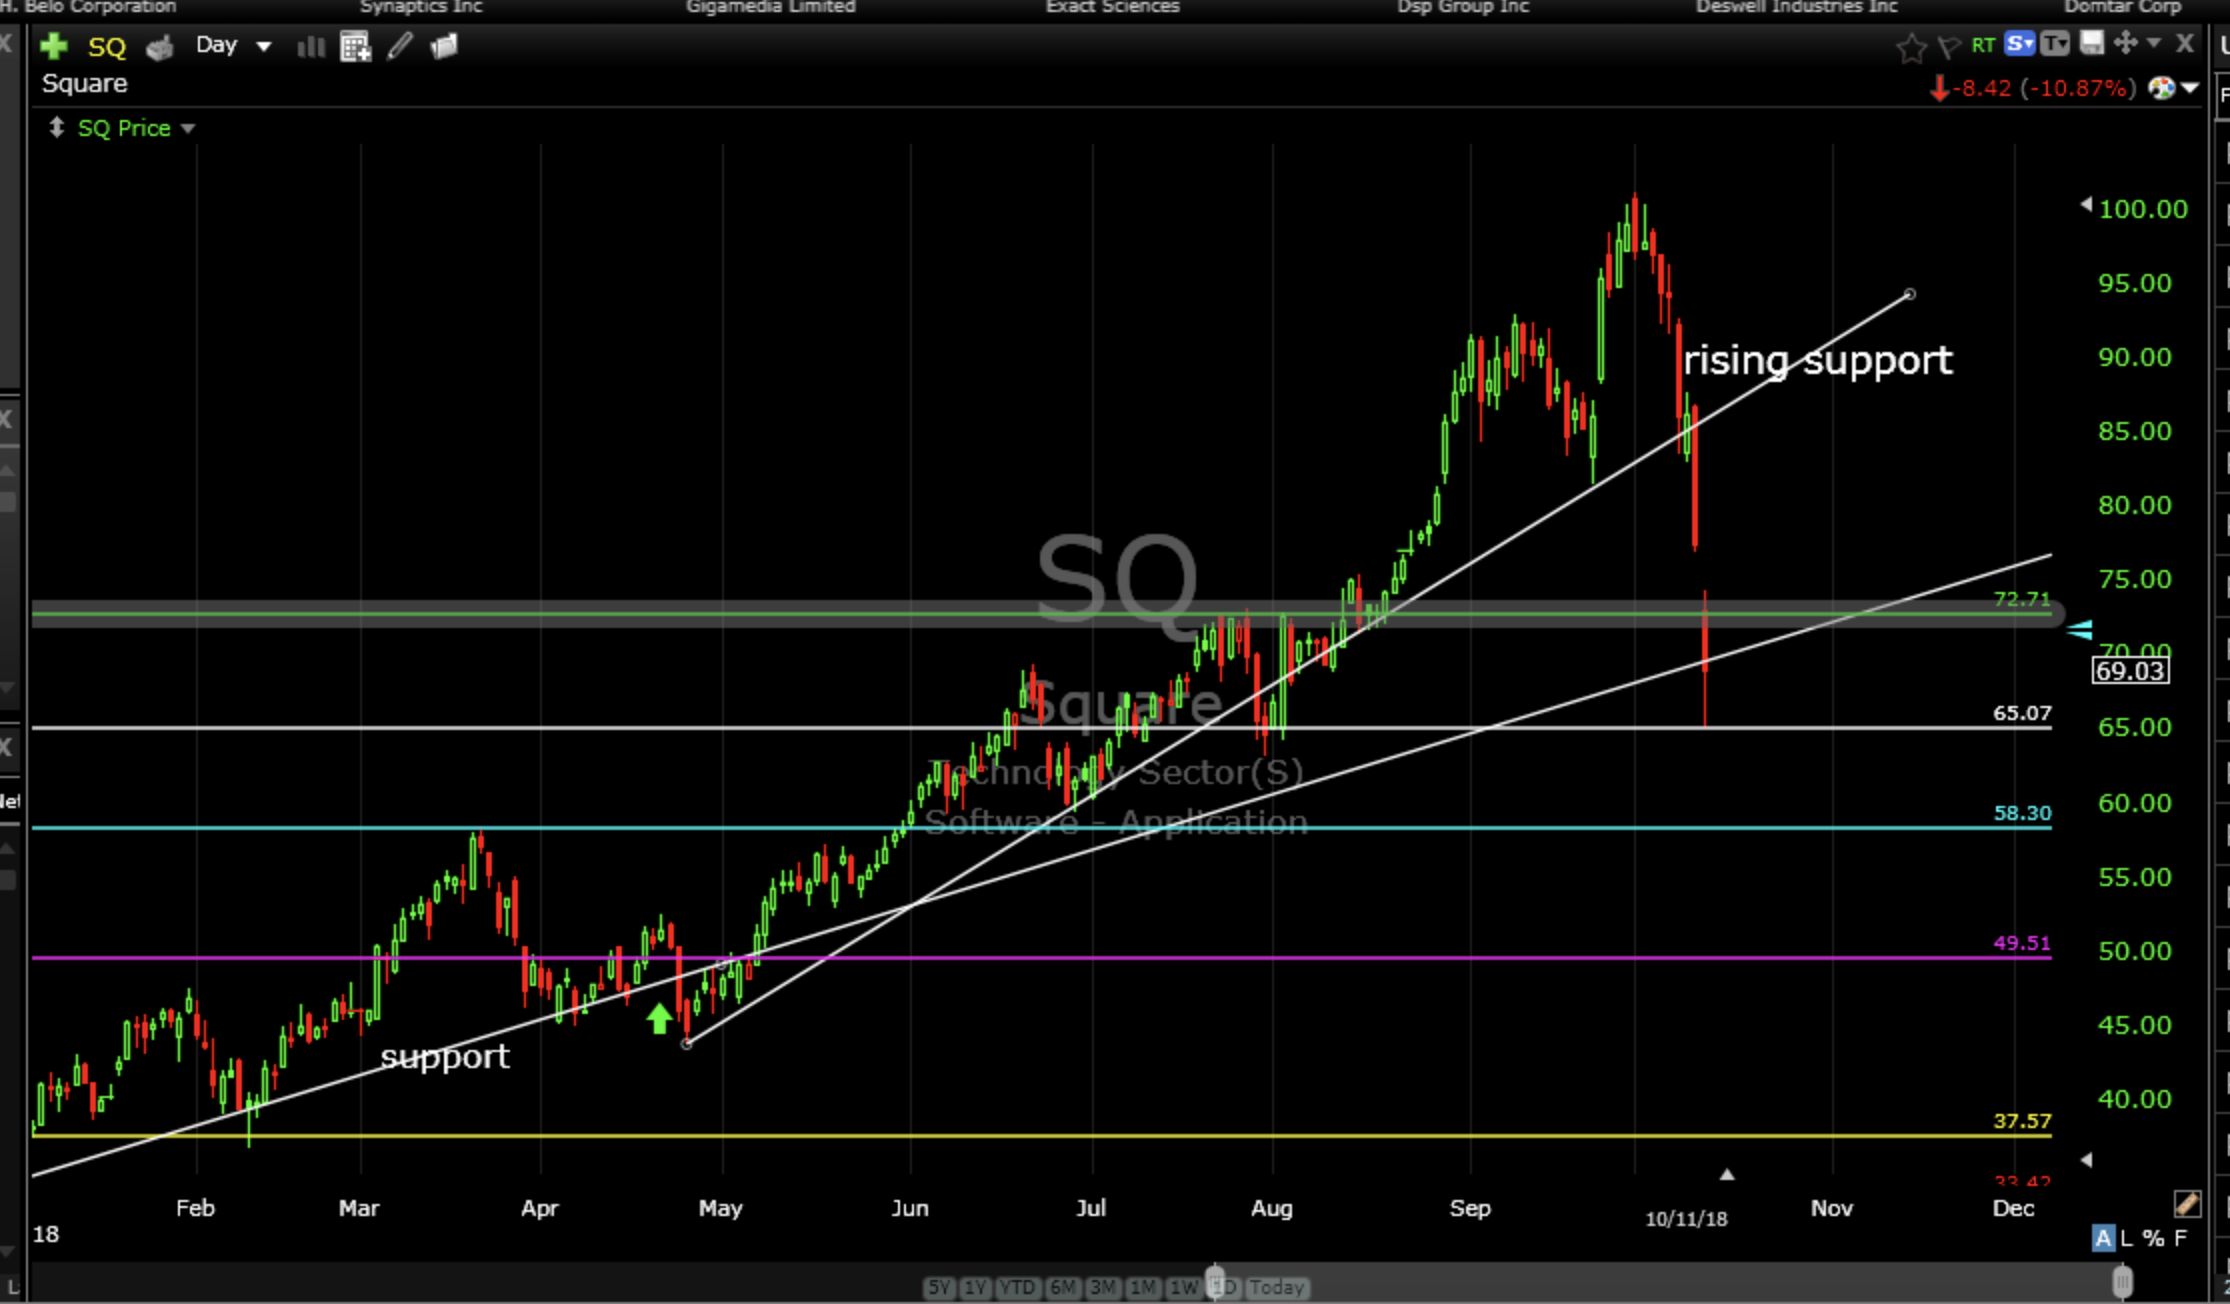
If they can hold support tomorrow they have a good chance of another leg up. I bought a little more SQ today just under $70.

Amazon.com Inc (AMZN) daily

(click chart to enlarge)

I would err on the side of waiting until the week is over before doing anything though. It is very likely that I will recommend some selling going into next week.

Trade Smart,

Don

RECENT MARKET UPDATES

  • Blow Off Top?
  • Major Announcement!
  • Trade Alert (BE)
  • Important Notice
  • Weekly Market Commentary and Pre Announcement
Go to Members Home

Don Roth

Don Roth, Smart Chart Investor

Recent Market Updates

  • Blow Off Top?
  • Major Announcement!
  • Trade Alert (BE)
  • Important Notice
  • Weekly Market Commentary and Pre Announcement

Copyright © 2011–2026 · Smart Chart Trading, Inc · Privacy Policy · Terms of Use · Disclosure Information · Log in