I remember the first time I drove down into Denver on I70 from the west. It felt like it took forever to get down. And, it’s steeeep. The warning signs are posted one after the other when you get down near Evergreen. “Truckers, You are not down yet”, ” Are your breaks adjusted and cool?”, “Trucks, Don’t be fooled 4 more miles of steep grade”. That’s what the market feels like. It ain’t over yet. We aren’t down yet. Don’t be fooled. But, we might be close.
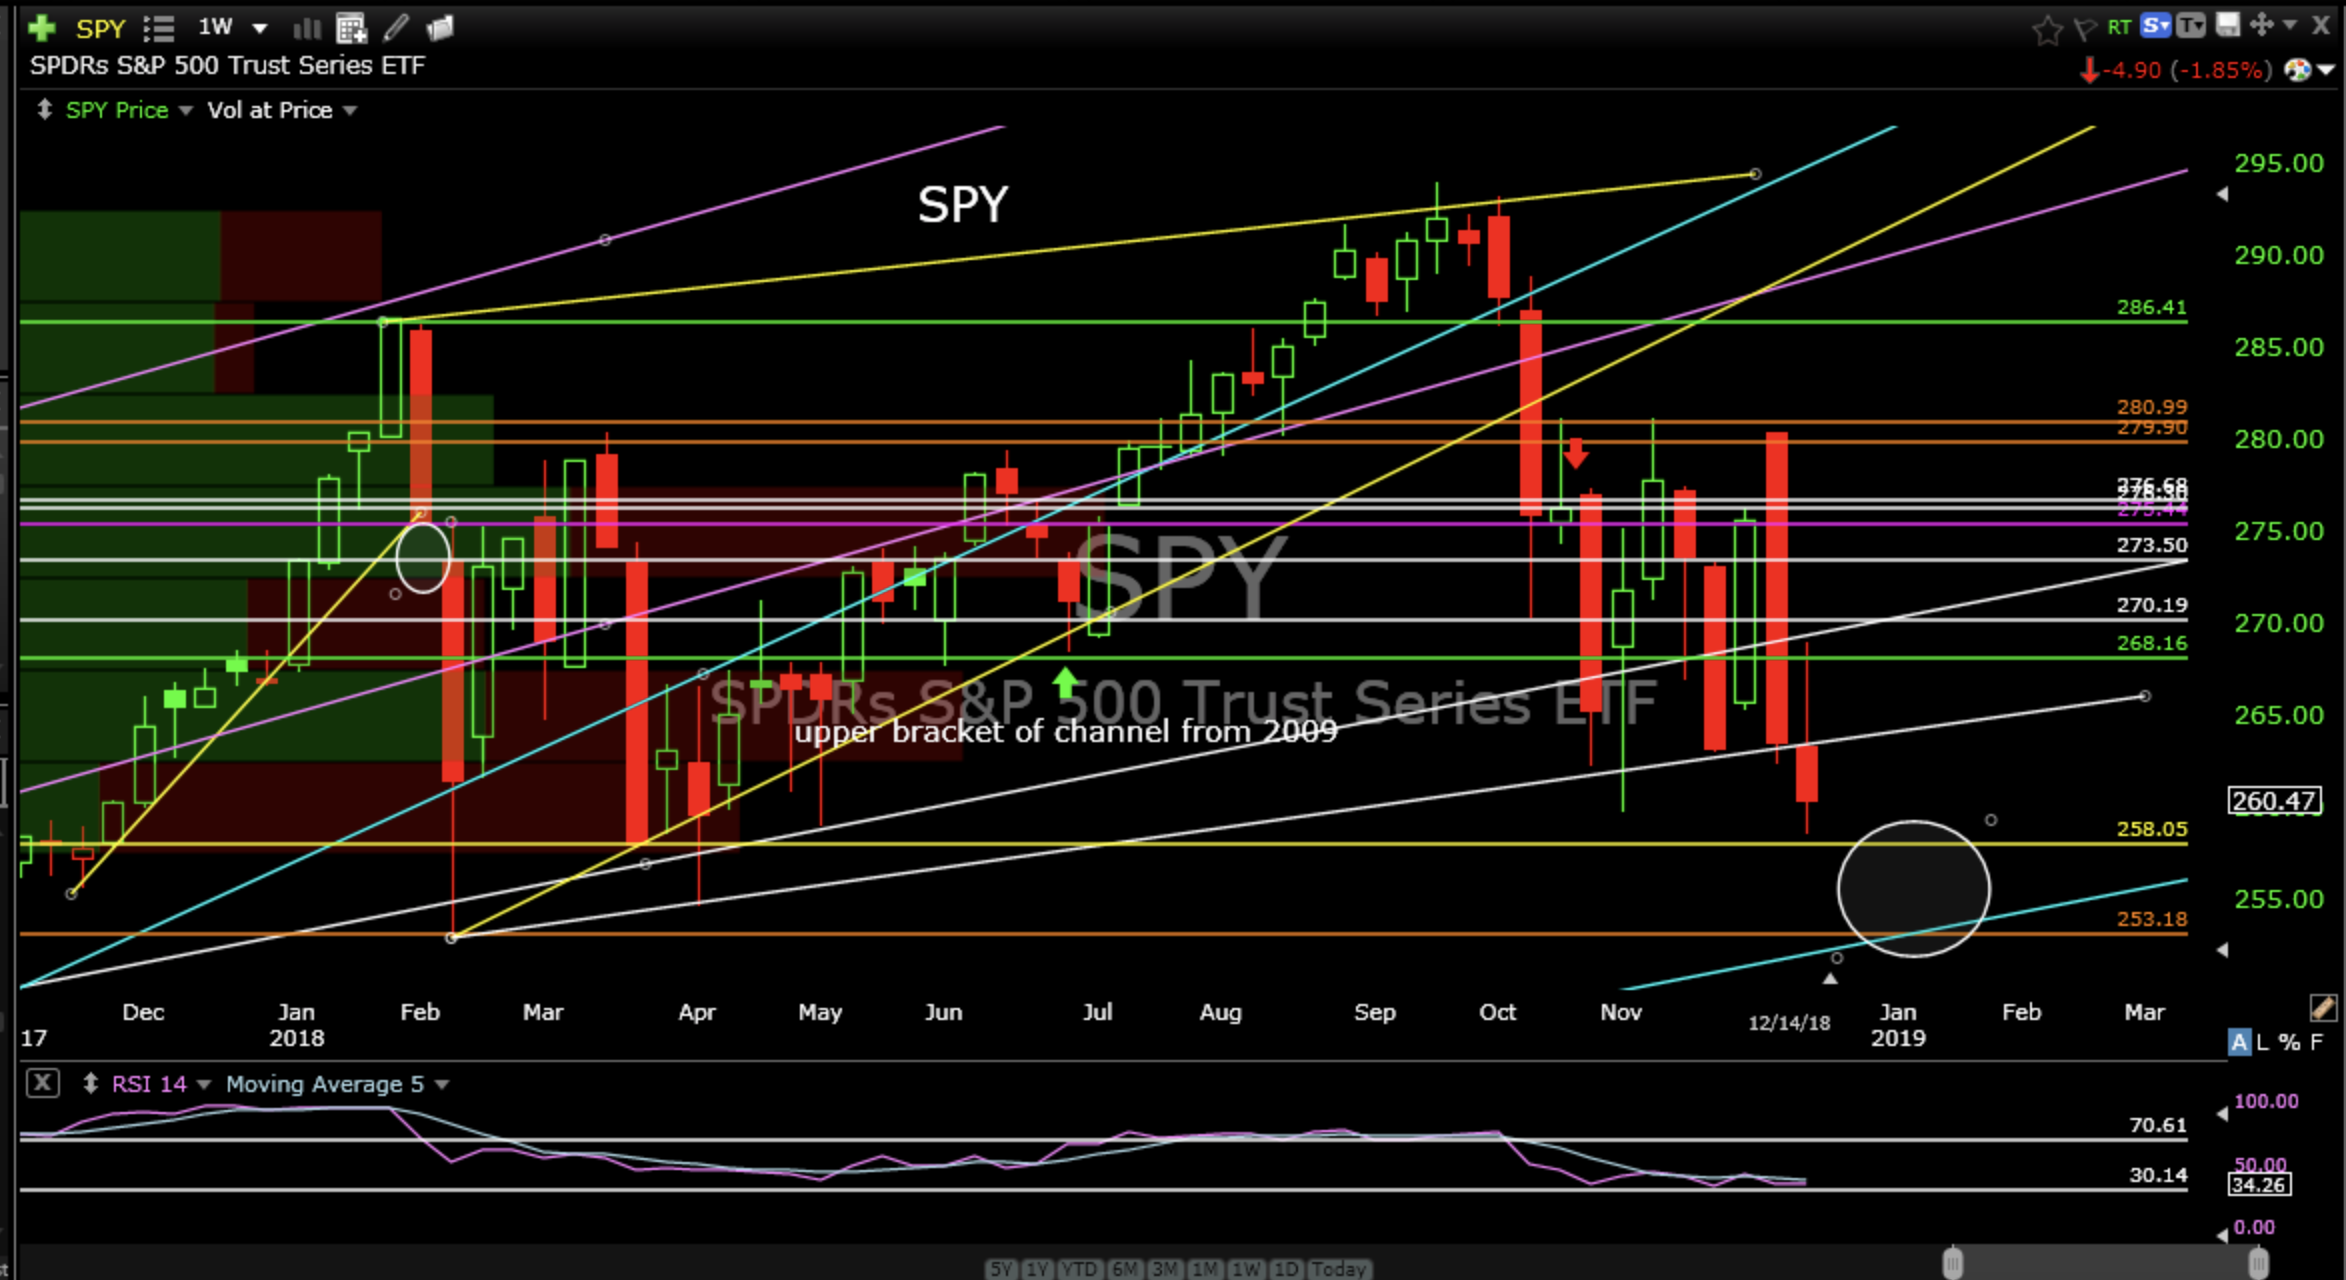
Friday’s close took the S&P 500 index ETF (SPY) weekly close under another support level albeit a weak support level. While there is no price action that would indicate bottoming, price is almost down to the 2018 weekly close low of 258.05 which is actually a level that is logical to anchor to. Of course, no one knows where the bottoming will occur, we can only identify the price levels that have enough demand to support price.
If 258.05 doesn’t hold the next support level is the “rising mean reversion zone”. This is the level I identified in October as a likely rising price zone that SPY would seek. It is smack dab in the middle of the rising channel from the bottom in 2009.
These are the next levels to watch for bottoming. And, not to be the bearer of bad news, when we get the bottoming the next problem will be getting back up through the 2018 congestion. I’m afraid it’s going to be a long slow slog. They come down quicker than they go up. Long from 2011.
SPDR’s S&P 500 Trust Series ETF (SPY) weekly
The Nasdaq 100 Index (QQQ) looks similar; more broken support and approaching the February 2018 closing weekly low of 156.10 and a rising support level from 2015/2016. This is also a level that is a logical place to anchor. Long from 2013.
Invesco QQQTrust Ser 1 (QQQ) weekly

The Russell 2000 Index ETF (IWM) also wants to work it’s way down further; the bottom of the 2017 congestion zone looks like a logical place to stop the bloody rout somewhere around 133.
iShares Russell 2000 Index Fund ETF (IWM) weekly

The technology sector ETF (XLK) weekly close was again under rising intermediate support but just above a level that is also a logical place to bottom. Price bounced off this area three weeks ago so we know there is some demand at this level. If this level, 63.53, doesn’t hold the next stop is the old, monthly close from 2000 (60.56). Long from 2013.
SPDR’s Select Sector Technology ETF (XLK) weekly

The energy sector ETF (XLE) closed right on top of the final line in the sand, so to speak. If it doesn’t bounce here then it’s likely to go down another 10%. It has truly been a mess. Also, if it doesn’t bounce here it would be time to sell it if you own it. Long from January 2018.
SPDR’s Select Sector Energy ETF (XLE) weekly

The utilities sector ETF (XLU) continues to grind higher outperforming SPY and all other sectors. New weekly highs, higher lows and all looks good in utility land. Hold it if you own it. Long from May 2018.
SPDR’s Select Sector Utilities ETF (XLU) weekly

The financial sector ETF (XLF) looks awful. It has broken more support and there is not much nearby support until rising primary support. The only components doing moderately well in this sector are financial exchange companies like Cme Group Inc (CME) and Nasdaq Inc (NDAQ). No help here. No position.
SPDR’s Select Sector Financial ETF (XLF) weekly

The consumer staples sector ETF (XLP) which has recently been out performing all other sectors except utilities is pulling back after trading up into resistance and looks like it wants to seek a little lower ground before going higher near term. No position.
SPDR’s Select Sector Consumer Staples ETF (XLP) weekly

The health care sector ETF (XLV) finished the week right on top of rising support. If it breaks this support level it will be time to sell and collect profits from the long position I recommended in summer of 2017.
SPDR’s Select Sector Health Care ETF (XLV) weekly

The industrial sector ETF (XLI) just broke rising support from the bottom in 2009, however, there are two things to note. One, rising support with industrials has been sloppy over the years and two, price landed the week on a lower support level that has the ability to support price. It’s not uncommon for price to test the lower of two levels if they are close. It could try and bottom right here and if $66 gives way forget about it. No position.
SPDR’s Select Sector Industrial ETF (XLI) weekly

The materials sector ETF (XLB) closed the week under the closing highs made in early 2015 and on top of weak rising support. This would also be a logical place to anchor. No position.
SPDR’s Select Sector Materials ETF (XLB) weekly

The consumer discretionary sector ETF (XLY) looks just like SPY, QQQ and XLK; broken support but just above a pretty strong demand zone (100) that propelled price after the re-set in January-March this year. If 100 can’t hold then price will seek rising support which is currently about 92. No position.
SPDR’s Select Sector Consumer Discretionary ETF (XLY) weekly

The real estate sector ETF (XLRE) has recently been out performing SPY rising about 10% since the broader market started selling off in early October. Resistance was tagged two weeks ago and promptly sold off last week. This would be a logical place for another pullback. No position.
Real Estate Select Sector SPDR Fund (XLRE) weekly

The newly formed communication services sector (XLC) just looks awful. It has been in a steady decline from it’s beginning. The only bright spot is that it has not taken out the low from three weeks ago. Meh. No position.
The Communication Services Sector SPDR Fund (XLC) weekly

So, the recent leading sectors, utilities (XLU), consumer staples (XLP) and real estate (XLRE) are all running into resistance and the long term leading sectors, technology (XLK), consumer discretionary (XLY) and health care (XLV) are just above levels that have strong enough demand to support price. It would be logical to think that if utilities, consumer staples and real estate are fading back at resistance then money flow might bid up technology, consumer discretionary and health care at nearby support levels.
Or, the reverse is a possibility. Nearby support levels for technology, consumer discretionary and health care give way and more money flows to utilities, consumer staples and real estate breaking through any overhead resistance.
Either way, these sectors are all near very important inflection zones and price action around these support and resistant zones will be critical in determining how we position ourselves going in to 2019. For this market to turn around we need more participation from just utilities, consumer staples and real estate. It doesn’t look like financials are going to help any time soon. Industrials are a definite maybe. The communication sector can barely be heard. The only sectors left are technology, consumer discretionary and health care; our bull market leaders. The good news is that these three sectors are hovering right above demand zones (support) that would be very logical places to bottom. The bad news is if these support levels give way.
If our bull market sector leaders fail here it doesn’t mean the bull market from 2009 is over. It just means to not be surprised to see lower prices in these sectors and the S&P 500 index for awhile. Kind of like “Truckers, you are not down yet”.
Key price levels are definitely in play right now including bonds. The 20+ Year Treasury Bond Fund ETF (TLT) closed the week exactly at resistance after testing higher during the week. The recent bump in bond prices is likely a counter trend rally as the primary trend over the past three years is down so my expectation is lower bond prices and higher interest rates.
iShares Barclay’s 20+ Year Treasury Bond Fund (TLT) weekly

So, if XLK, XLY and XLV begin to bottom over the next few weeks there will be some excellent low risk/high reward set ups that I have been monitoring.
A few of the set ups that I’m monitoring:
Apple Inc (AAPL) weekly
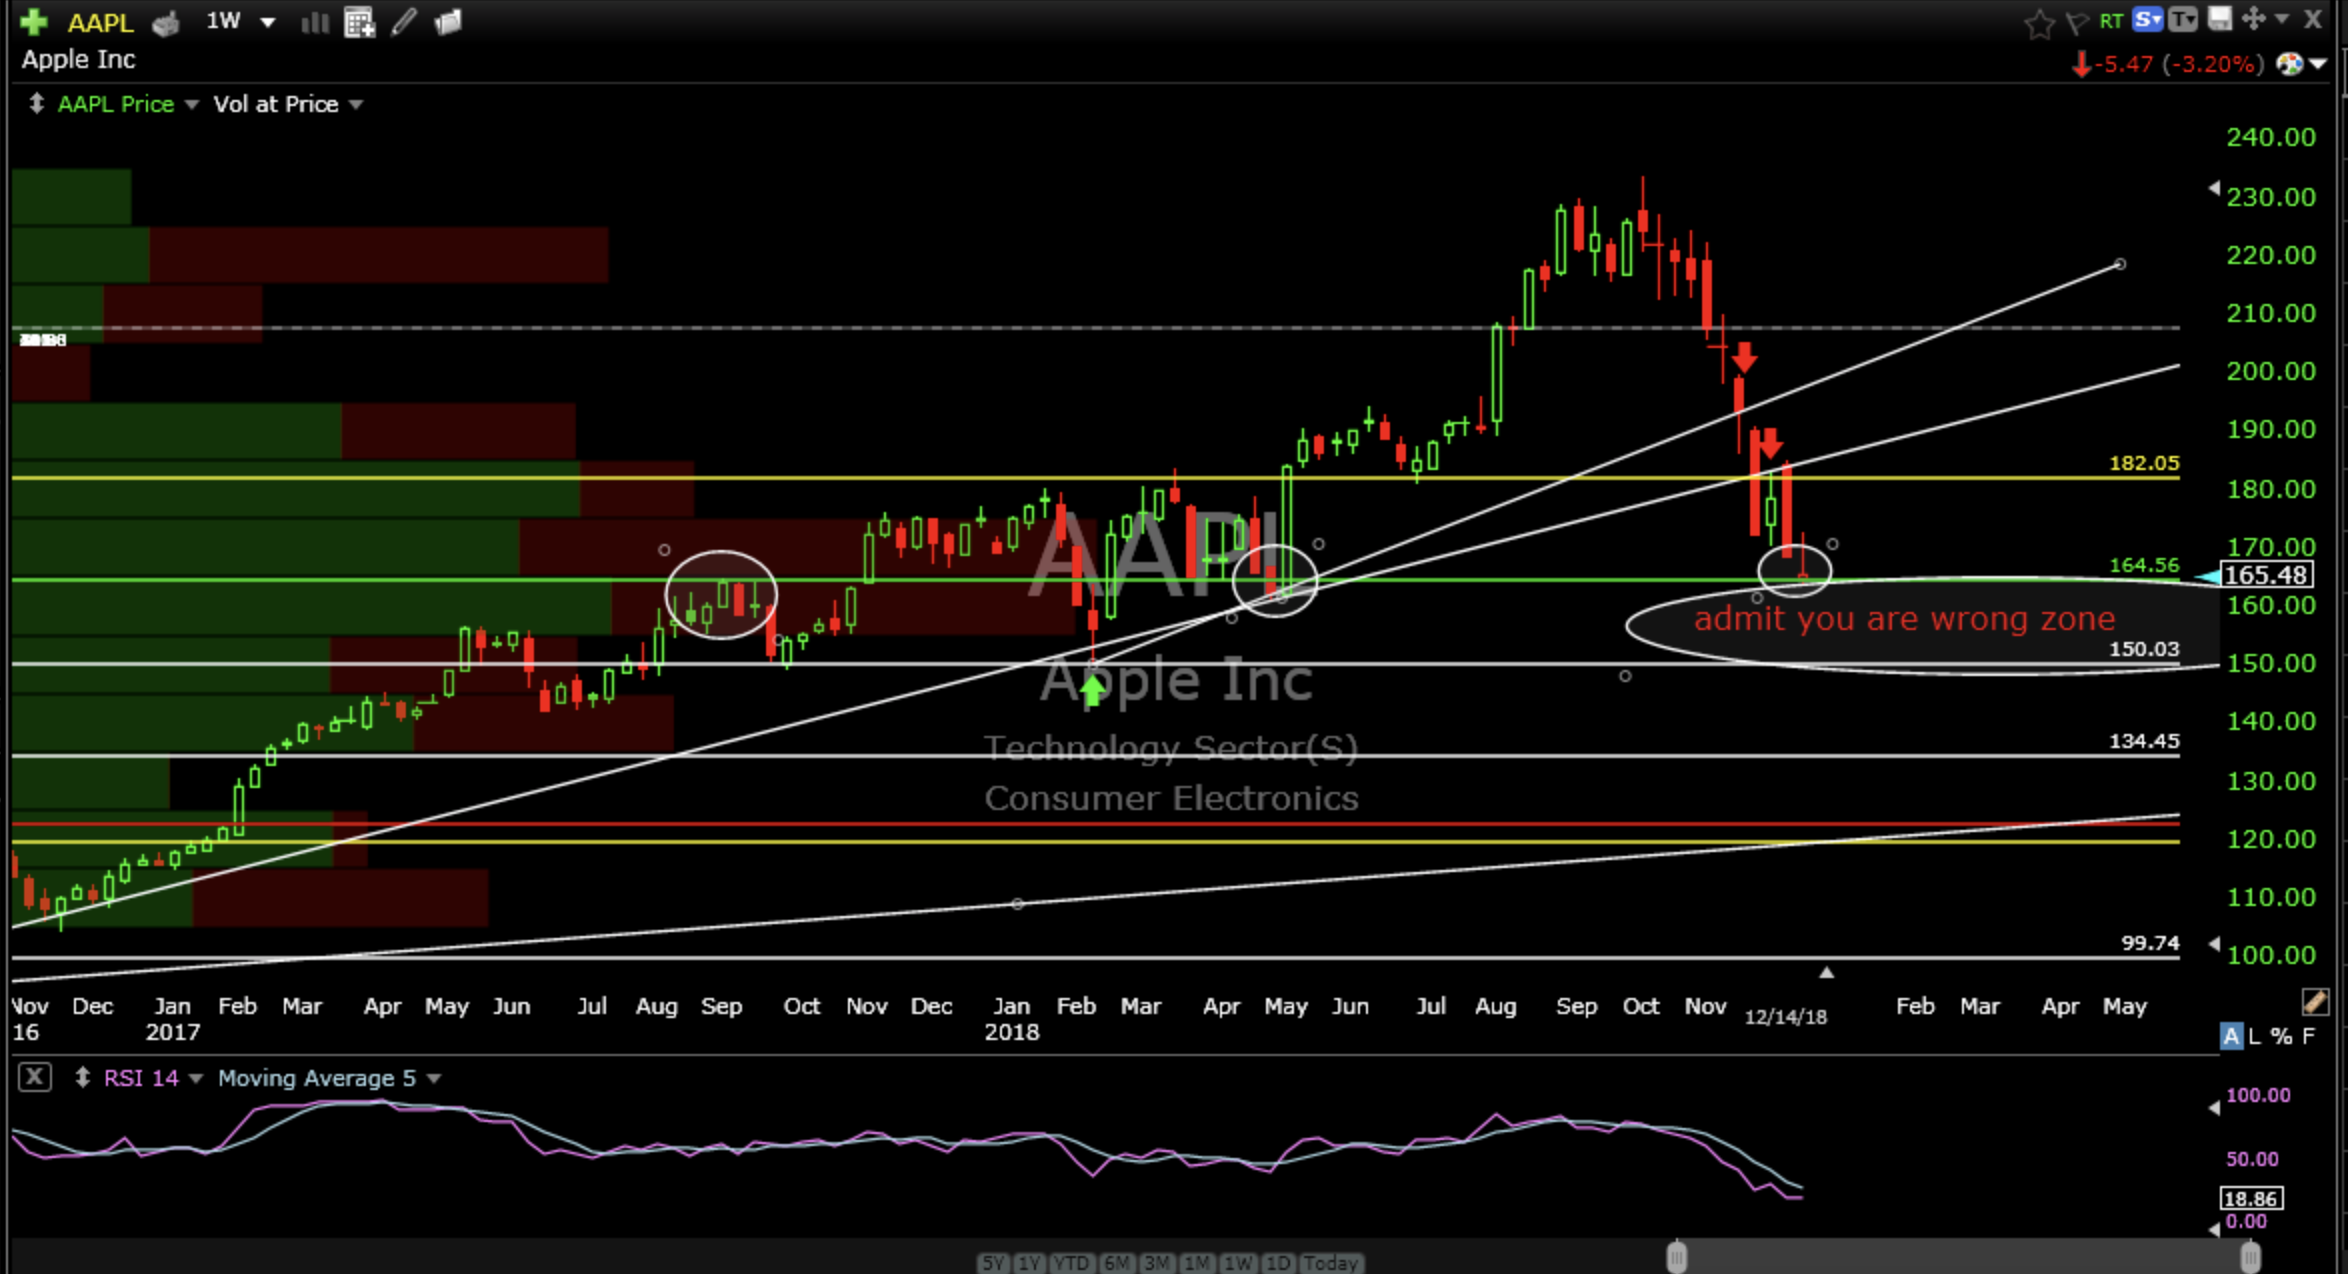
AAPL closed the week right on a price level that does have some support. If it gets bid up here it has a good chance to run up to 180 as a first target. I am monitoring intraday and daily for first signs of increased bidding. It will likely be a “own it above 164 and sell it below 164” kind of a trade.
Fedex Corp (FDX) weekly

There is some serious mean reversion going on here. It’s on a fast and steep approach into demand zones (support). The good news is there is lots of runway (support/demand). The same exact set up is underway for UPS. Price is trading down into rising support and support from the 2015 highs. If price can get a bid down at these lower levels it would make perfect sense to begin another leg up. If it breaks rising support look out below.
United Parcel Service Inc (UPS) weekly

The support is even more evident in UPS along the lower end of the accumulation range near $94 during 2014 and 2015. There should be demand at this level and if not then something is really wrong with our economy. If we aren’t transporting stuff we ain’t selling enough stuff and if we aren’t selling enough stuff then we aren’t buying enough stuff and if we…never mind, Lululemon was packed today selling overpriced stuff to everyone, including me..gifts..not for me..never mind. $94 would be a logical place to bottom.
NVIDIA (NVDA) weekly

There are three support levels I am interested in. The first level has been hit and is holding well, however, not getting much of a bid up. Any one of these levels would be a logical place to bottom so price action around these levels is very important to monitor. All bets are off if 96 is breached. That’s a long way down from current price but if it gets there and finds demand then own it above 96 and sell it below.
Equinix (EQIX) weekly

Nice mean reversion in to rising support from 2013/2014 and coincidental support from the highs of 2016. Probably not politically correct to reference the Doublemint gum jingle but double support is good. Price is getting supported but not yet bid up. I’m looking for a little more strength before going in. All bets are off under support.
Facebook Inc (FB) weekly

FB is looking good. It got good support three weeks ago at the 2016 highs and has been bid up since. Last week it cleared the downward sloping resistance zone that follows the lower and lower highs established from the down trend that began during the summer. If it breaks 133 it’s likely going to 115 next. Another “own it above 133 and sell it below”. This might go on the buy set up list this week.
India (INDA) weekly

Coming back in for a re-test of 2013/2016/2017 rising support. It could be setting up for a strong move higher but it needs to stay above $30. Price is about to test this rising level again. Two tests are better than one by the way. If it gets another bid up it might be time to buy some. It’s looking very interesting.
So, while price action in the major averages sucks there are nearby levels that are logical places to bottom. It’s especially important to note that our bull market sector leaders, XLK, XLY and XLV are all right on top of good support as are SPY and QQQ. These are very important price levels that are currently in play. Know these levels and watch for price action surrounding them. You know I’ll be watching most every minute every day. It’s going to be an interesting next few weeks. Now go buy something online that needs to be shipped somewhere by FDX or UPS. Please.
Trade Smart,
Don