So many good charts, so little time. Here are some more… MU, CBT, AXTI, NVDA, DDD, SPY
I hate videos too so here you go…all charts attached.
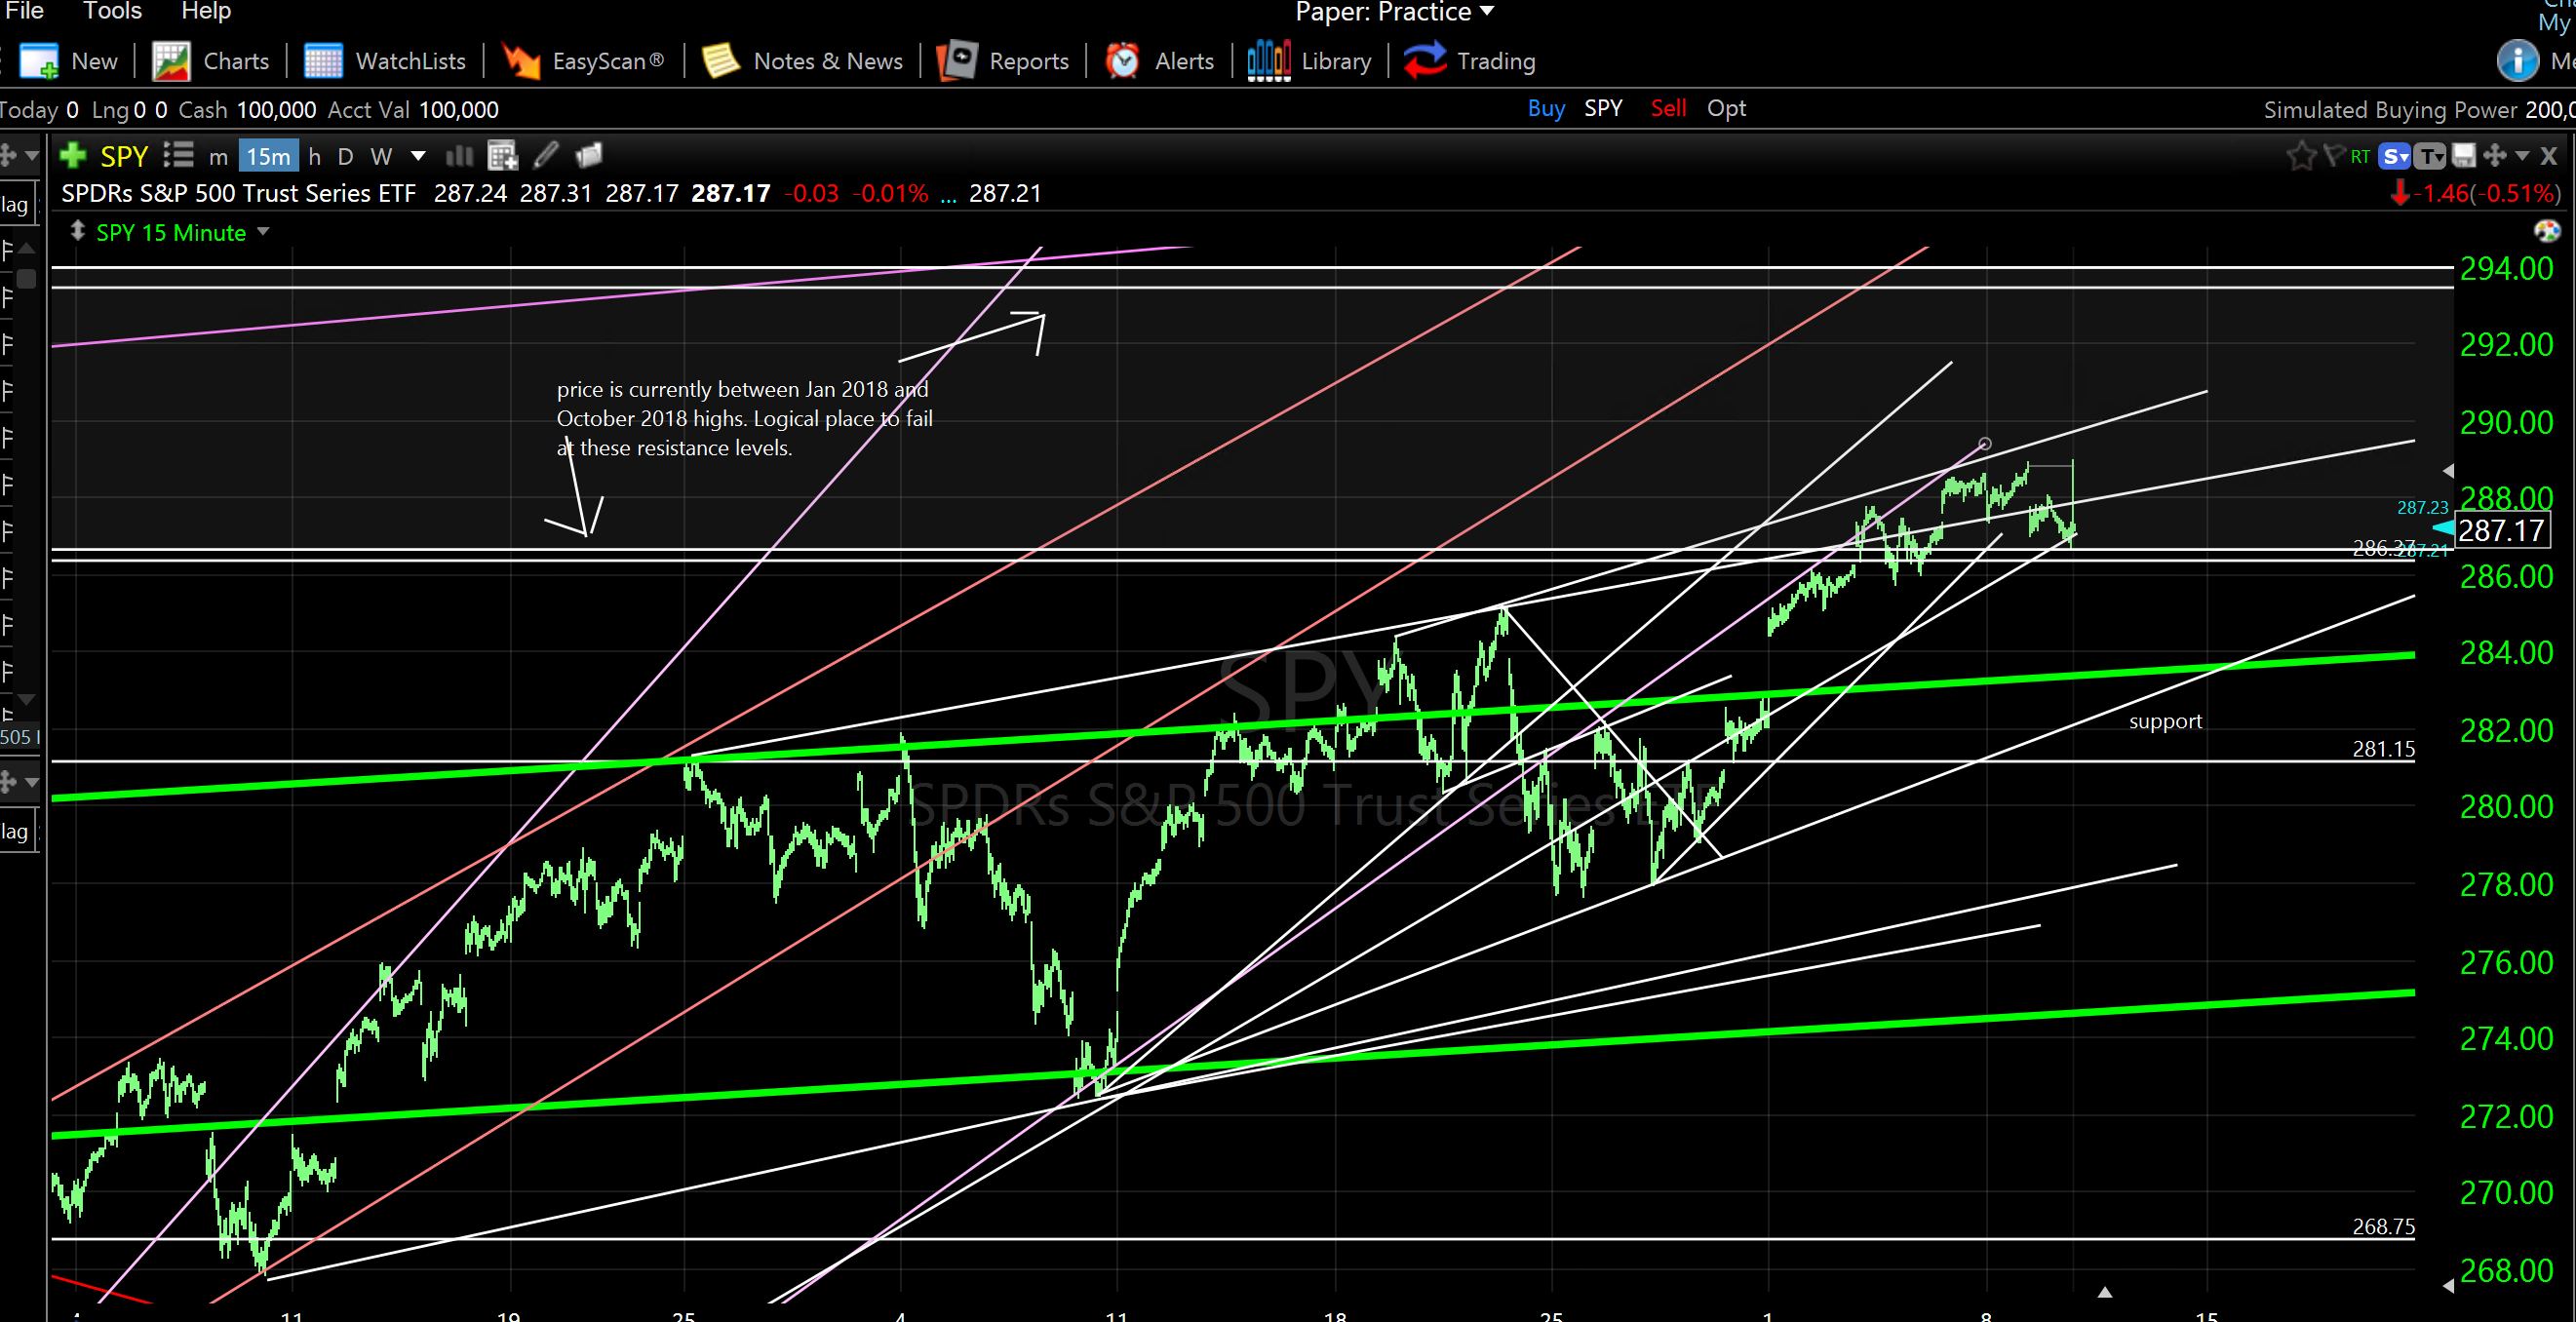
I still expect the broader market (SPY) to “dip” soon. Longer term (12-18 months) it looks like it’s going to rip. Big tech baby. Get it on.
SPY is up against resistance and should re-set soon. Don’t be surprised. It will bring most everything back a bit before resuming expansion. Possibly back to 265-270 SPY. Current support is around 282-283 SPY.
Charts are self explanatory.
3d Systems Corp (DD) weekly

Axt Inc (AXTI) weekly

Micron Technology Inc (MU) weekly

Cabot Corp (CBT) weekly

NVIDIA Corp (NVDA) weekly

S&P500 Index ETF (SPY) weekly
Let me know if you have any questions.
Do your own due diligence. This is not investment advice. My opinions only.
Strap on your seat belts,
Don