Just charts, well mostly…here’s what I’m thinking…
Selling
It is really hard to sell into strength and really easy to sell into weakness. When a stock is ripping higher you don’t want it to end so it’s difficult to pull the trigger and capture profits and when a stock is cascading down you are just hoping it turns around. Right? This is the bane of the retail investor.
The Charts
This stuff ain’t easy for professionals either. If they are any good they have an edge. I have an edge. For me, it’s in the charts. They provide a simple guide based upon historical and repetitive price activity to help identify areas of low risk entries (pre spike) and opportune exits (avoiding stuff like recessions)…and a bunch of other stuff. Without these guides I would be lost. They give me the confidence I need in a non-perfect world. Do I get lost occasionally? Of course. This stuff ain’t easy. But, to invest without a guide/chart is just crazy in my opinion.
Entries and Exits
Entries and exits do not mean all or nothing. You can always leg into a trade and always leg out. You can always take profits on 1/2 of a position, for example, and let the other 1/2 ride. I’m just trying to give you the guide as I see it.
OK, enough of that stuff.
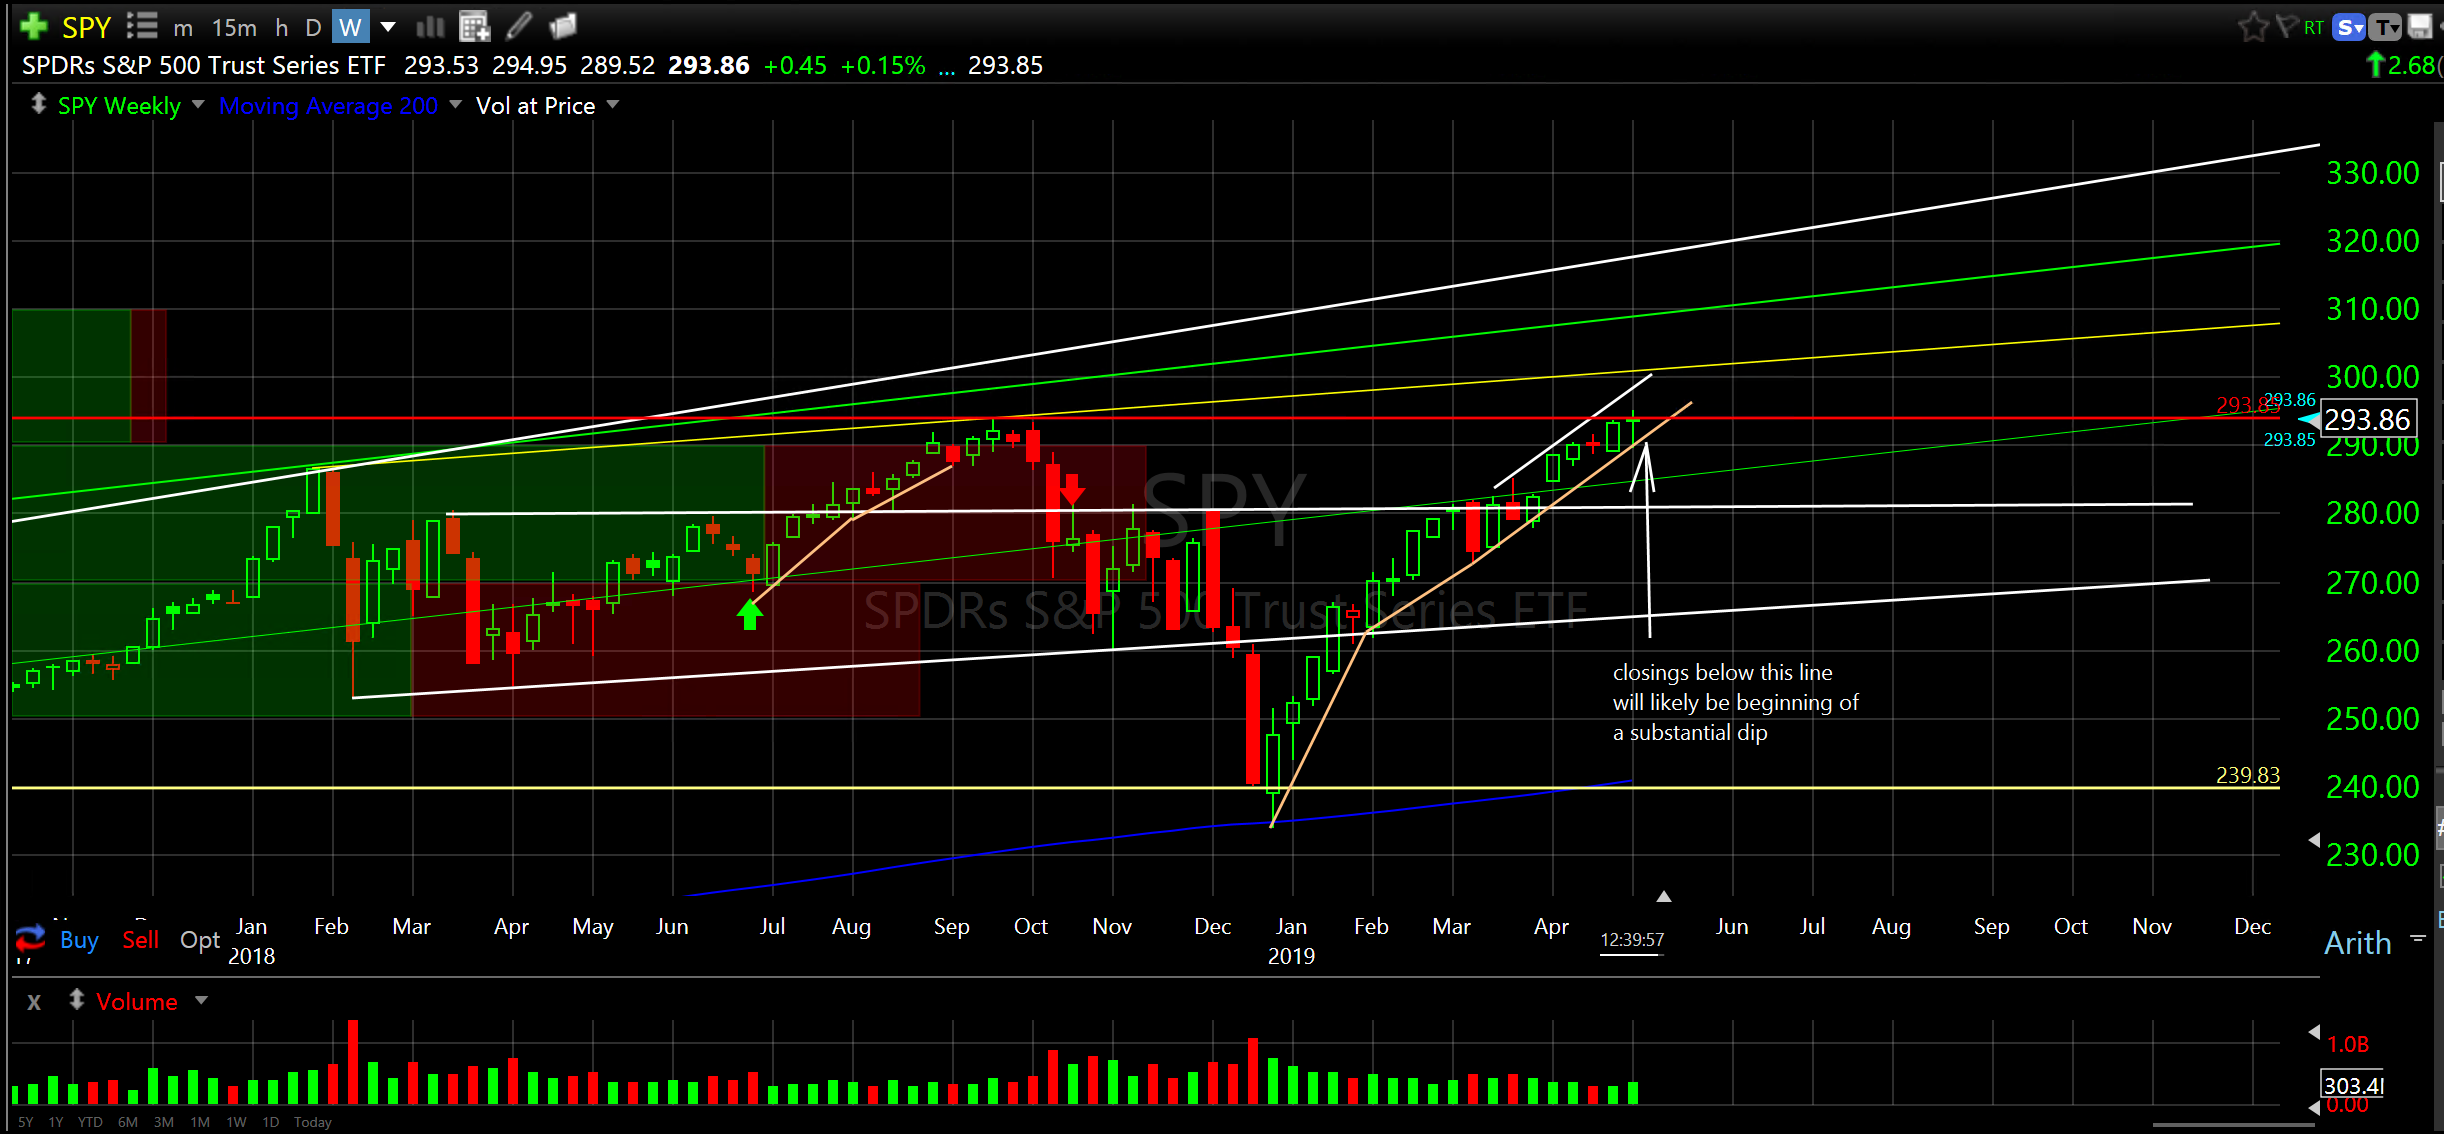
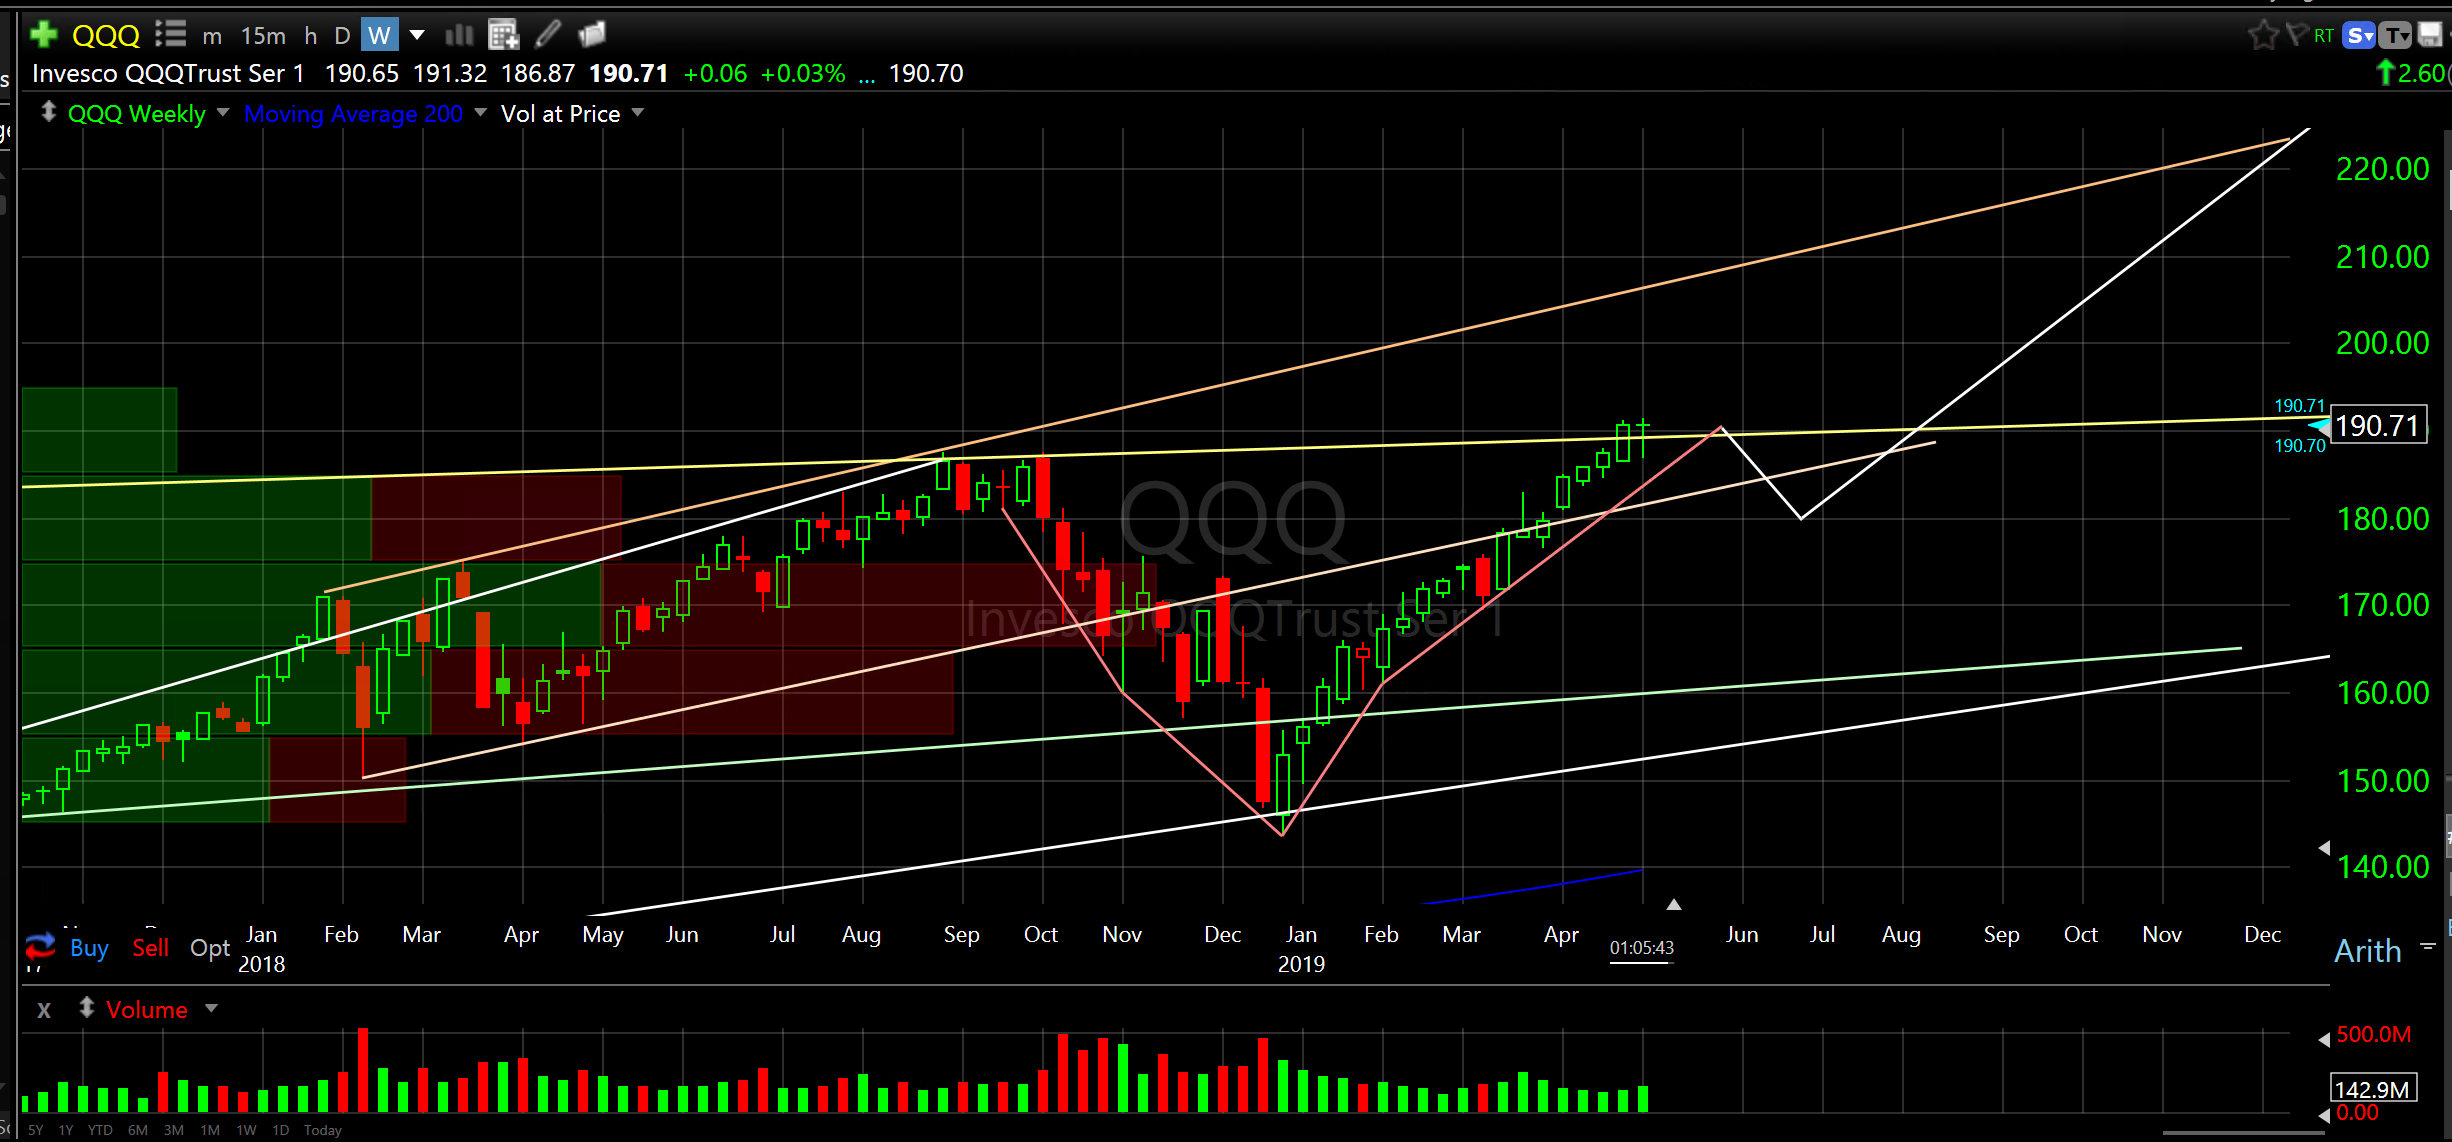
So, as far as the broader market is concerned, SPY has not broken support. Neither has QQQ. The trajectory of both are currently unsustainable and therefore due for correction. Just be aware. The charts show where price is likely to go based upon historical evidence. See SPY and QQQ charts below to see what I see.
S&P500 Index ETF (SPY) weekly
Powershares QQQ Trust Ser 1 (QQQ) weekly
Entries
On to some good chart set ups that to my eye look like they are at the beginning of another expansion cycle; pre-spike.
Charts should be self explanatory. Be aware that any dip in the broader market will effect 90+% of stocks. Please keep this in mind mi amigos.
And on to the charts. BTW, in my early twenties I was a Chart House waiter/bartender/grill master/steak cutter/prep guy/dishwasher…go figure…I didn’t know Charts would be my thing.

To the Charts…
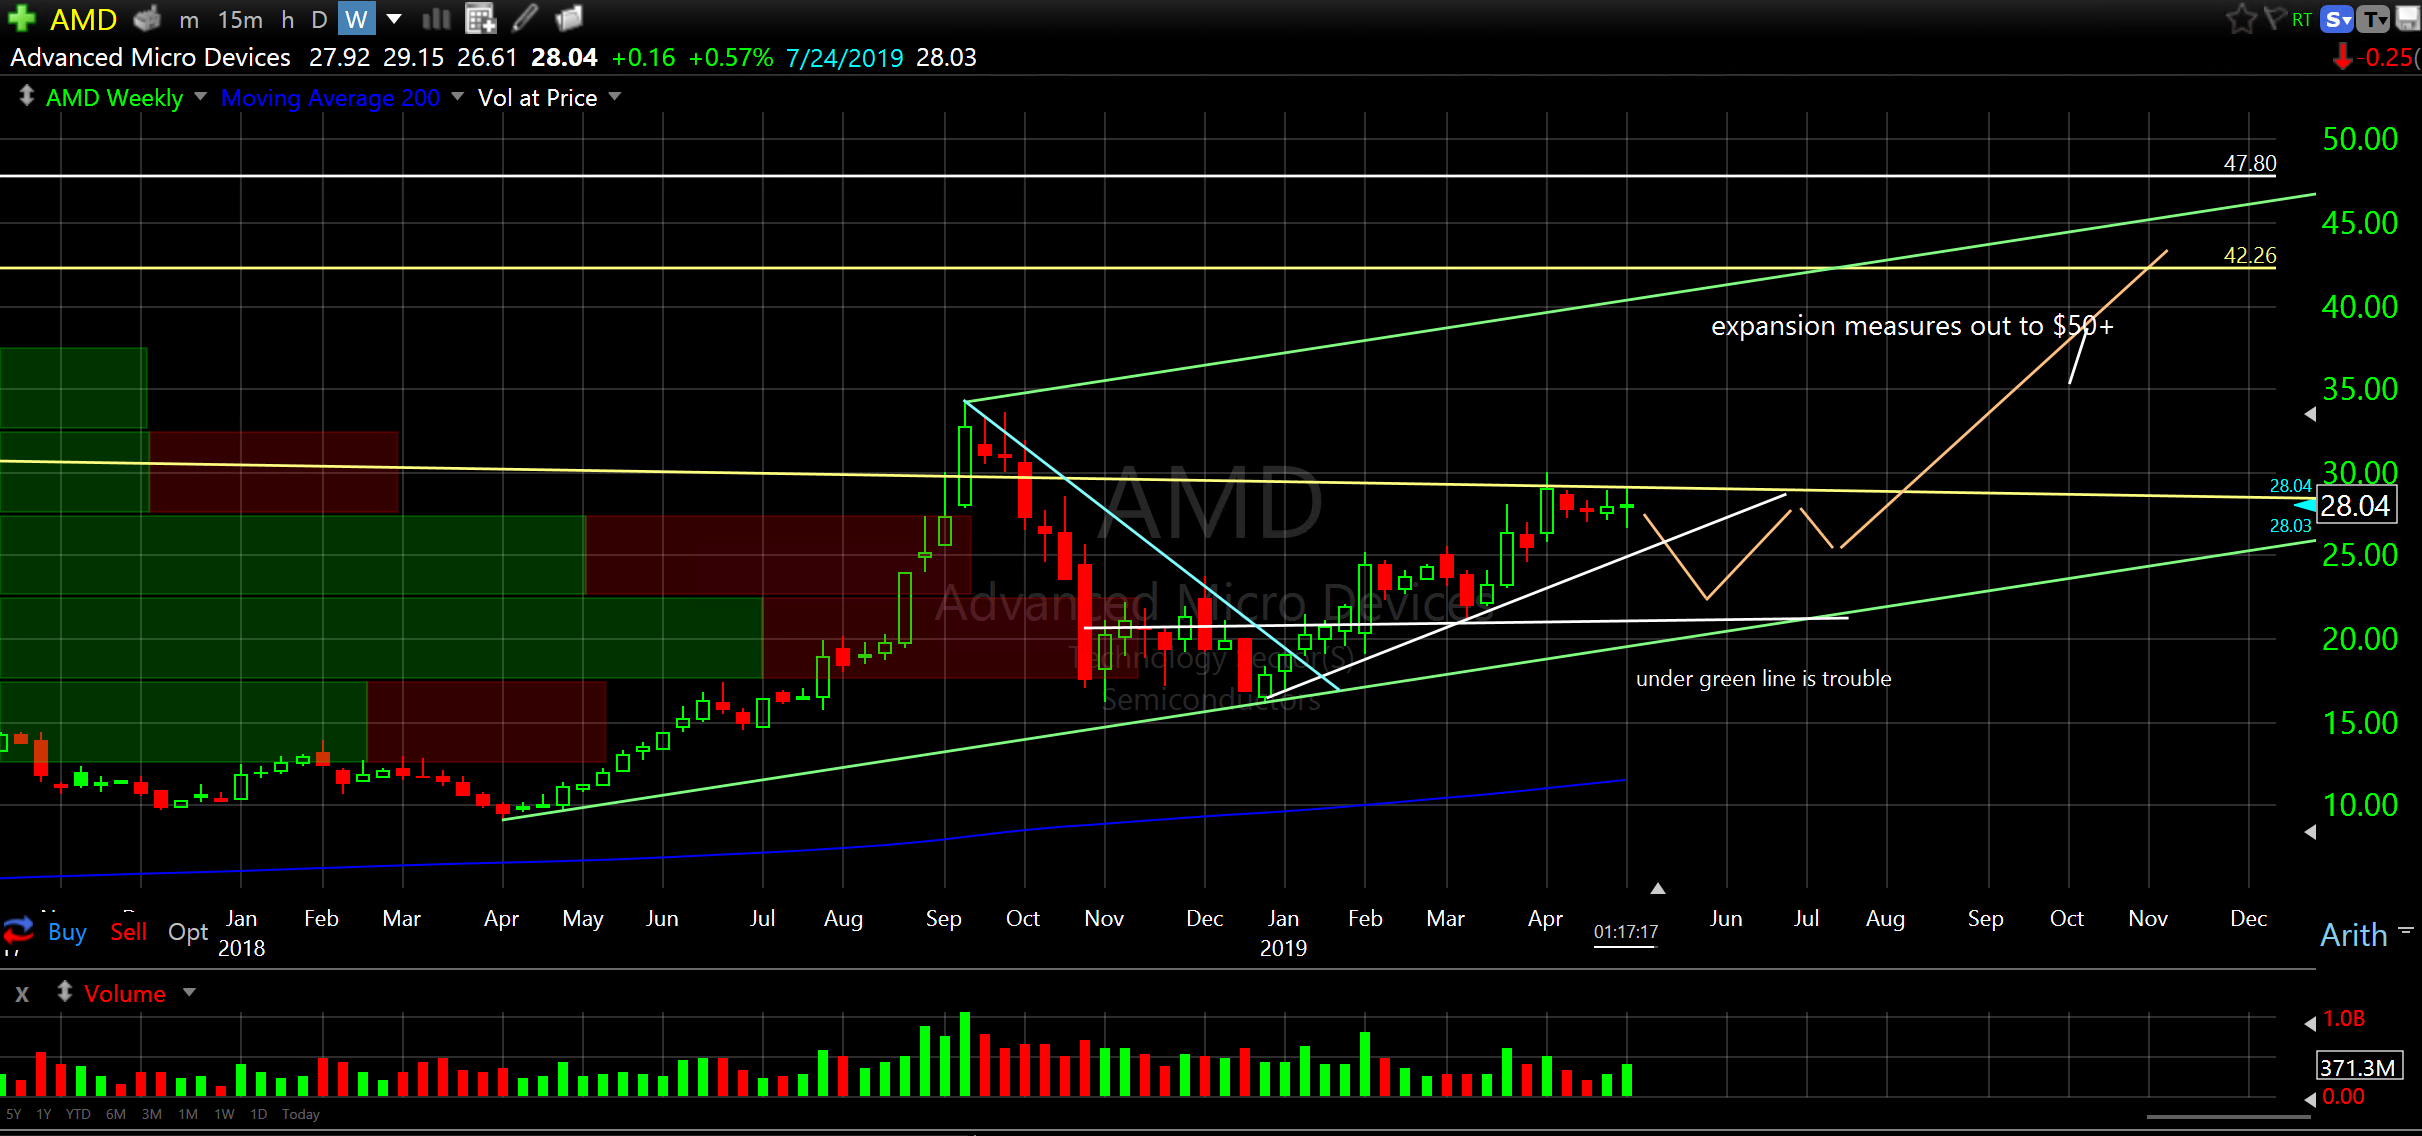
Advanced Micro Devices (AMD) weekly
looks like a good one…post dip even better.
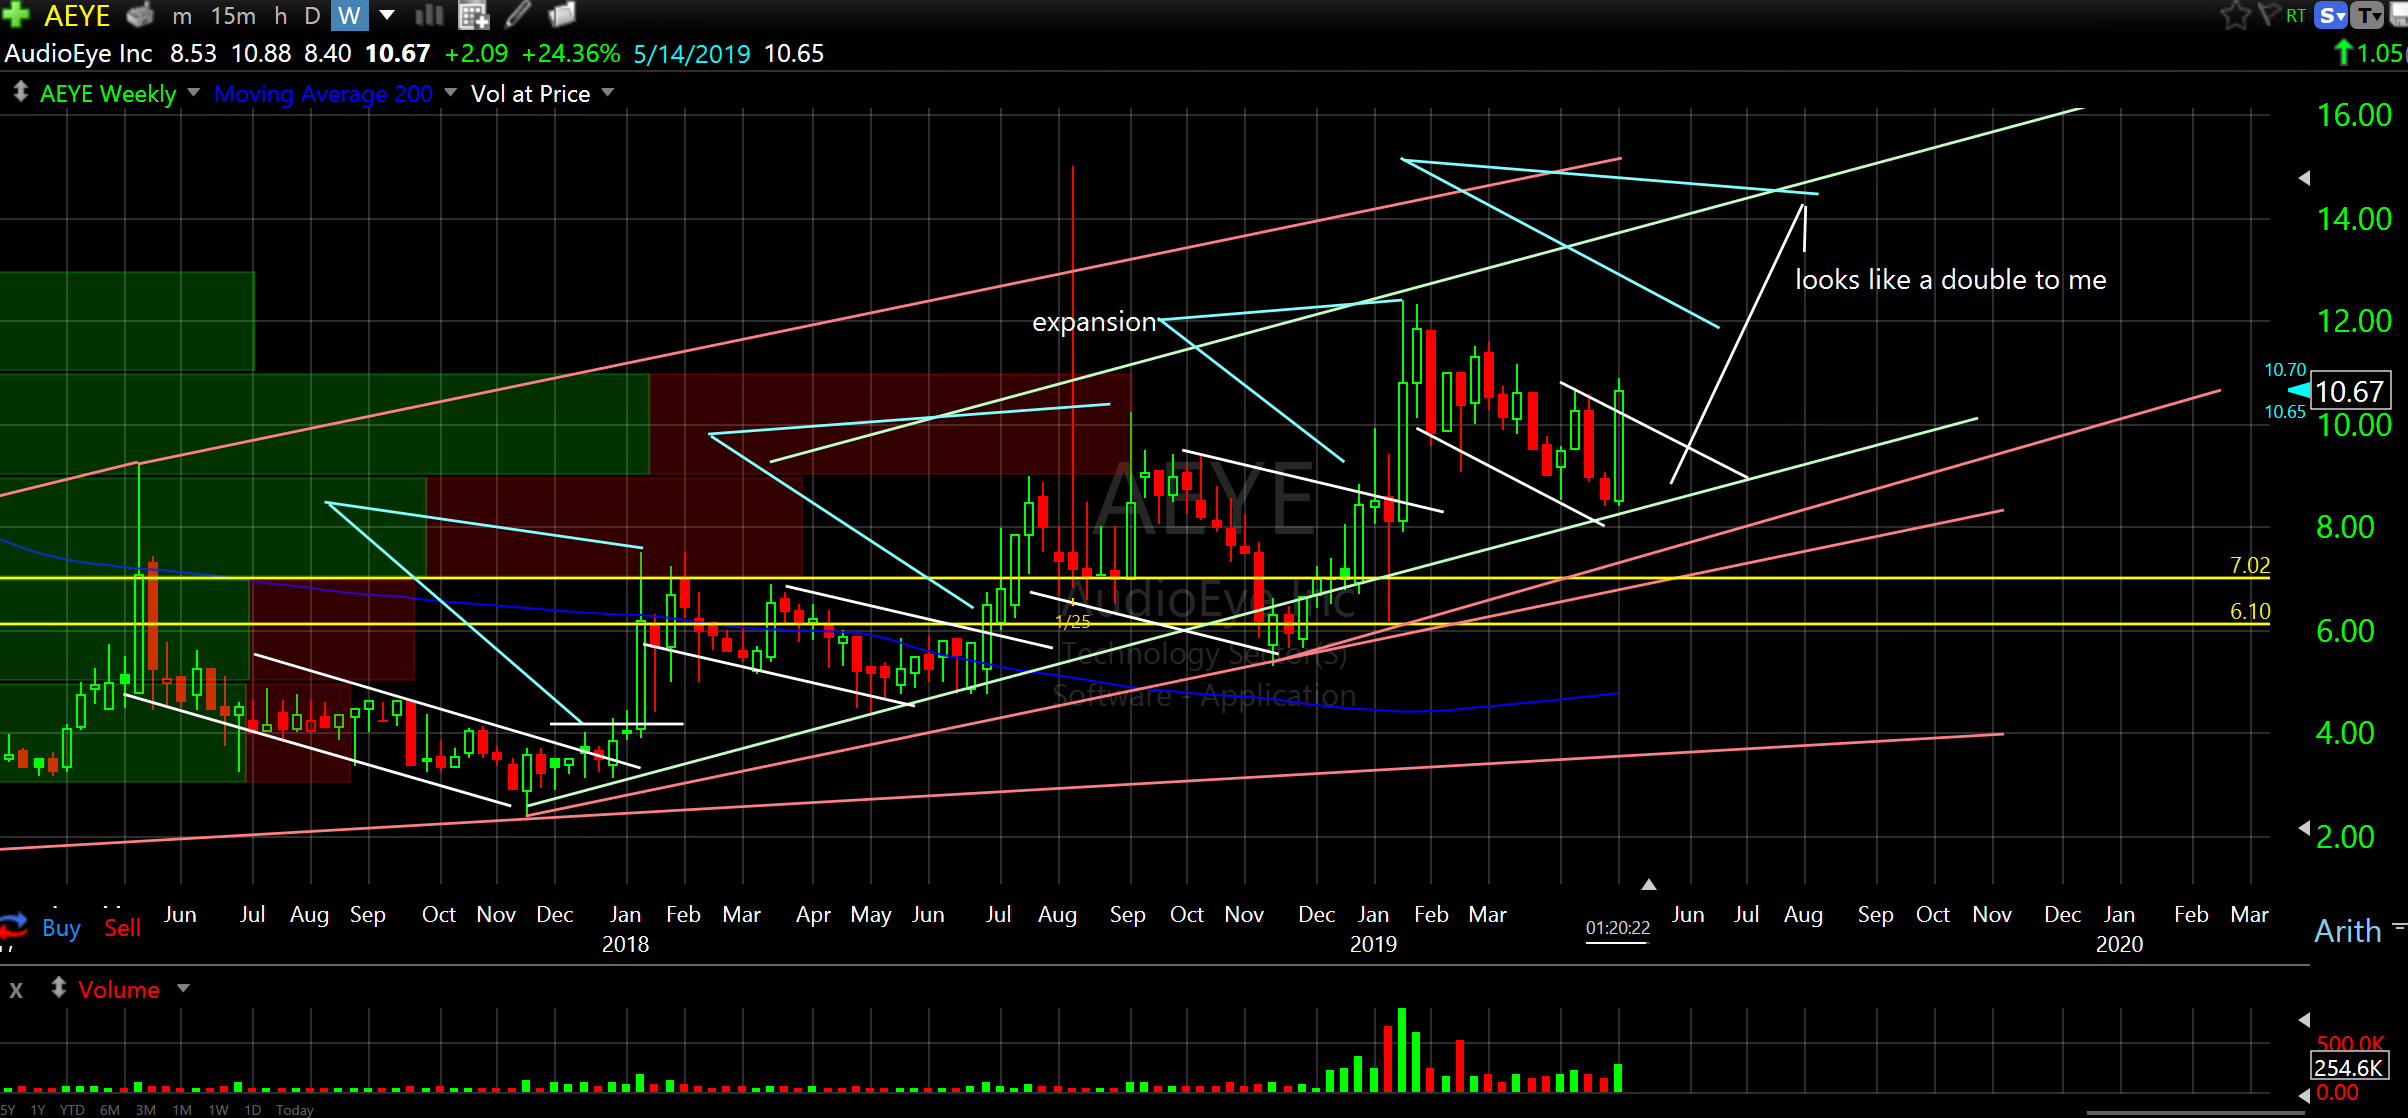
AudioEye Inc (AEYE) weekly
caught my eye matey.
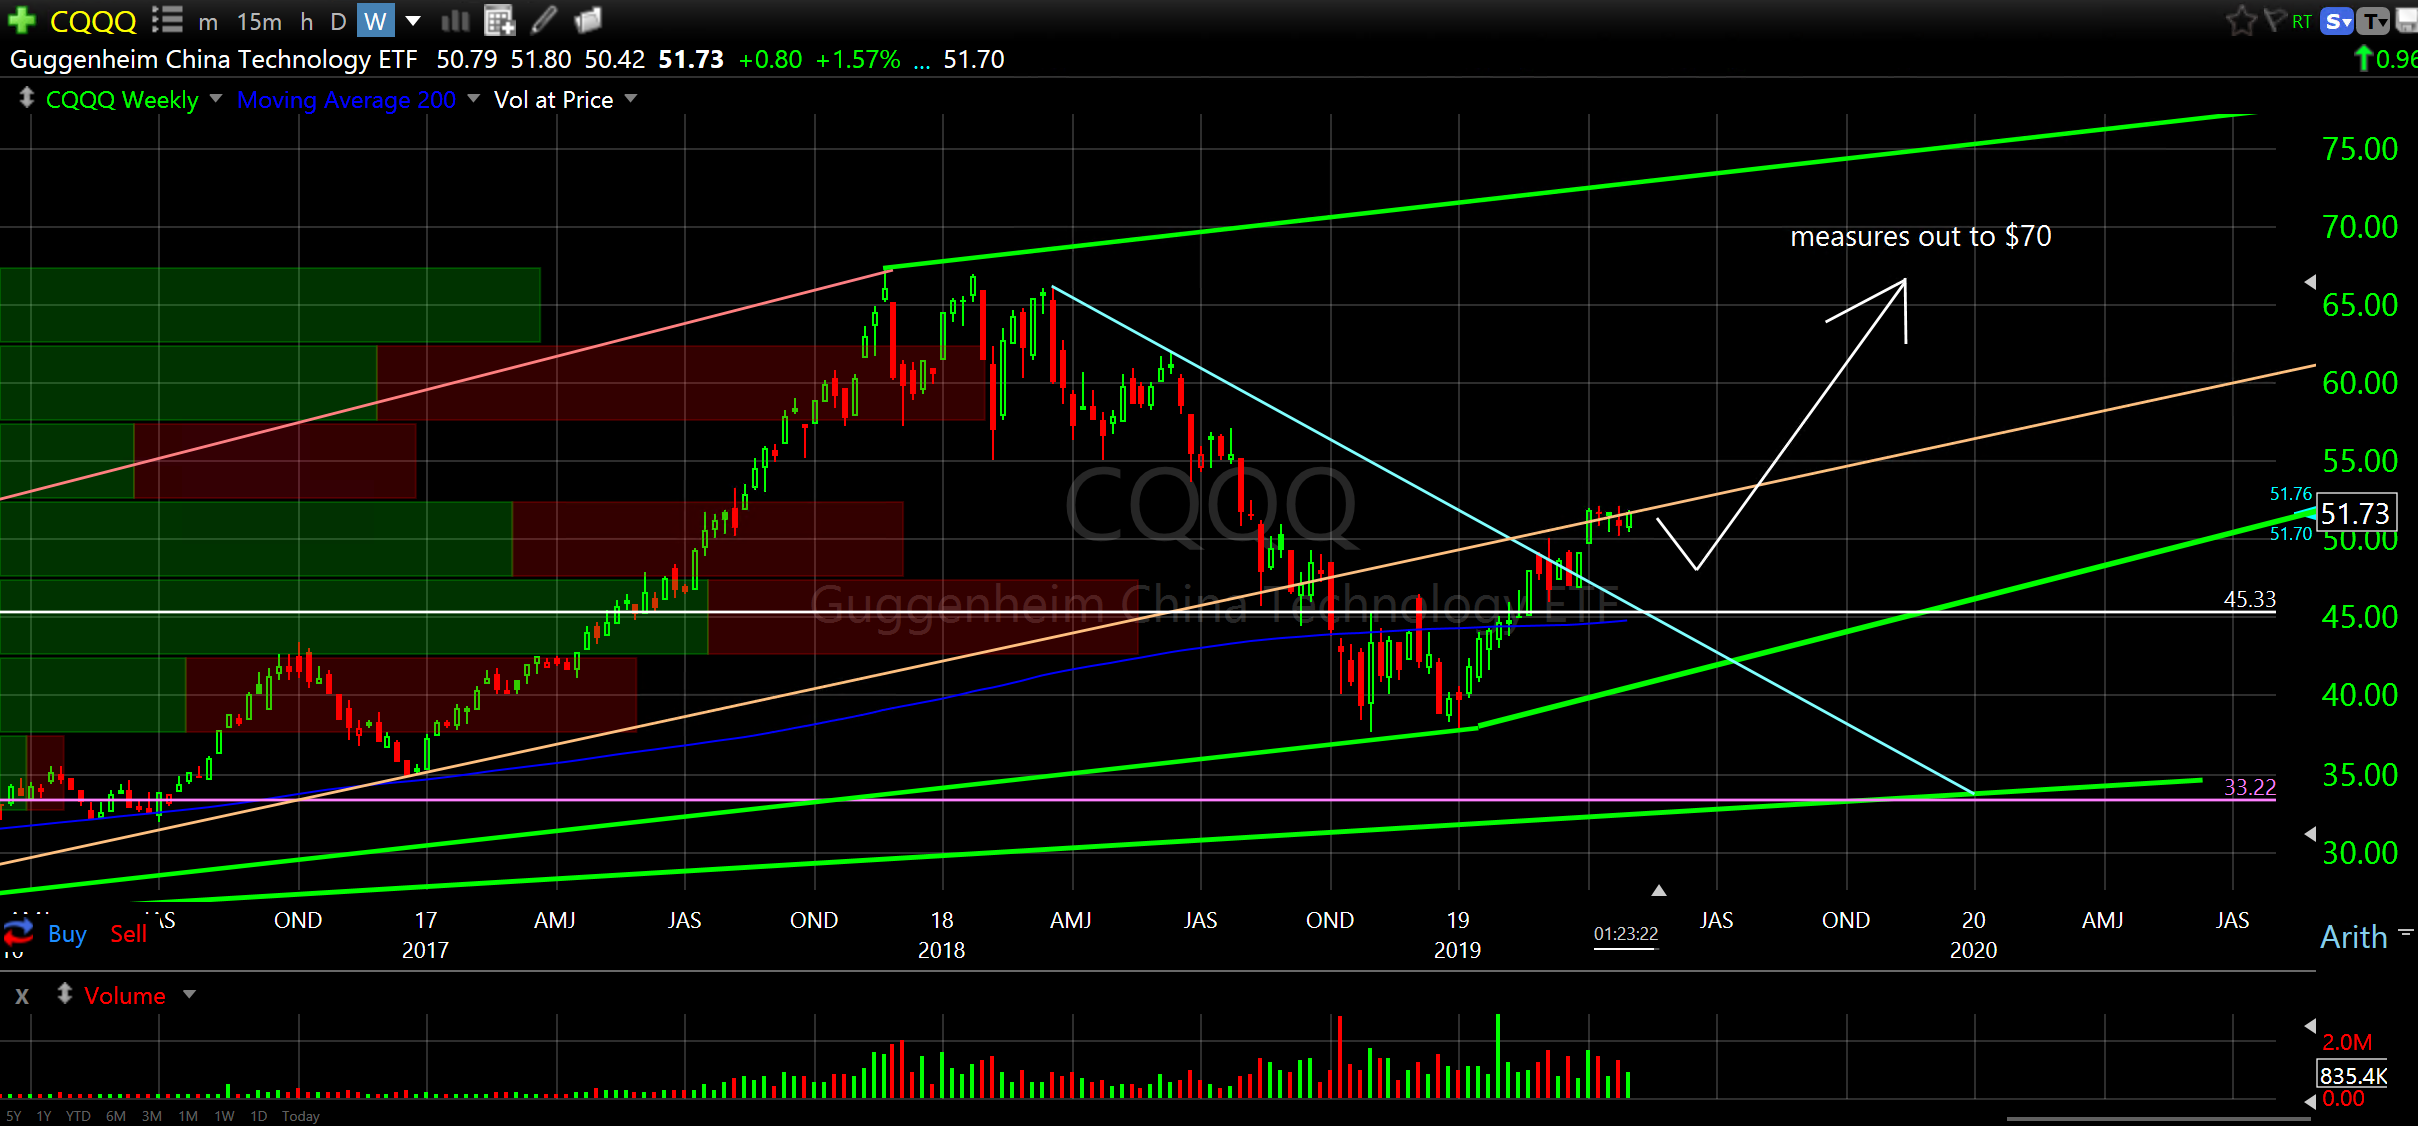
Guggenheim China Technology ETF (CQQQ) weekly
I love China…
and speaking of China…
Baozun Inc (BZUN) daily
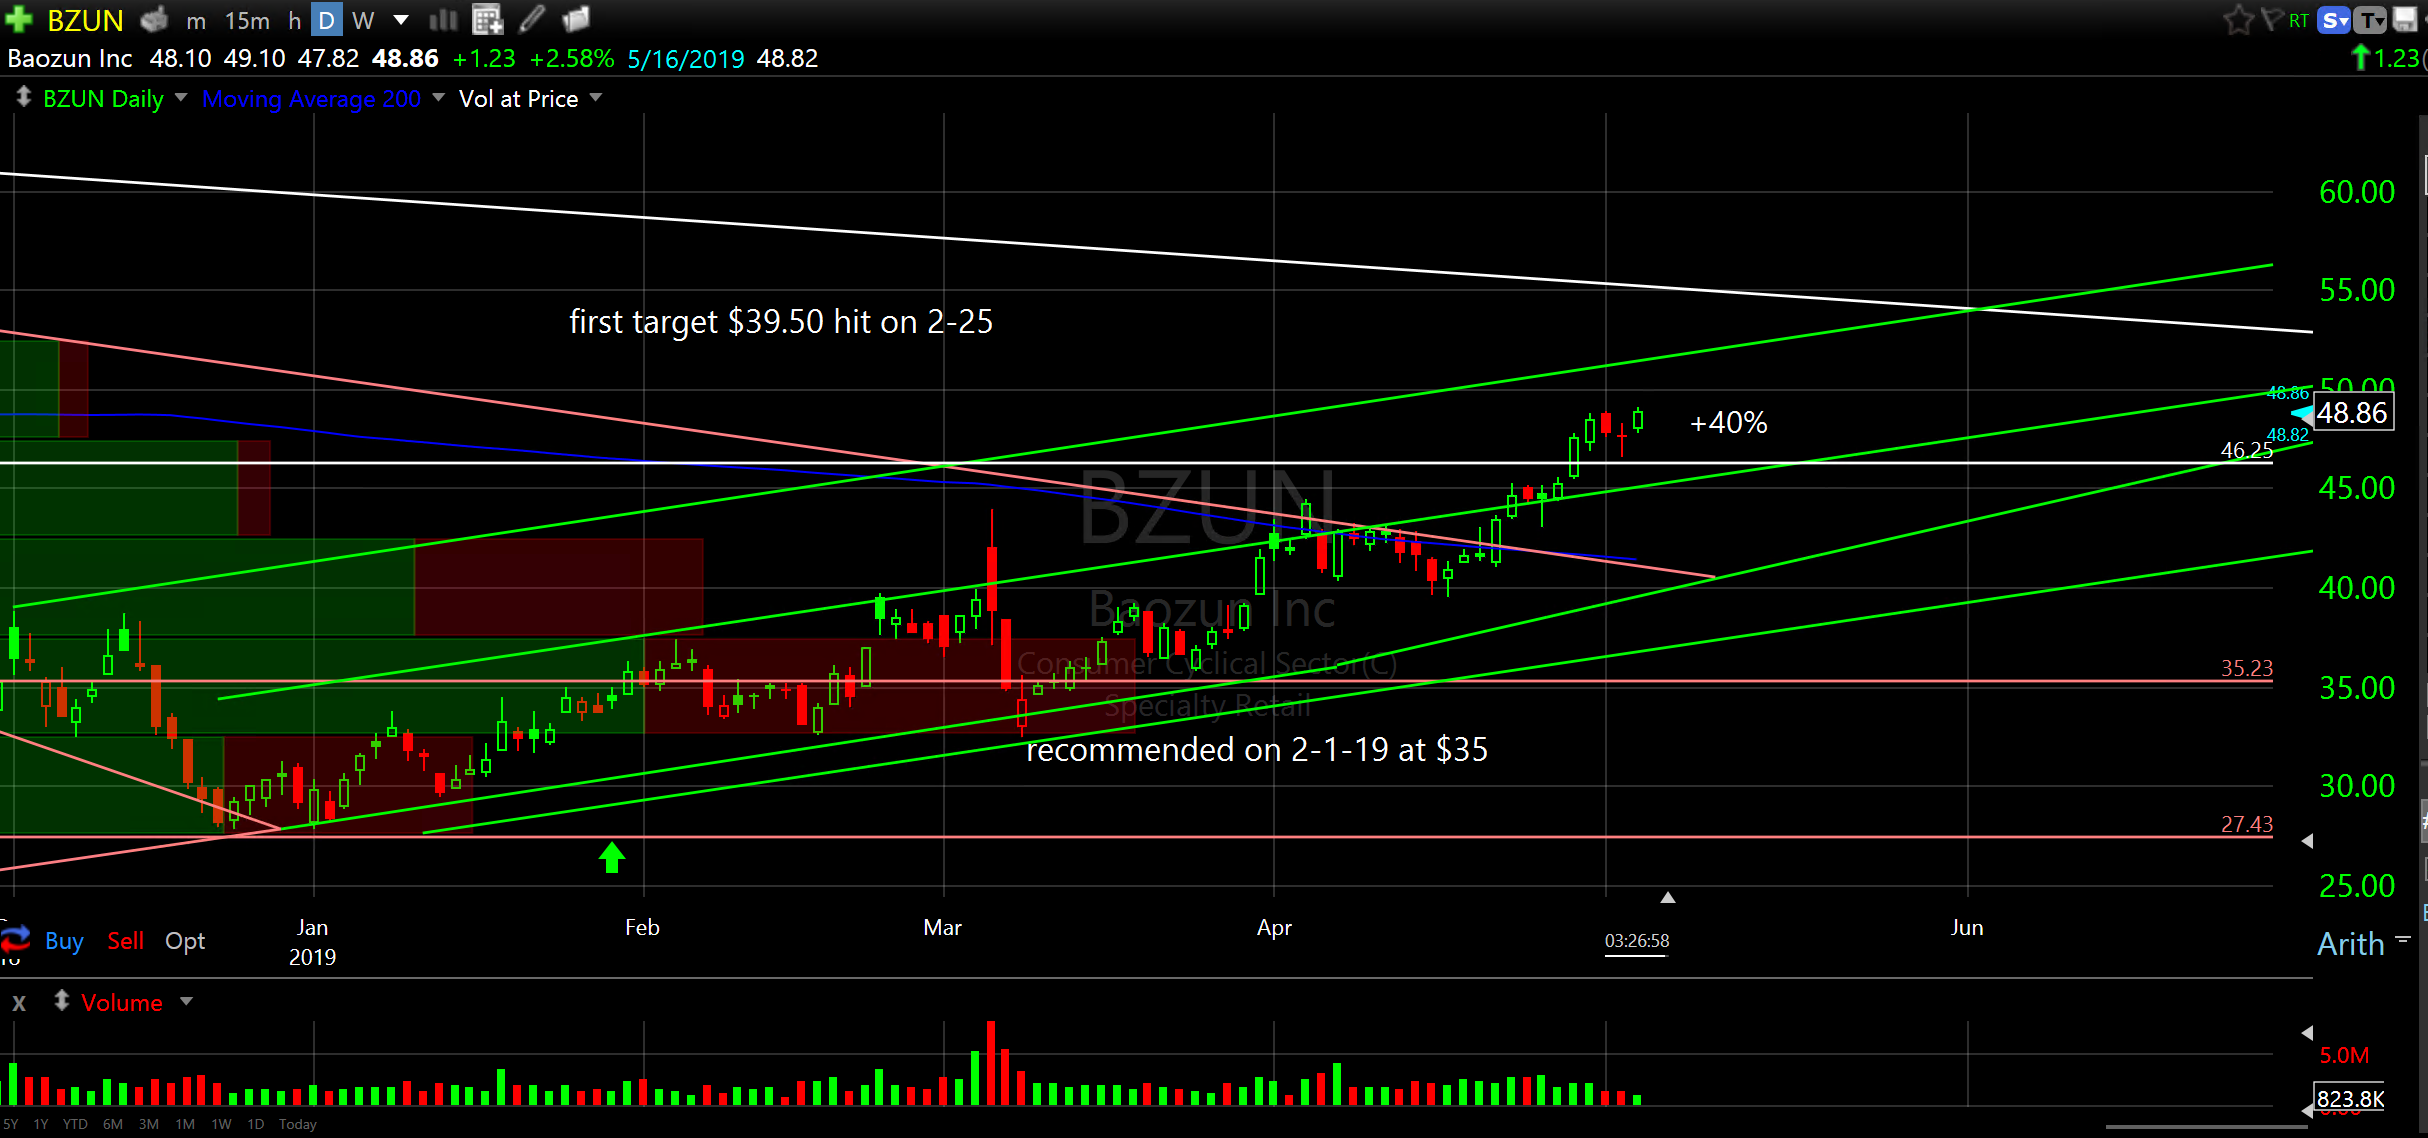
Congrats to all those who bought Baozun Inc (BZUN) when I highlighted it on February 2nd. Up 40% since. You can start trimming now. Resistance is just overhead.
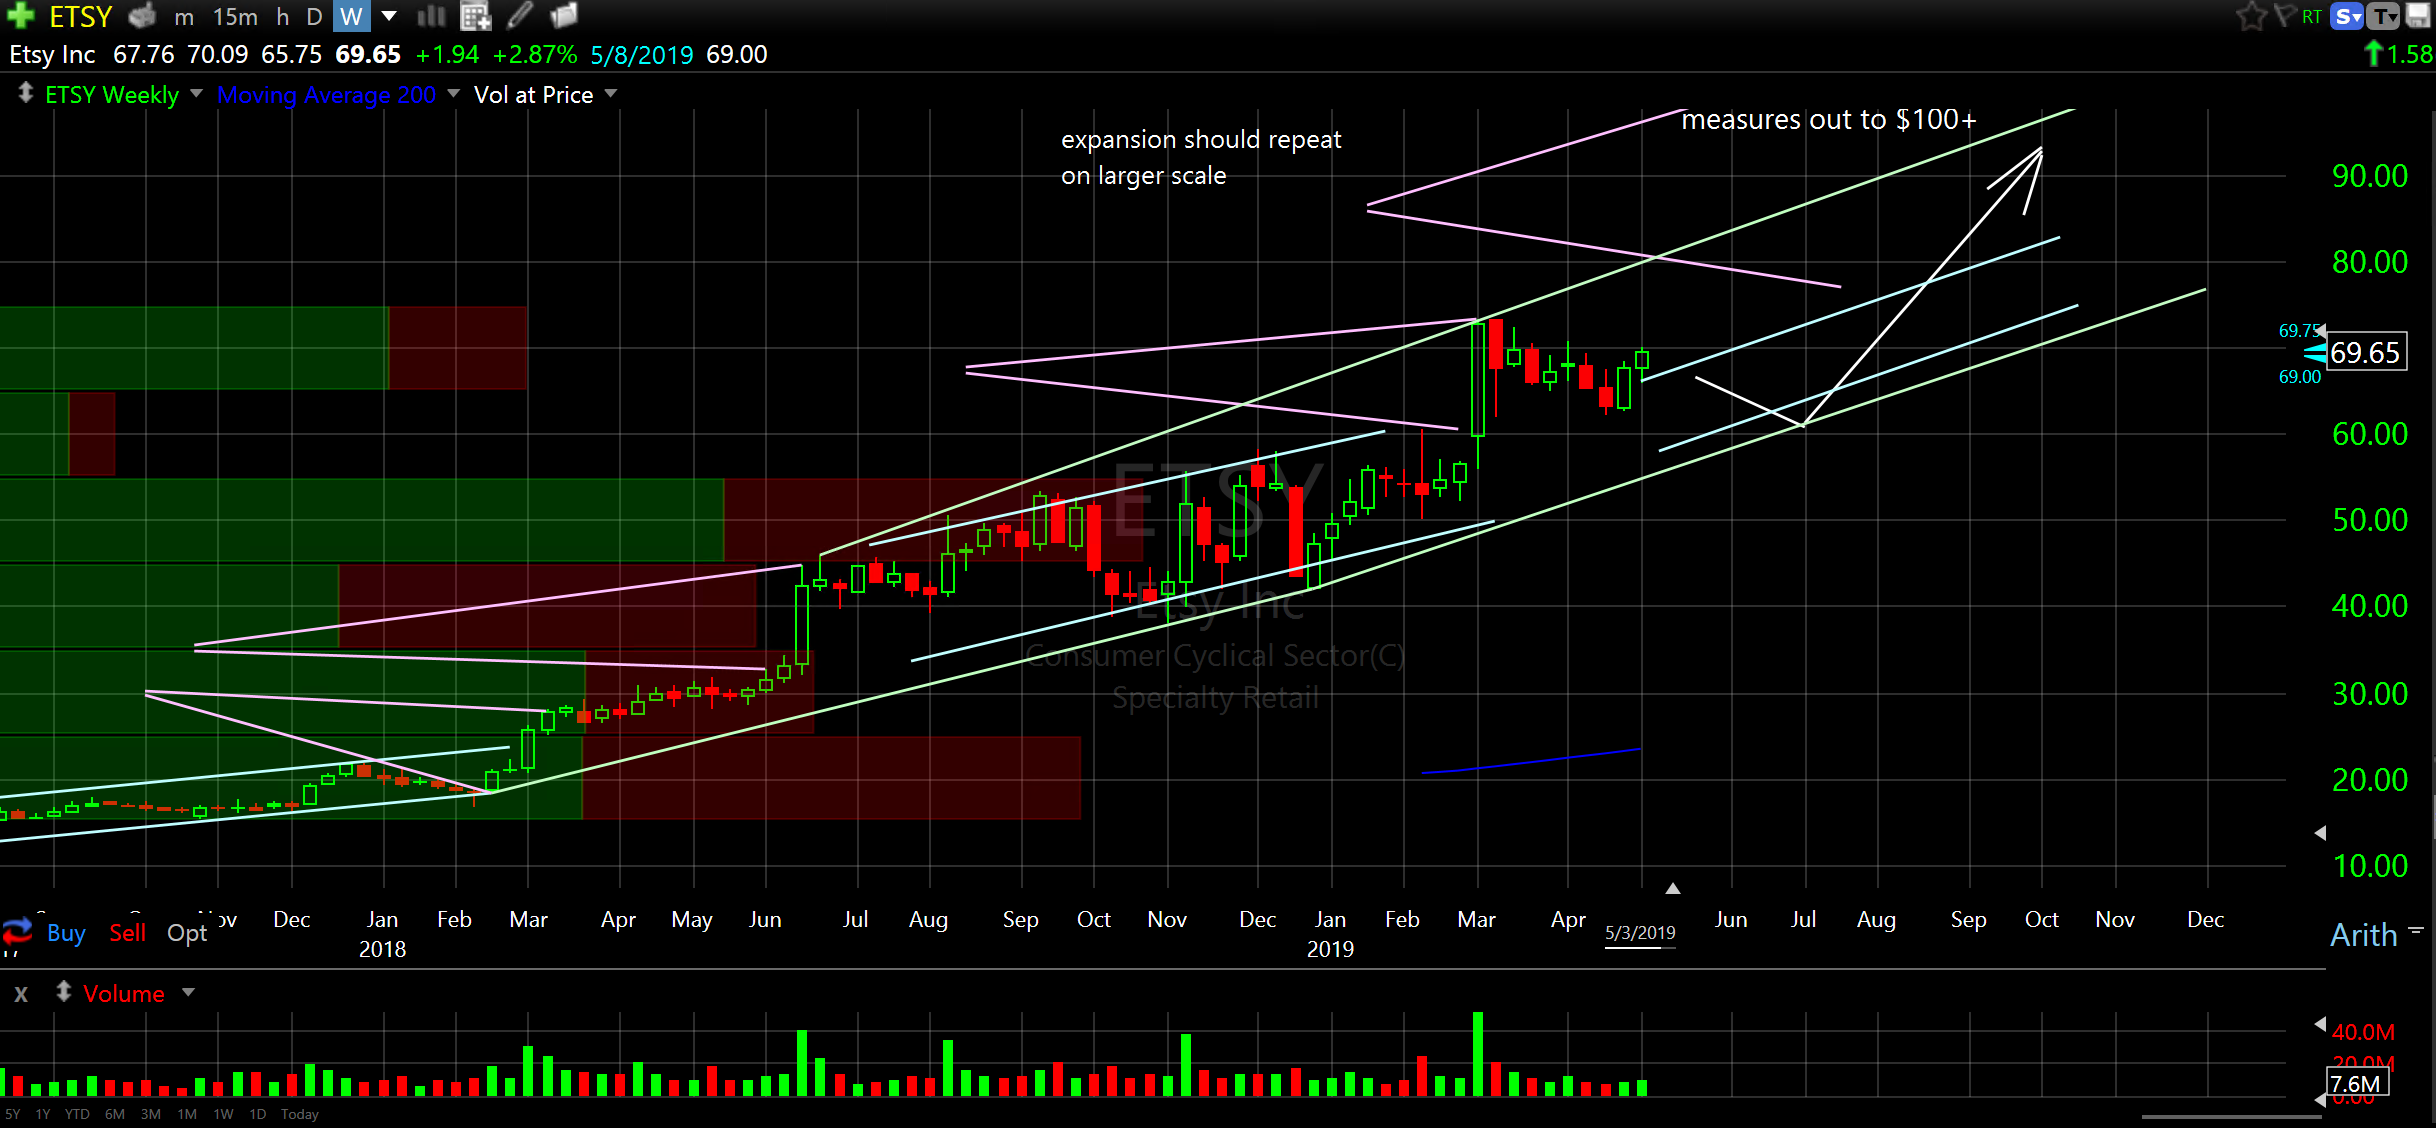
Etsy Inc (ETSY) weekly
stuff arrives at my house all the time from here??
And, to finish it off let’s examine the nasty, dirty Energy Sector ETF (XLE)…there are two XLE charts. The first one is a longer look (weekly) and the second one is a little closer look (daily). Please study both.
Energy Sector ETF (XLE) weekly
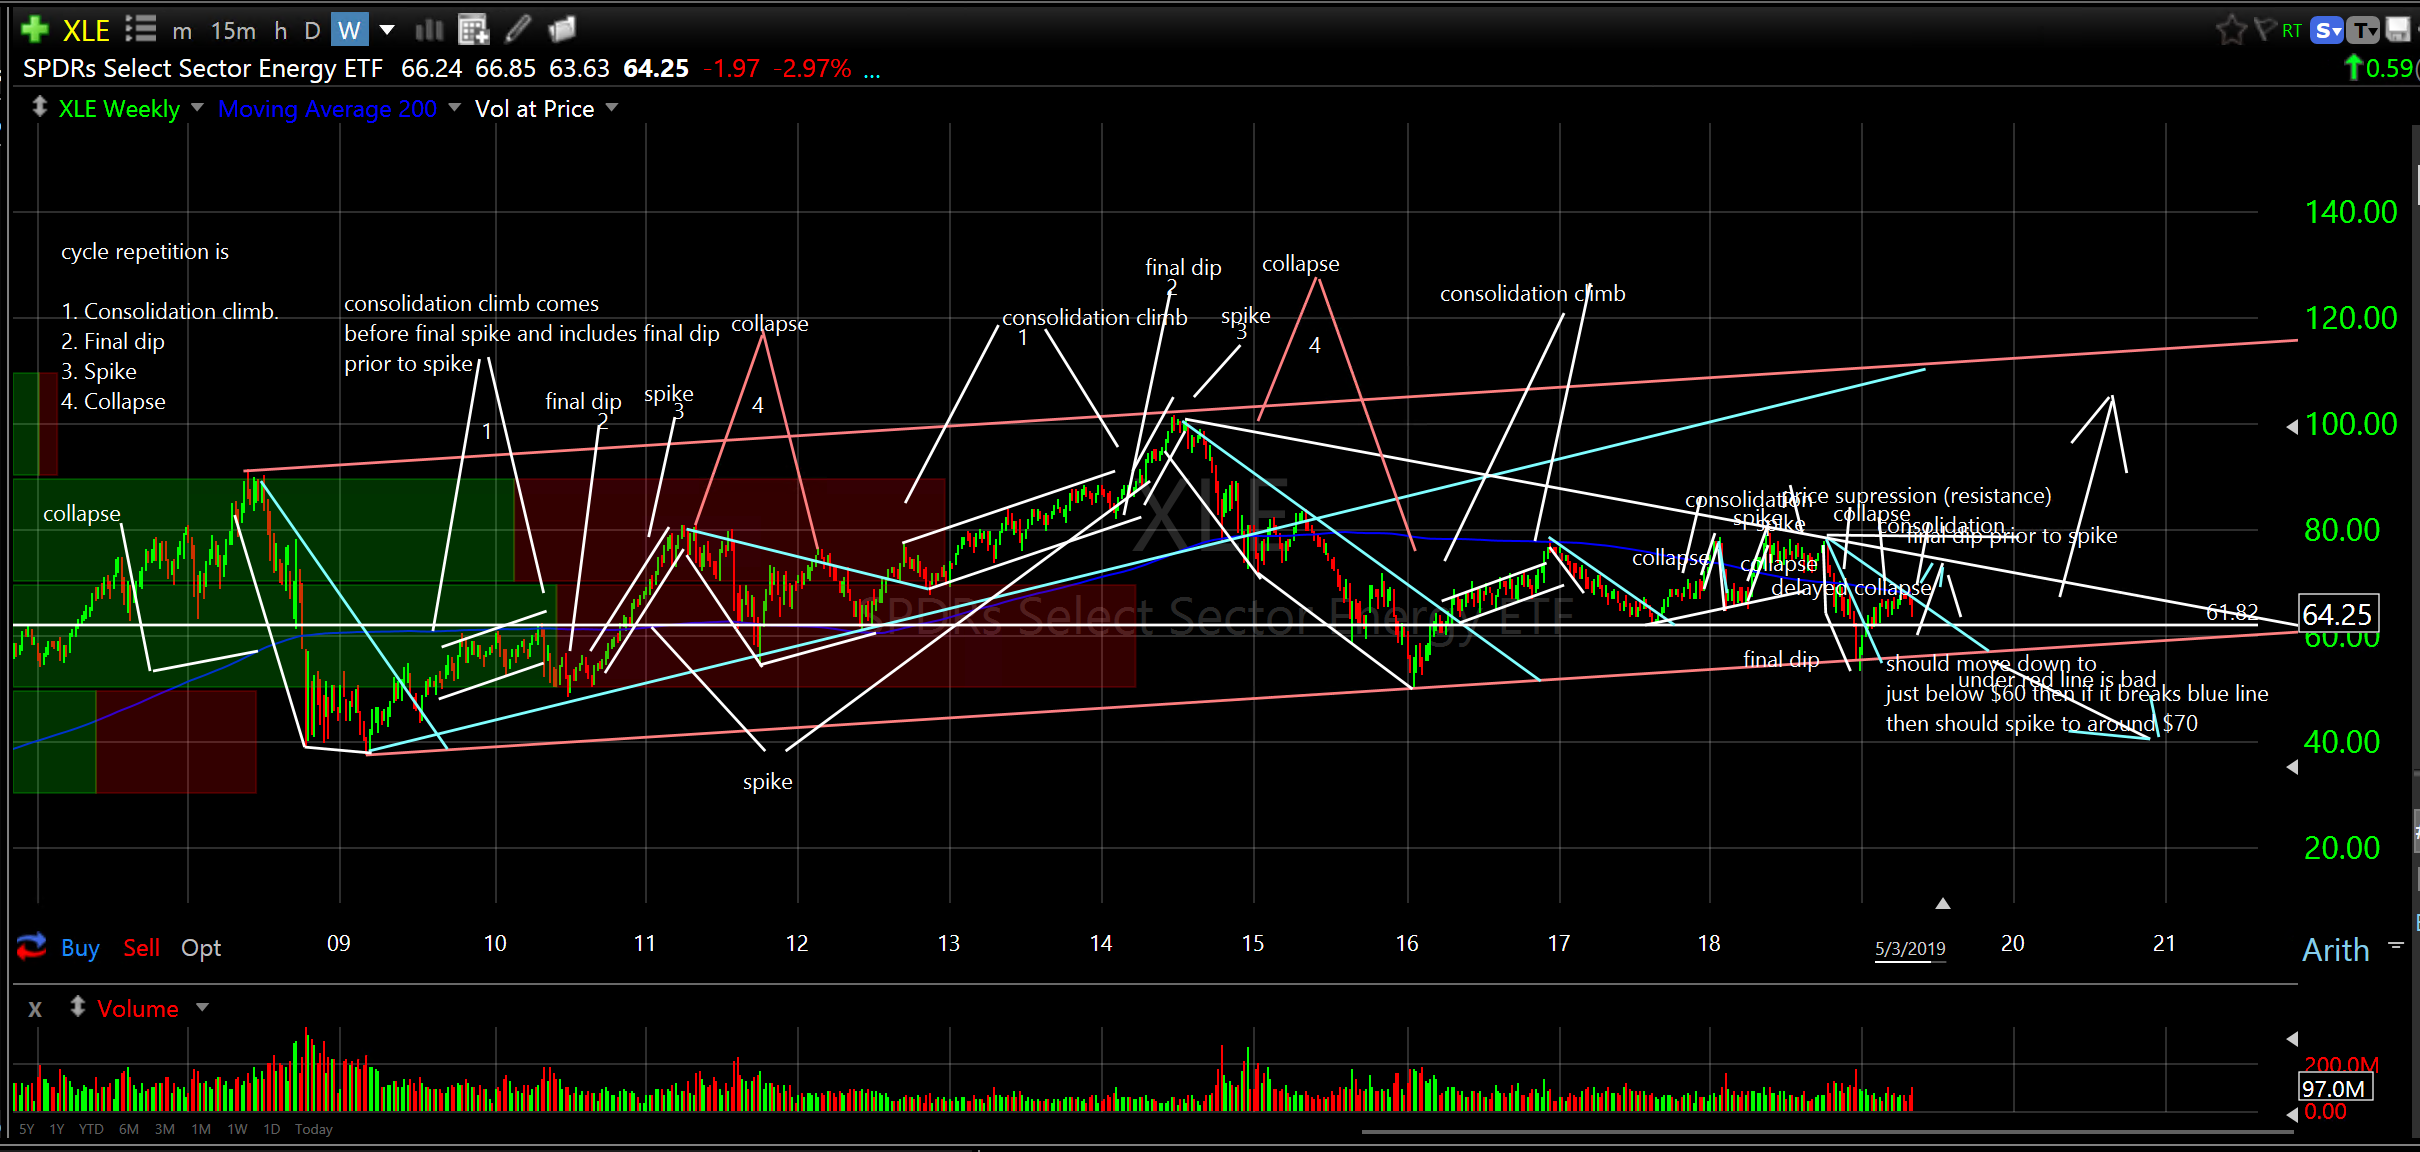
Energy Sector ETF (XLE) daily
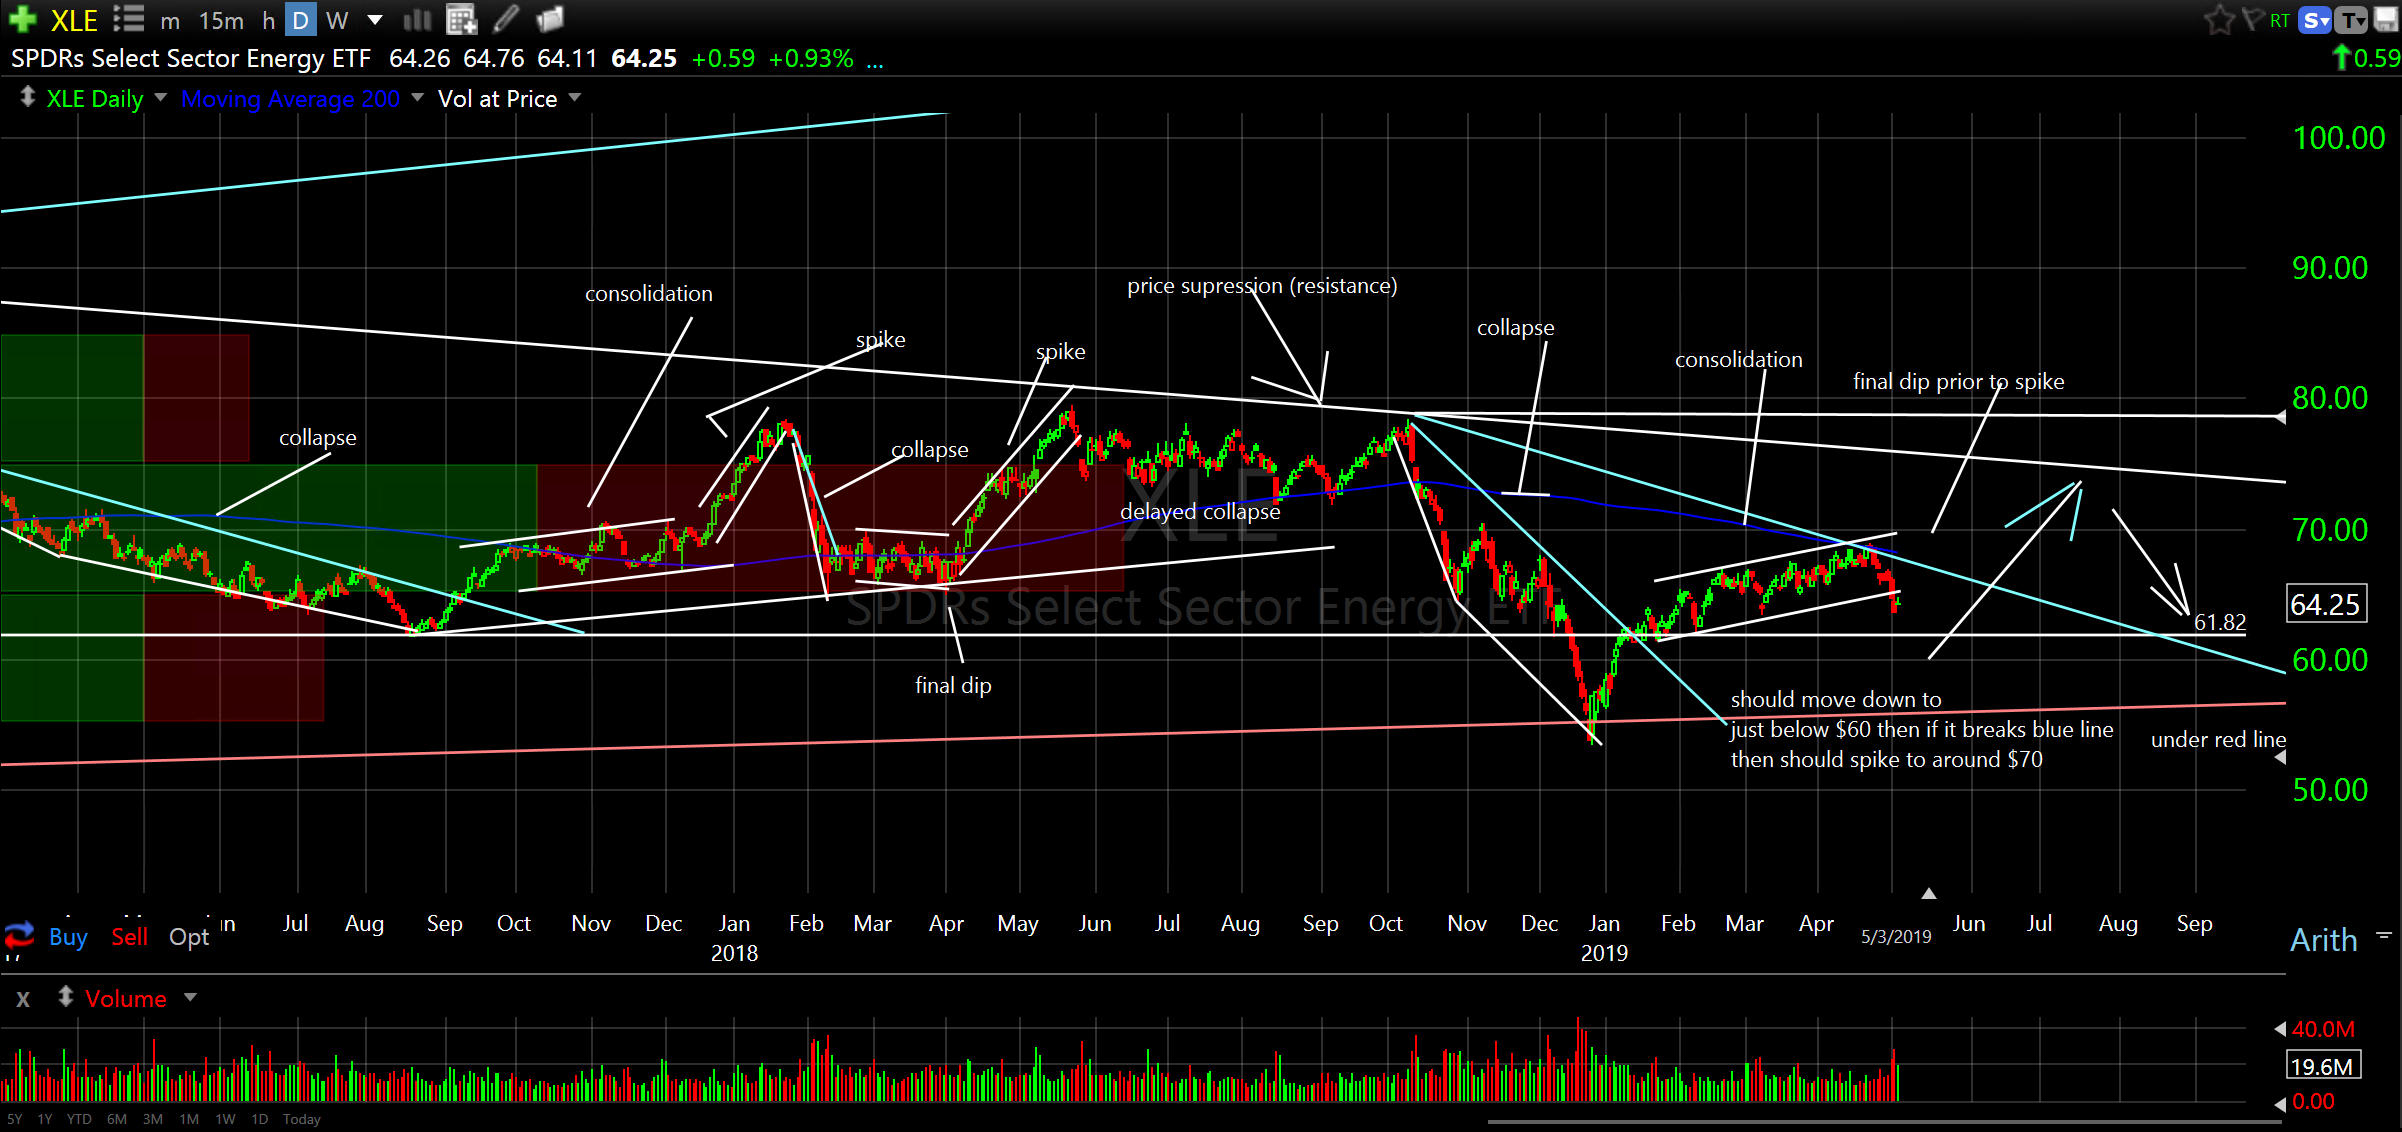
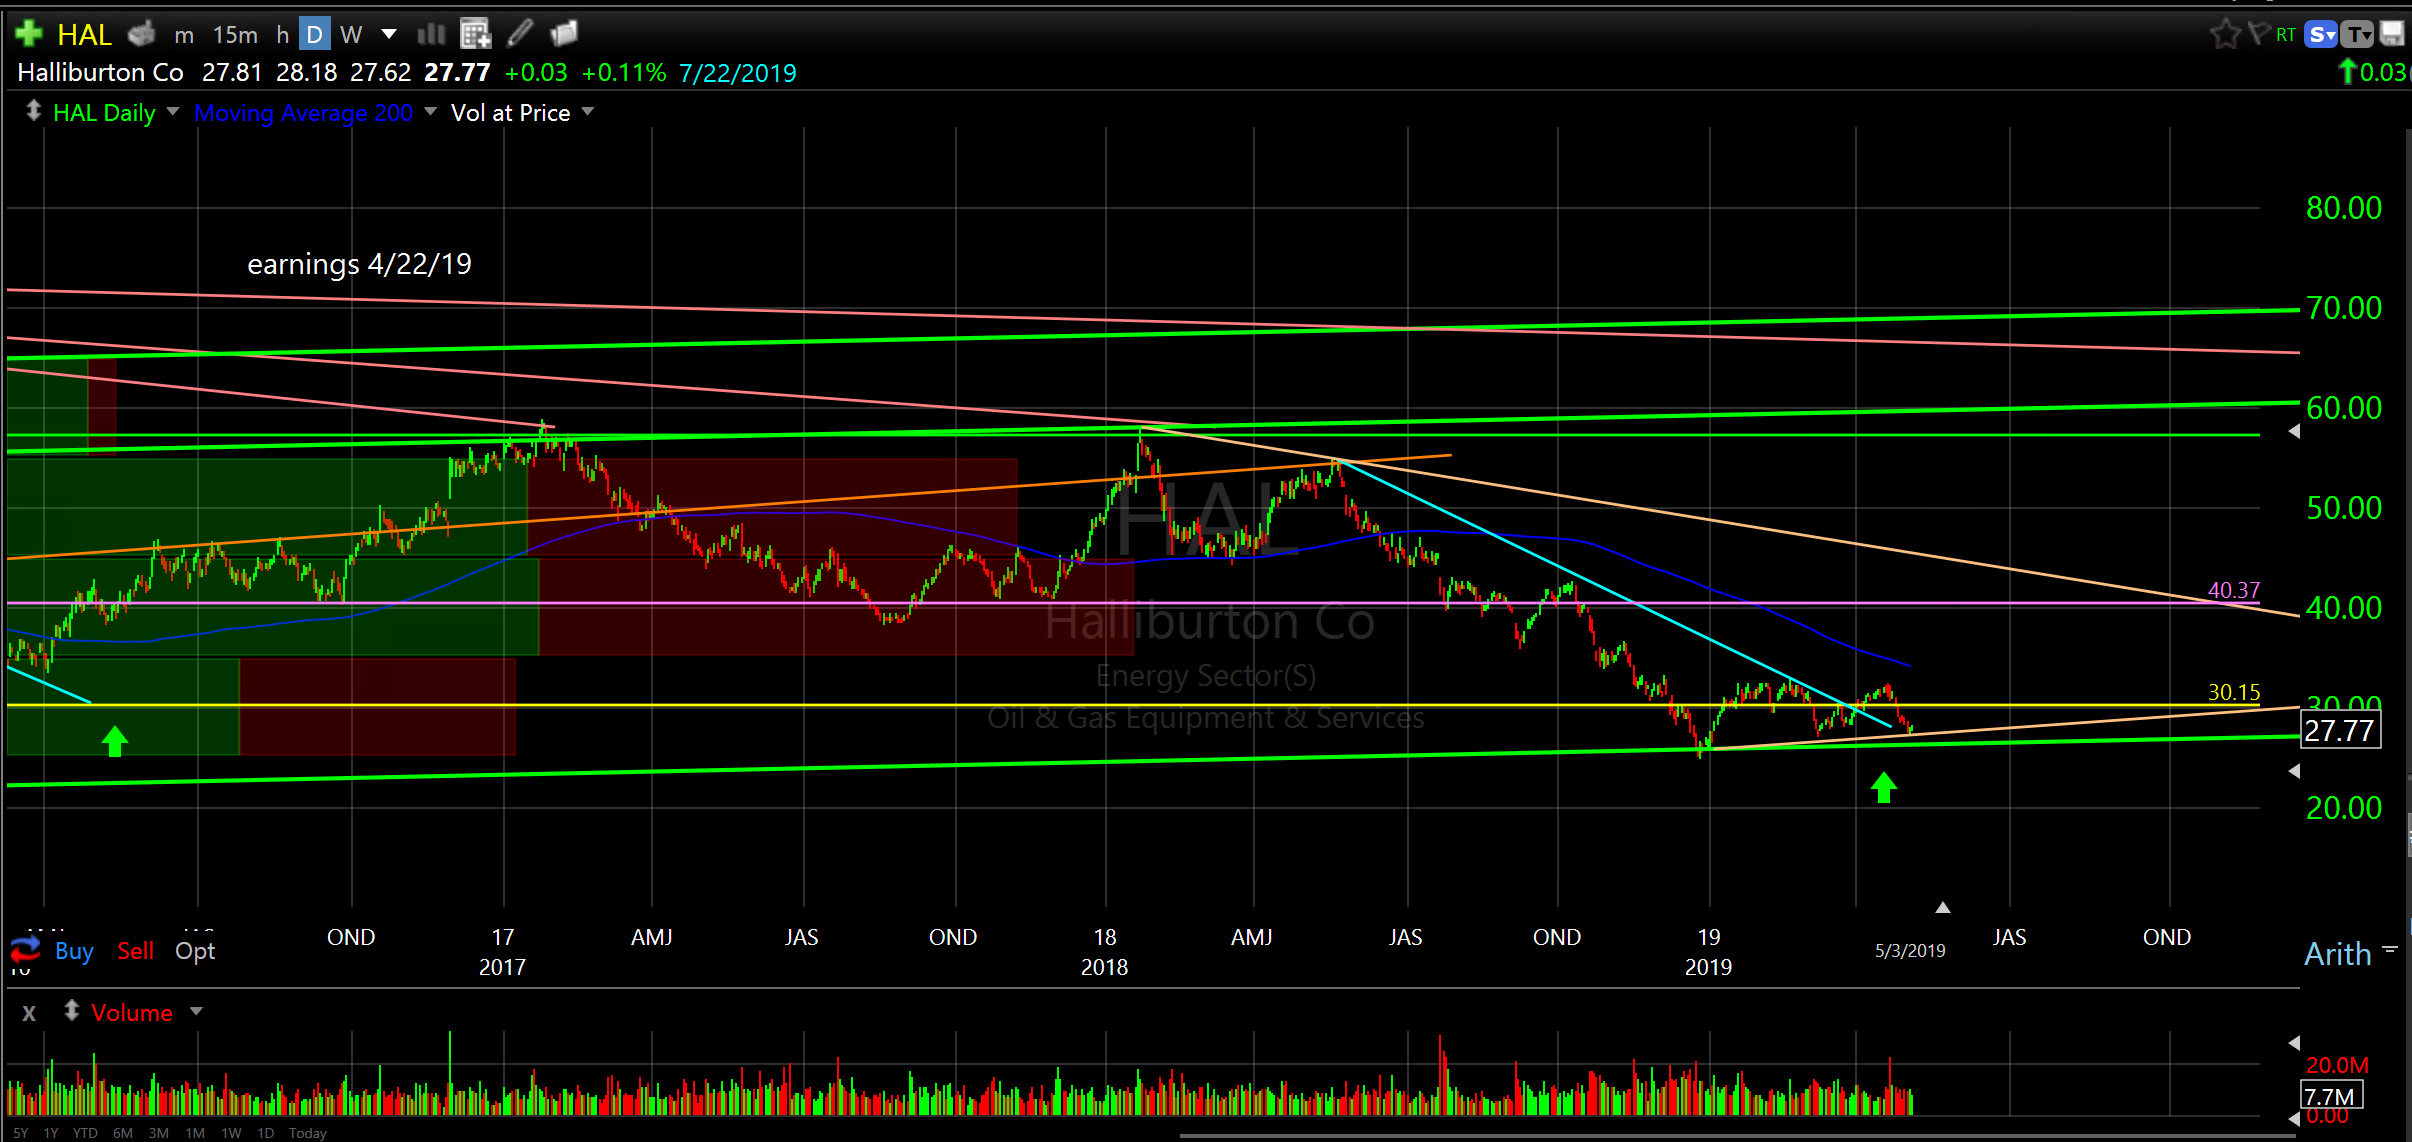
Price has been suppressed since 2015 and is slowly compressing (lows are moving higher and highs are moving lower) inside a wedge building up pressure. Looking out 12 months or so this is likely to make a big move. The longer term base is still rising which leads me to believe the move will be higher directionally. In fact, price has been suppressed so long that it wouldn’t surprise me to see price try and get back to $100. Look at Halliburton (HAL) which I highlighted recently. You can see on the daily chart below that price is trying to reverse (it’s slowly turning upwards) off a base that dates back to 2002, yes, a 17 year base. $100 per barrel oil again? Maybe Tesla (TSLA) will make money after all. Not sure but believe it or not I’ve got my eye on Ford Motor Company (F). More on that another time.
Halliburton (HAL) daily
No worries if you have any questions. I would be happy to respond.
You do know that I could send you charts every day but if you are like me I hate getting stuff from someone every day. I am trying to balance timely, digestible, useable information that you look forward to getting and that can actually help you. I am showing you everything I know so you can dump me once you know how to do it and go on and do it on your own. That was my original goal and still is. Now I know you probably don’t want to spend the time (hours and hours and hours of charting) doing what I do but please know I want you to know how I do it…it will give you even greater confidence…just start with a long term chart and keep going deeper; weekly, daily, hourly, 15 min, one minute…dig deep. You will find the repetition. It will amaze you…at least it should. What still amazes me is people who still don’t understand the value of charting. Me thinks they don’t know what they don’t know. Too bad for them really.
No secret sauce. Just lines on a chart.
OK, that’s enough. Sorry, got a little wordy this time.
Remember, I am happy to answer any questions you might have.
Oh, one more thing…repeating cycles can and often have the same time element associated with the various phases inside a cycle. OK..enough.
I dream in charts,
Don
PS. Do your homework and due diligence. Study the charts and understand your risk. Go forth and profit.
PSS. Dow futures are down 300+. Could be a bumpy week. Still love China.