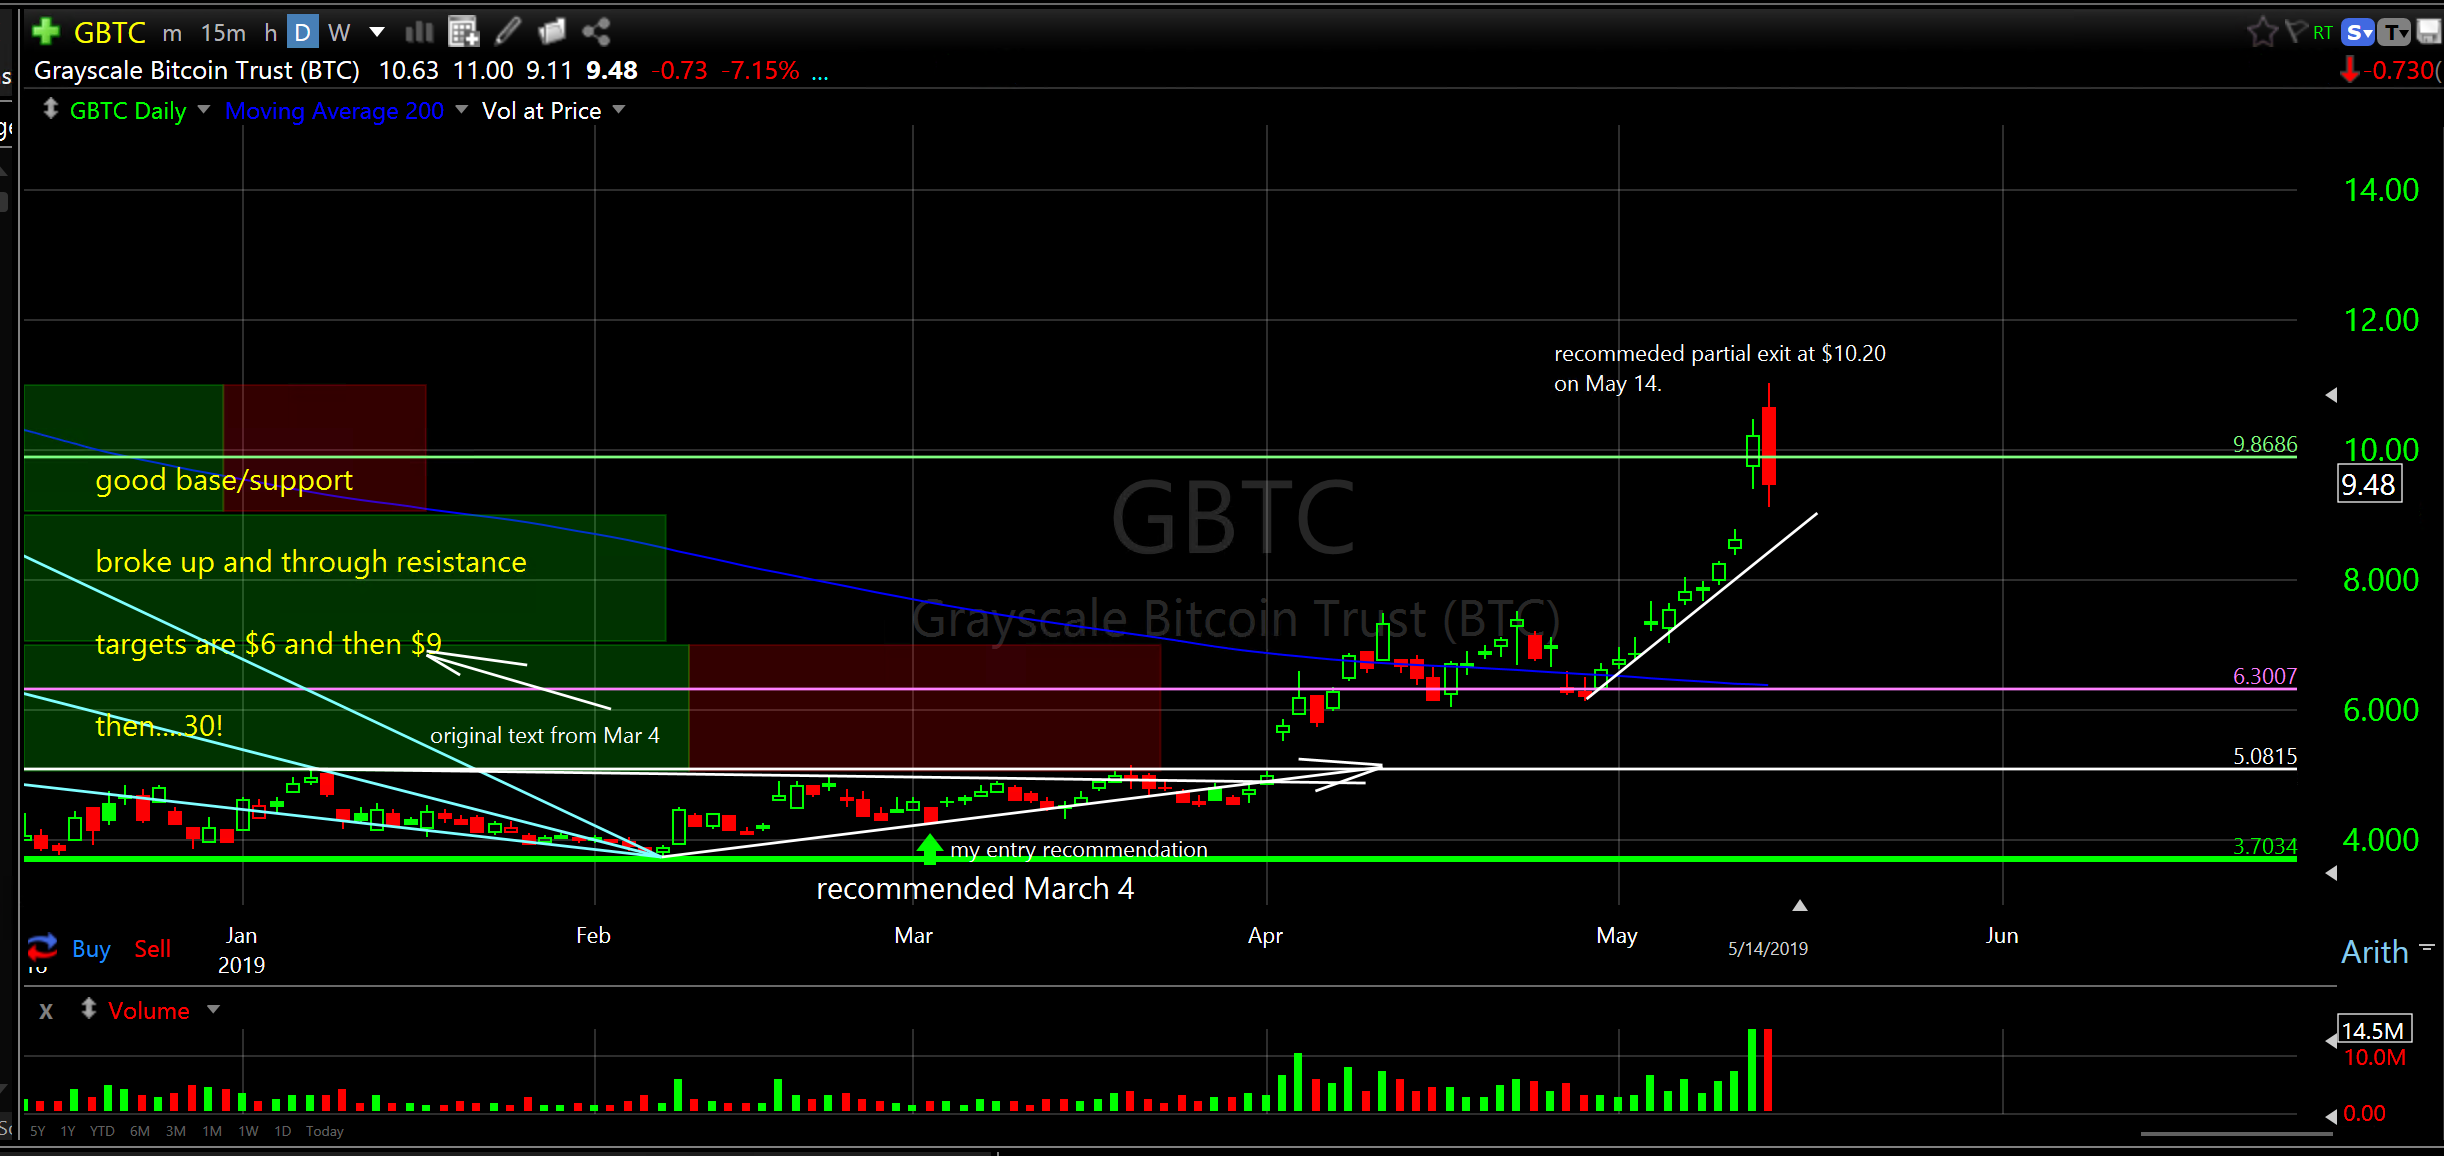
Congrats to those who dismissed the fear and bought GBTC. More than a double so far with partial profits today. I want to keep a position for tagging all time highs but may trade it down and trade it up. See GBTC chart below.
Grayscale Bitcoin Trust (GBTC) daily
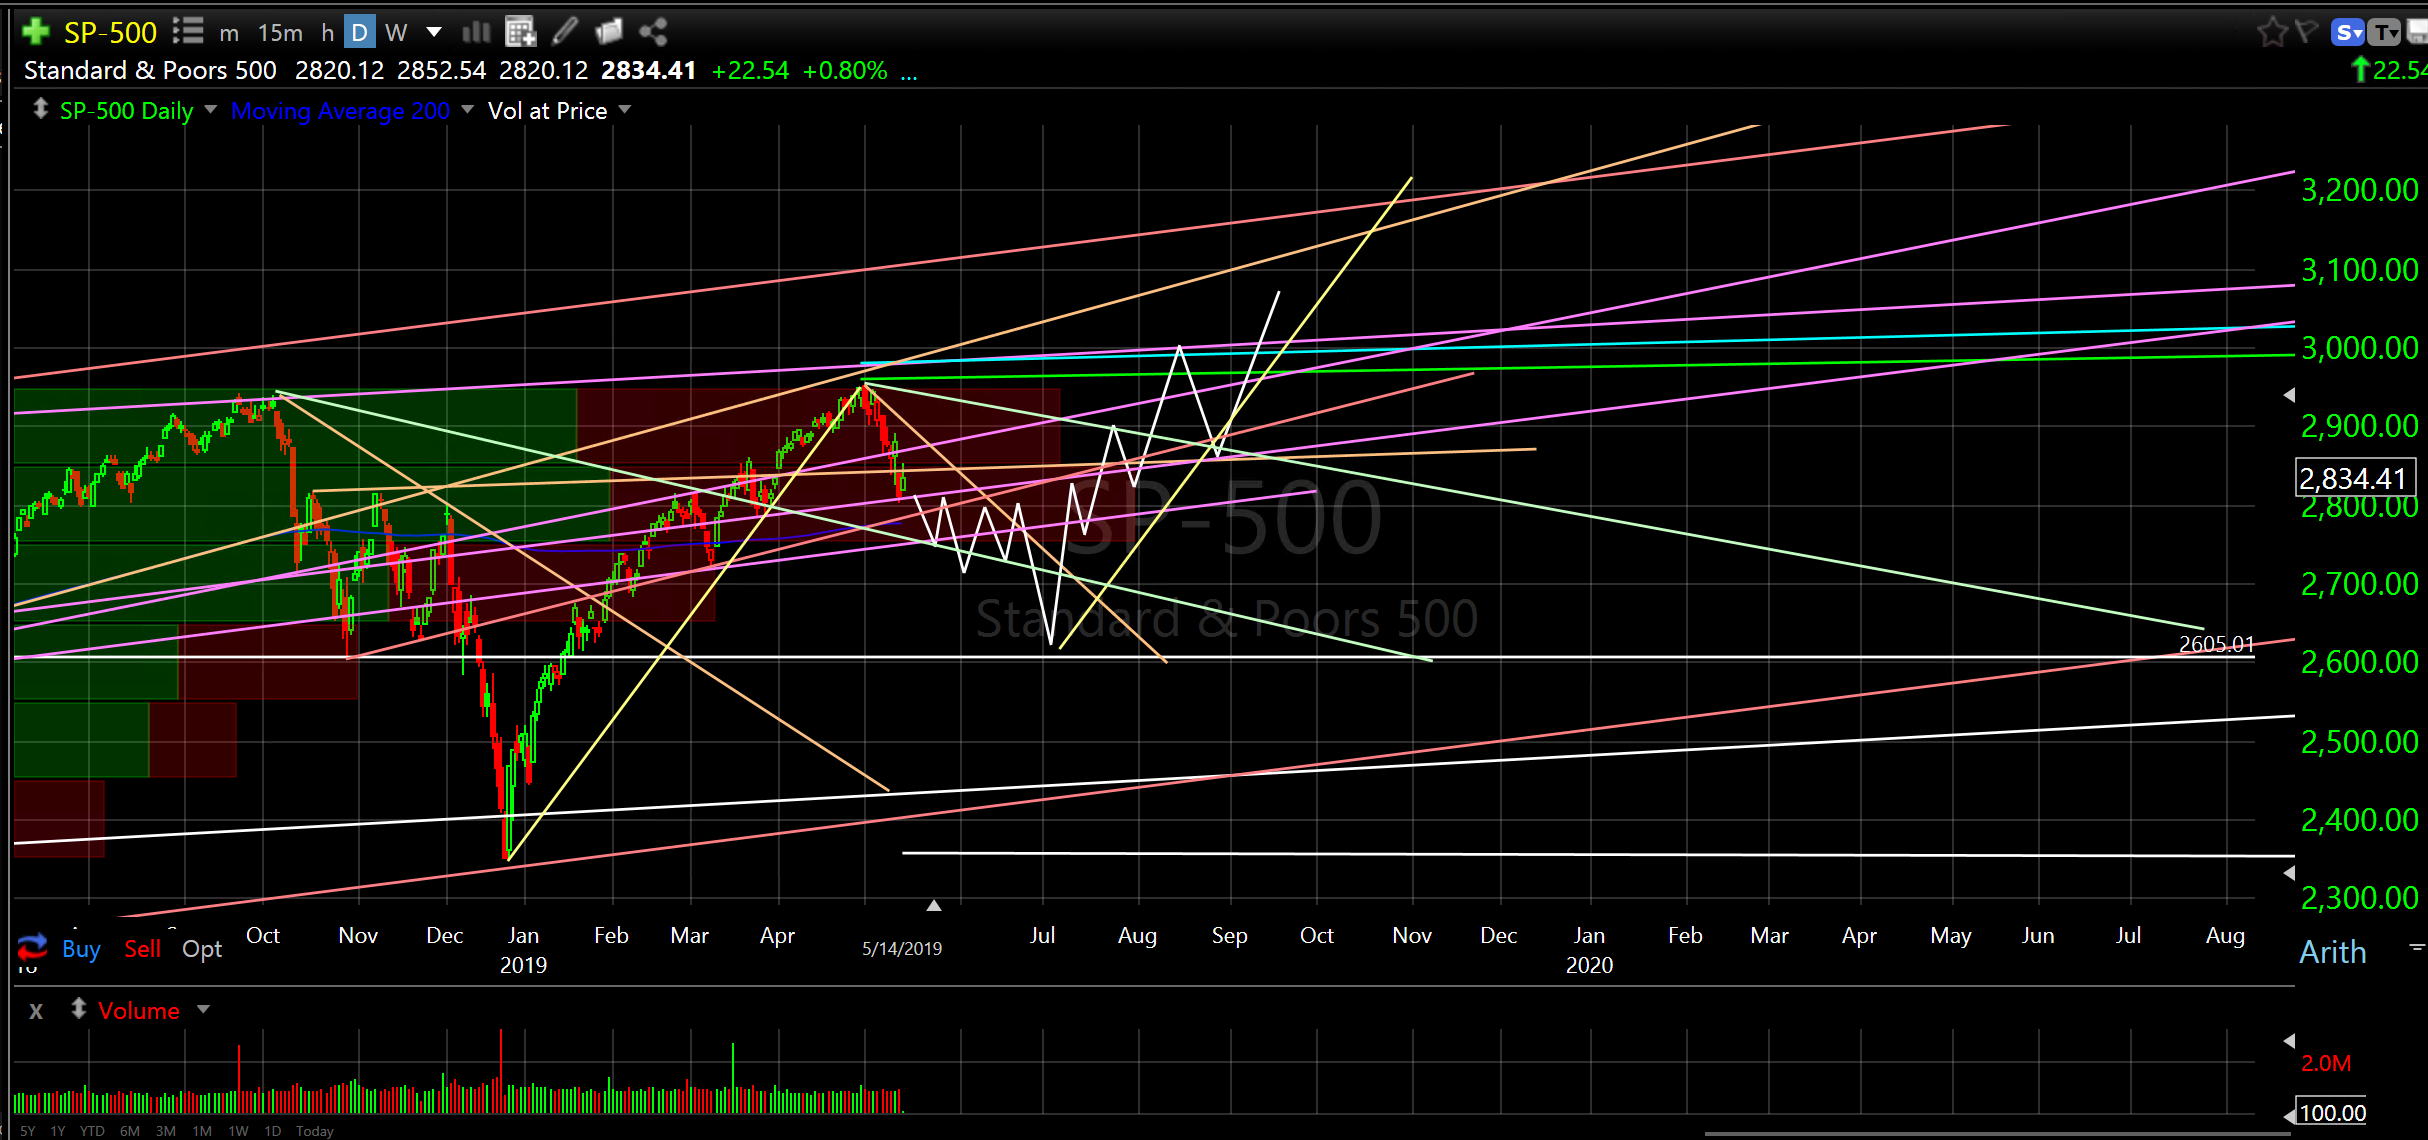
Also, see chart below of S&P 500 Index (SPX). Just lines on a chart but they give me comfort and help me with risk management, profit taking, adding positions, subtracting positions and generally maneuvering/nudging risk/reward. Without the lines I would just feel lost.
S&P 500 Index (SPX) daily
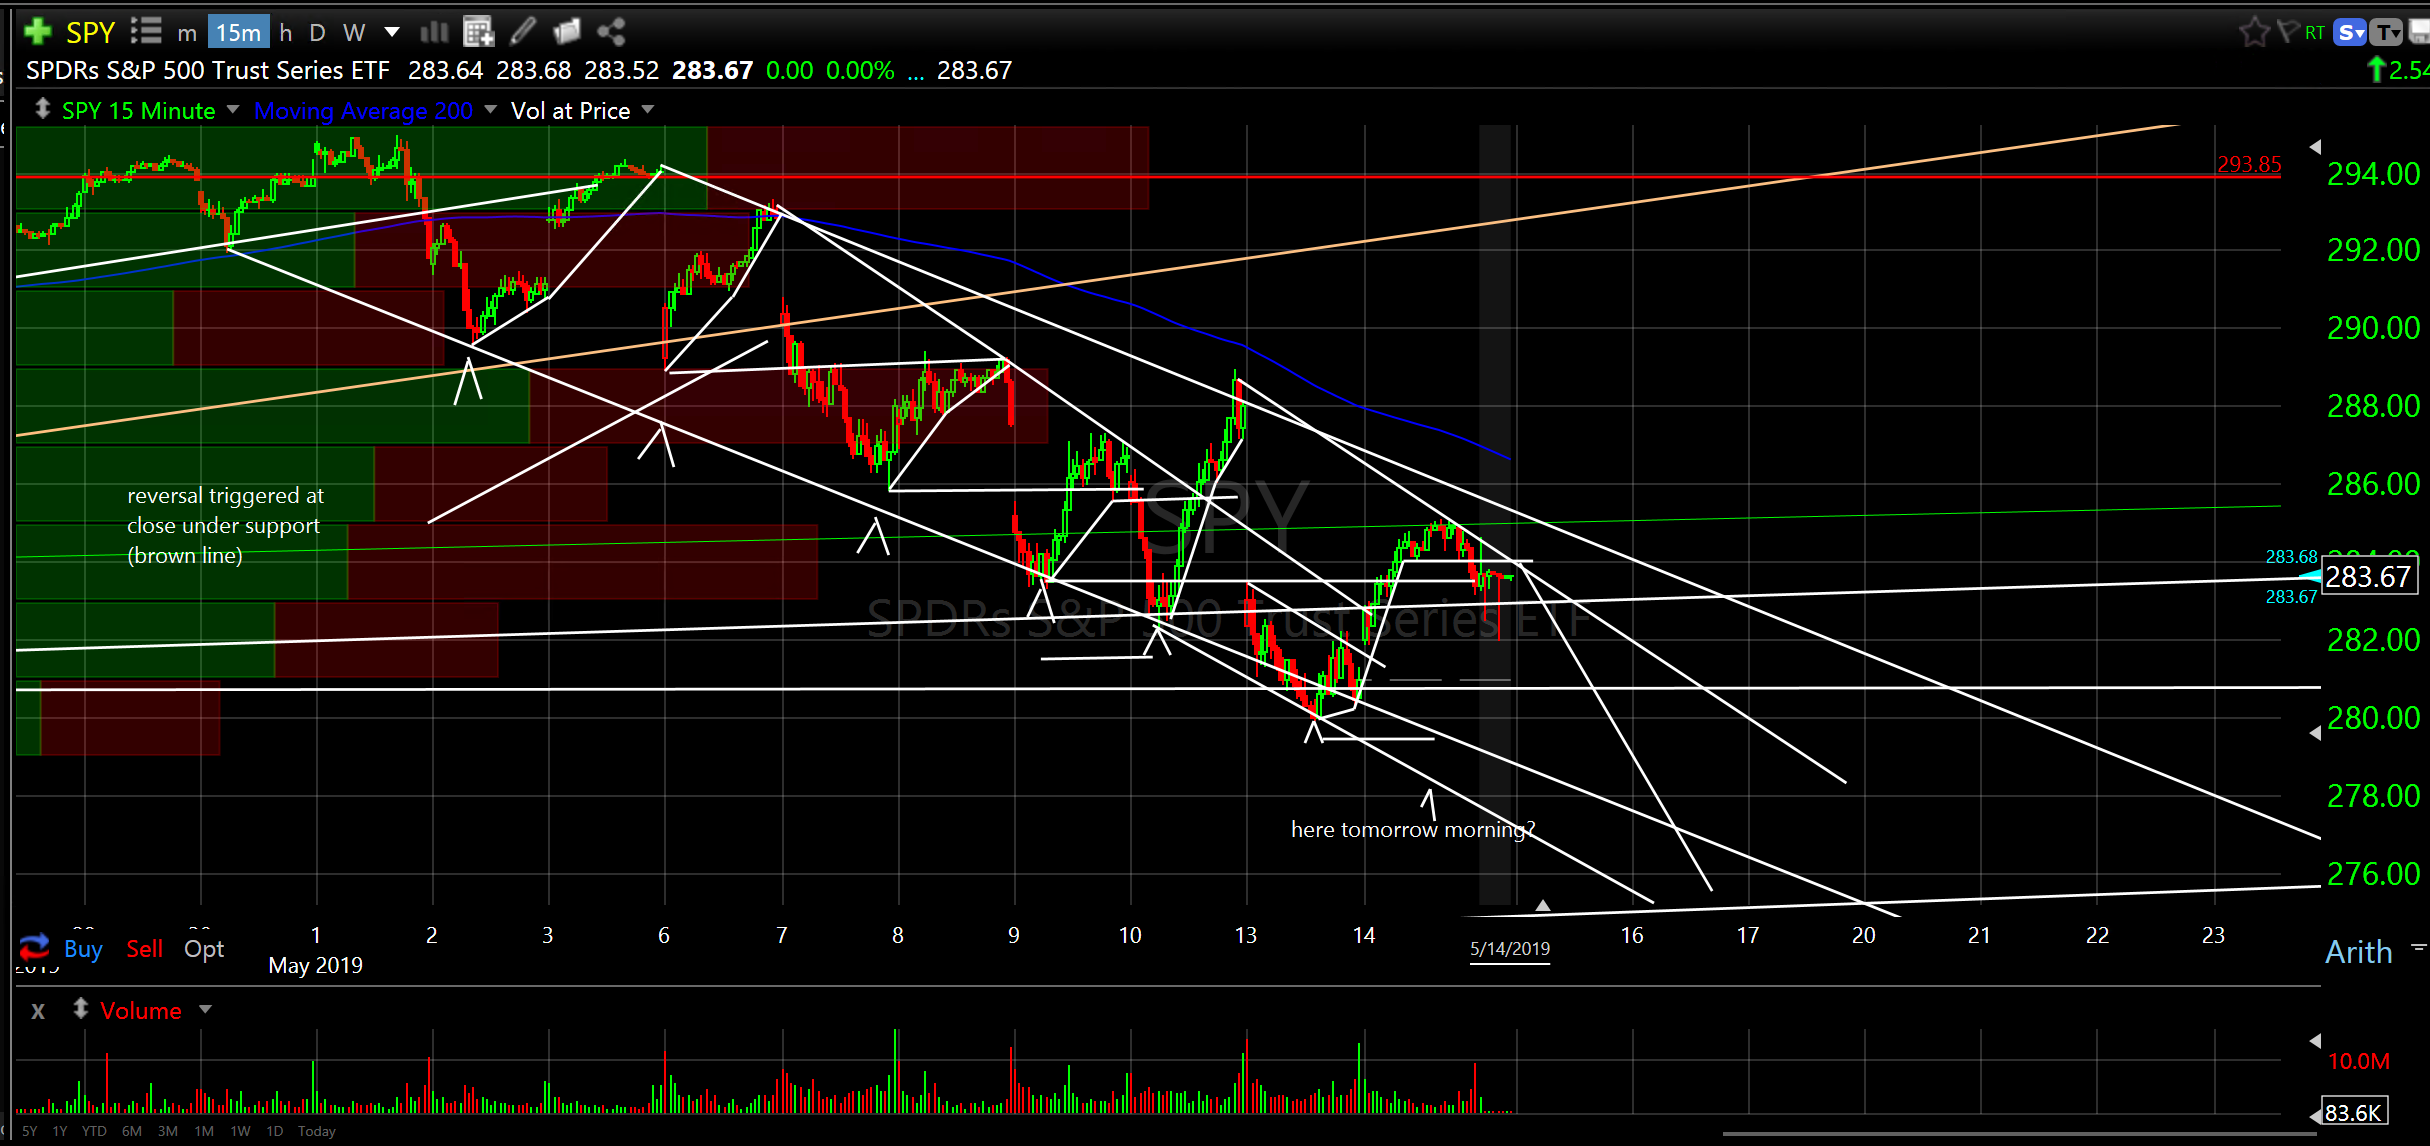
Also, see 15 min chart of SPY. Going deeper (SPY 270ish) if it can’t bust up through higher resistance sooner. Longer term still looks great out to late 2020 though.
S&P 500 Index (SPX) 15-minute
Sorry to send so many emails but I want to keep you up to date in the current environment.
I’m happy to answer any questions as well.
Have a good evening,
Don