As I’m traveling tomorrow and have a busy weekend with family in San Diego, here are some charts I have been looking at this week.
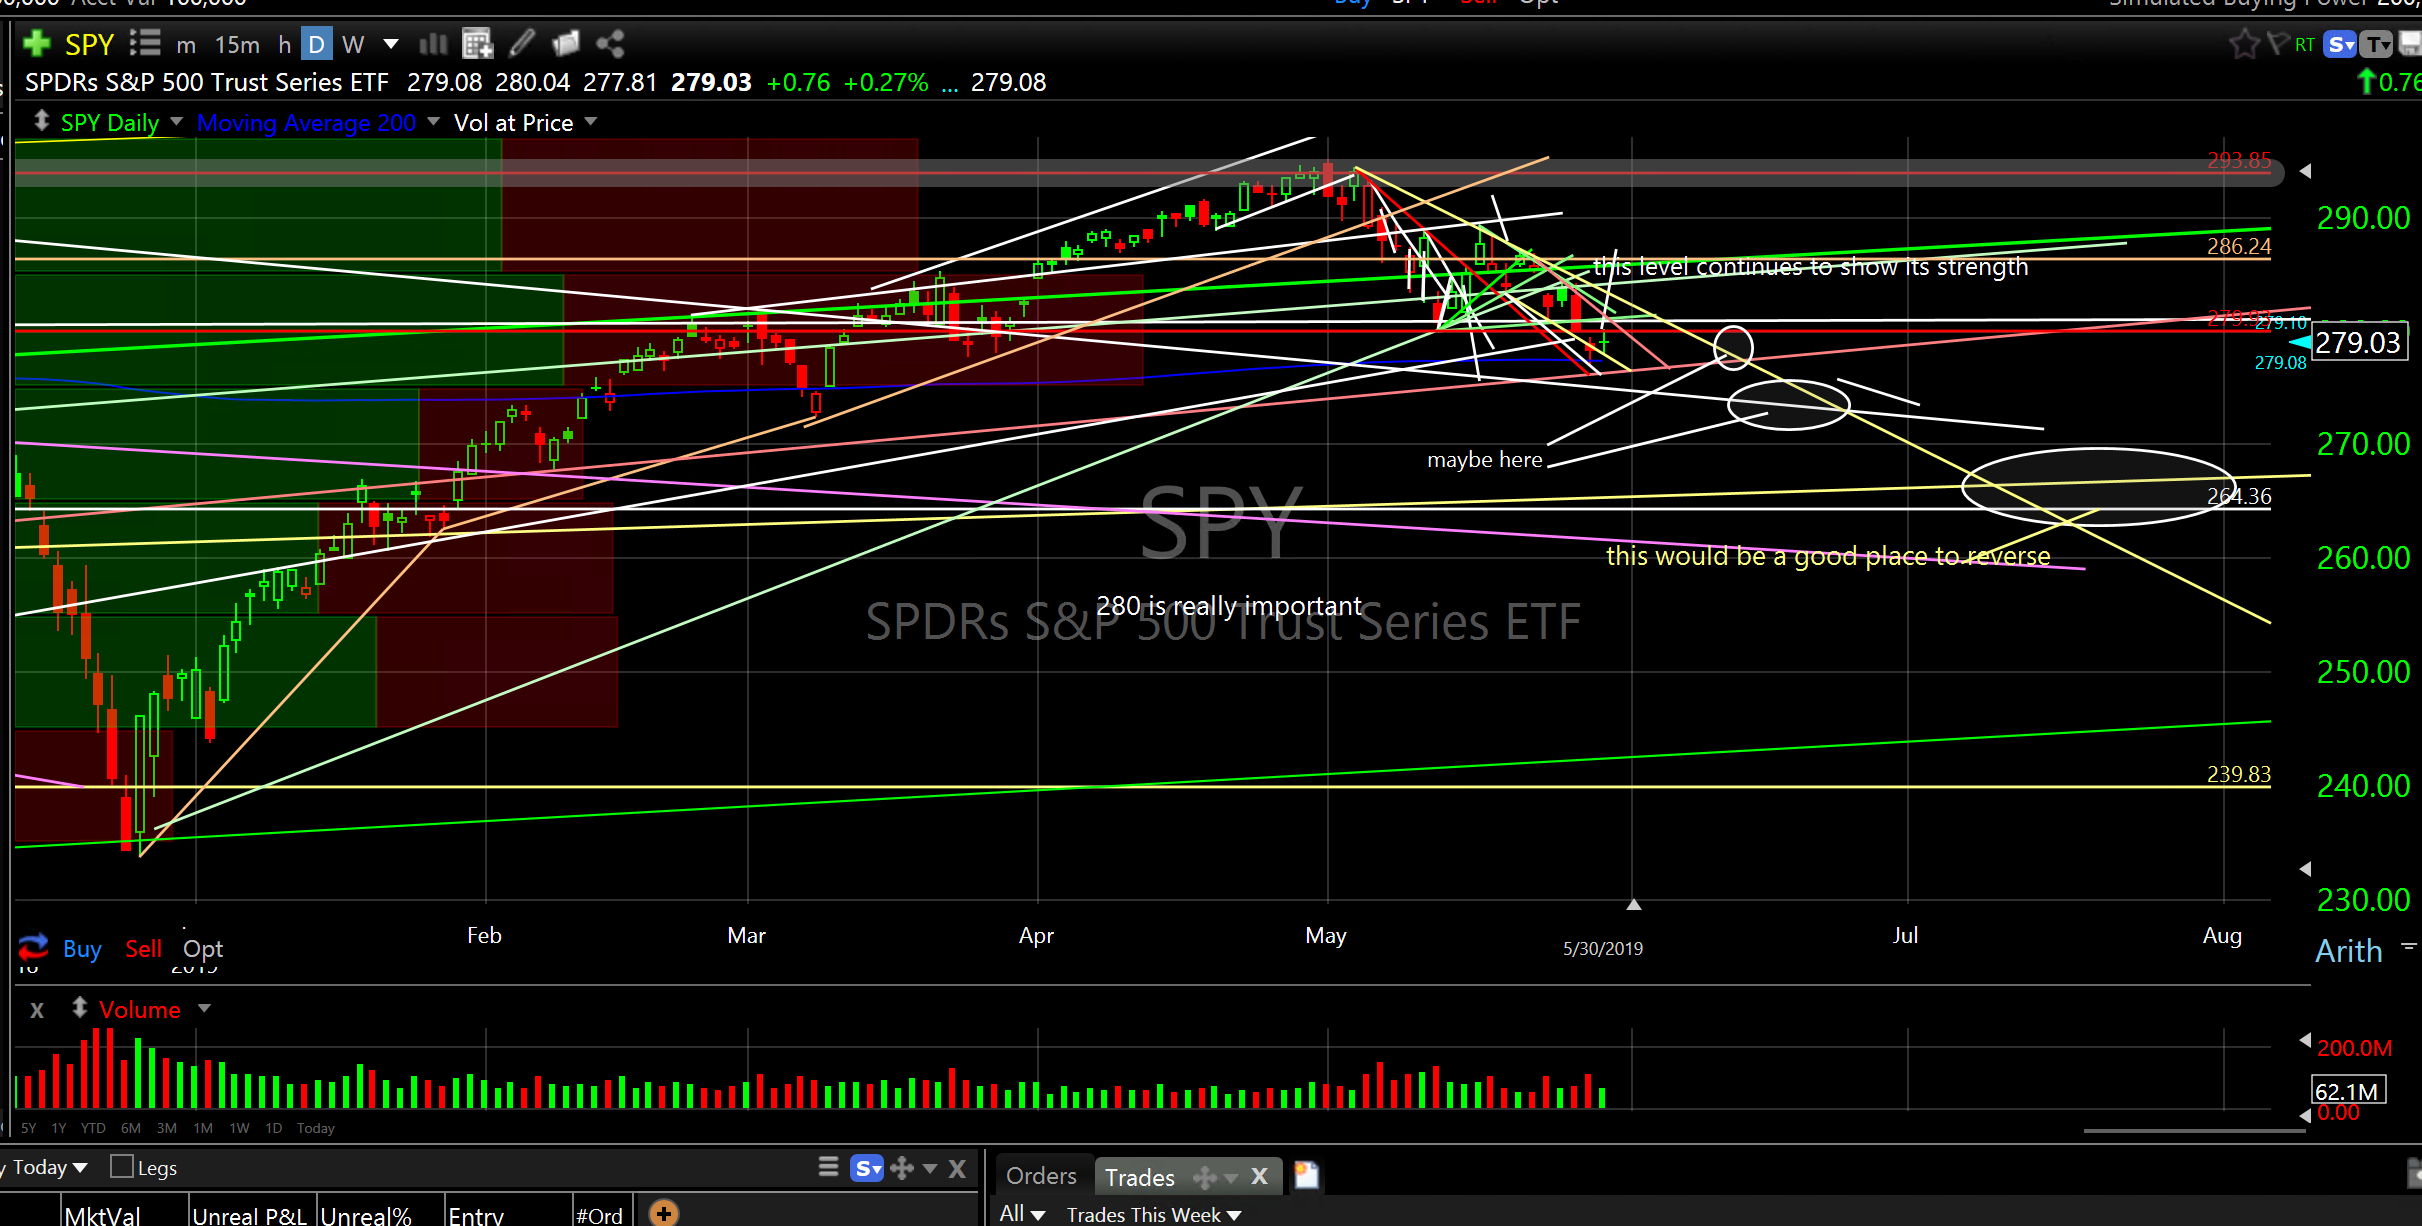
Also, I was asked last night if we are in the dip I have been discussing for the past many weeks…yes, we be in that dip now. See SPY chart for potential reversal zones I circled.
And, congrats to those who bought GBTC, the ETF that tracks bitcoin. +180% on partial sale today. It has provided a nice hedge in recent weeks.
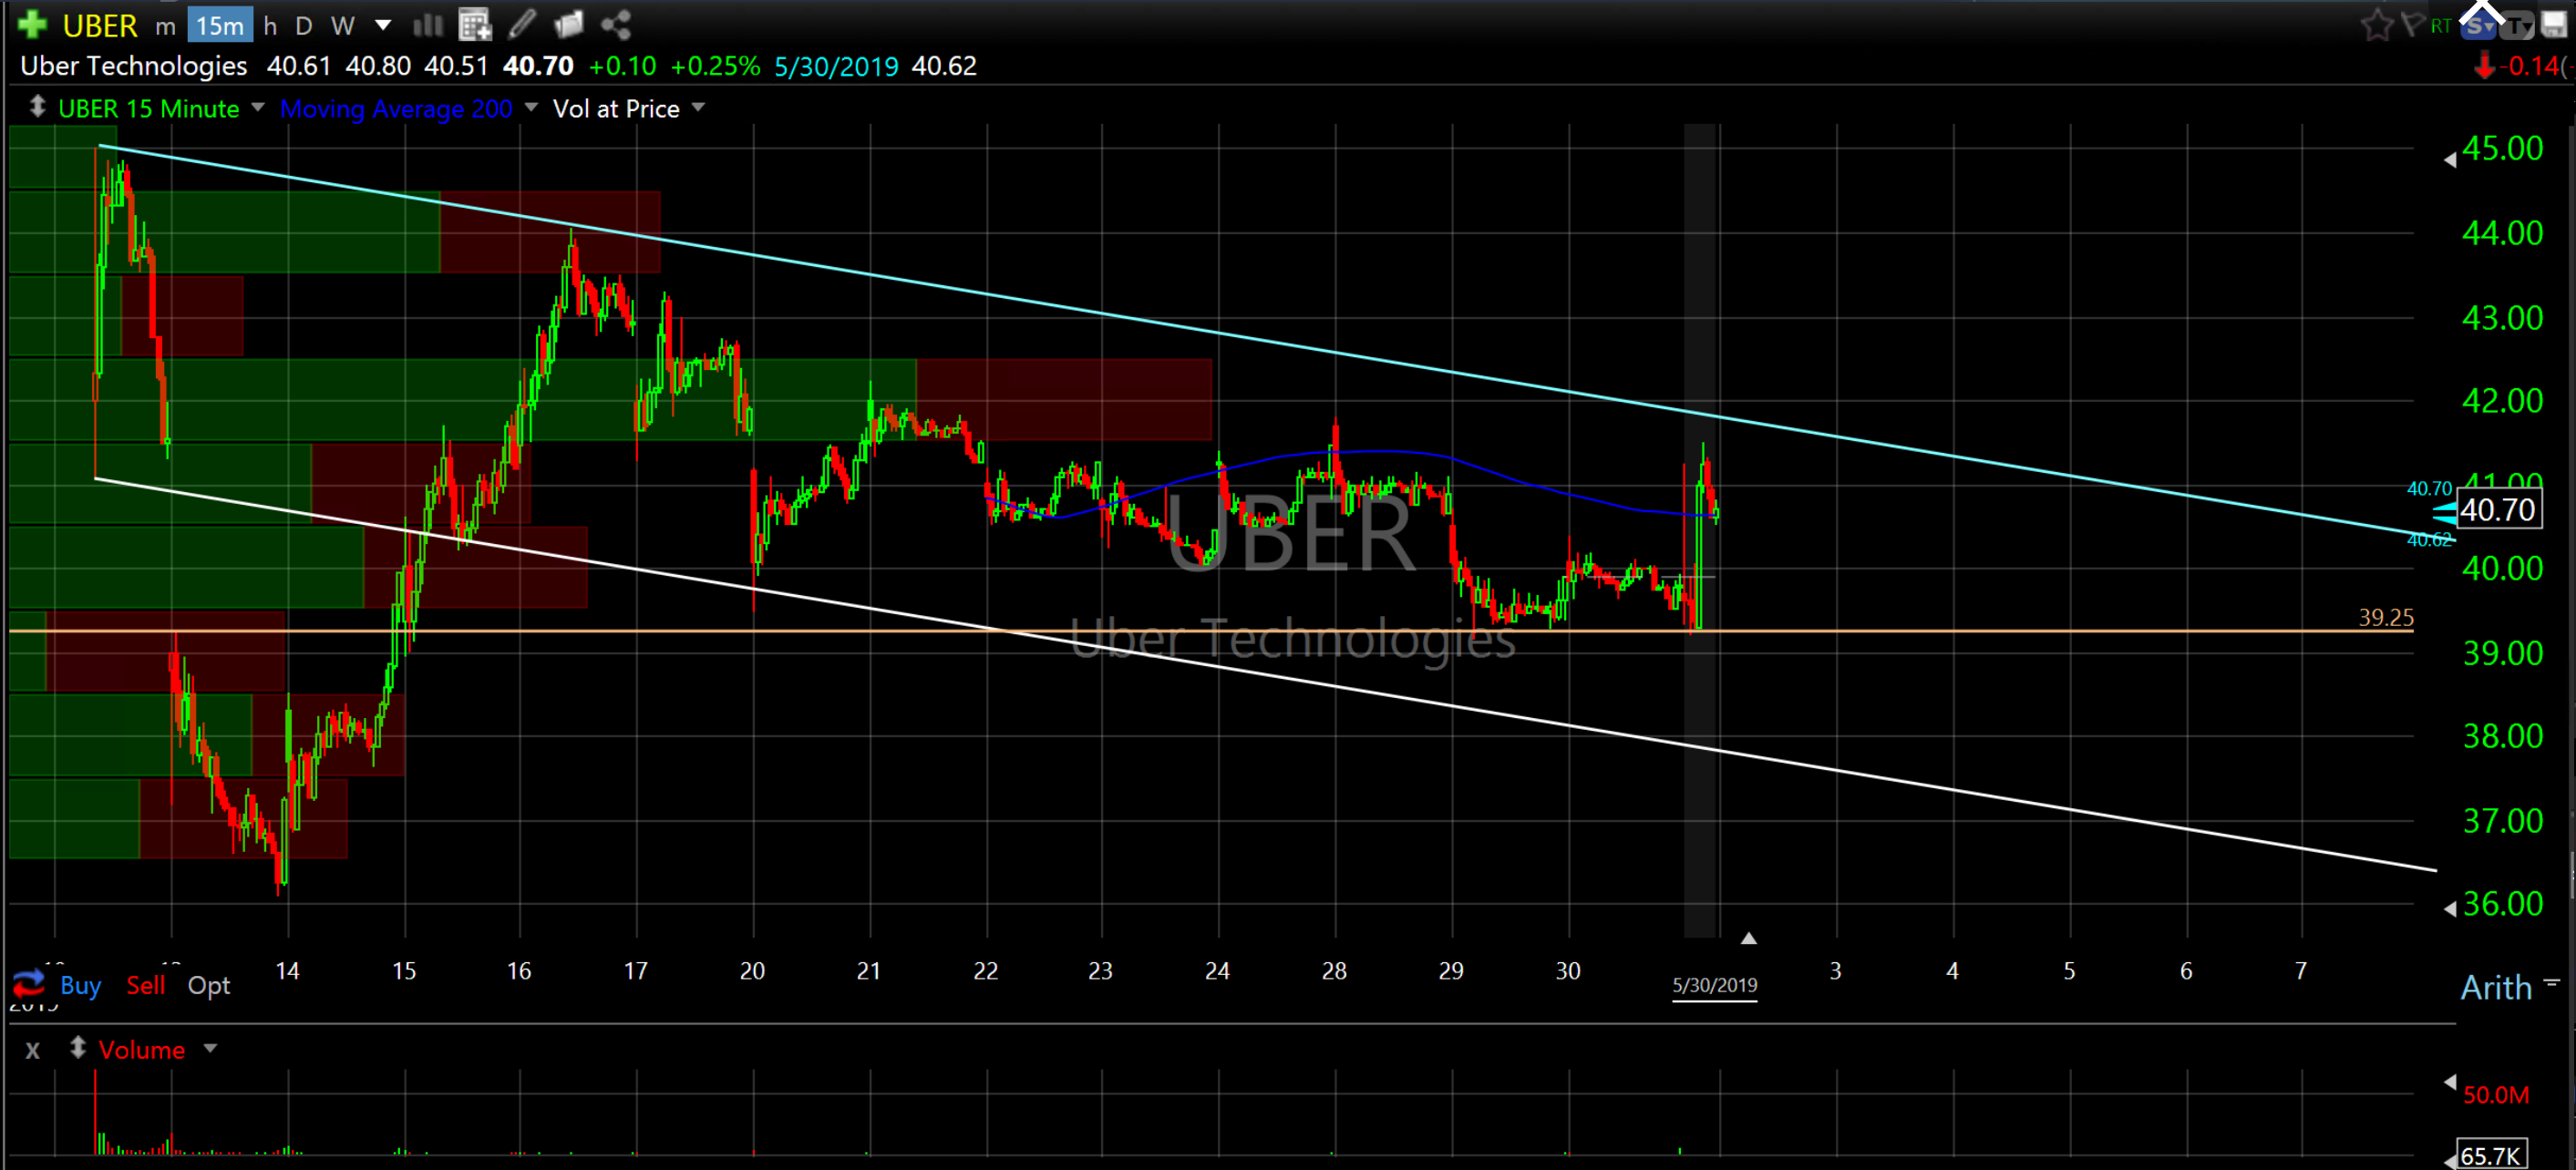
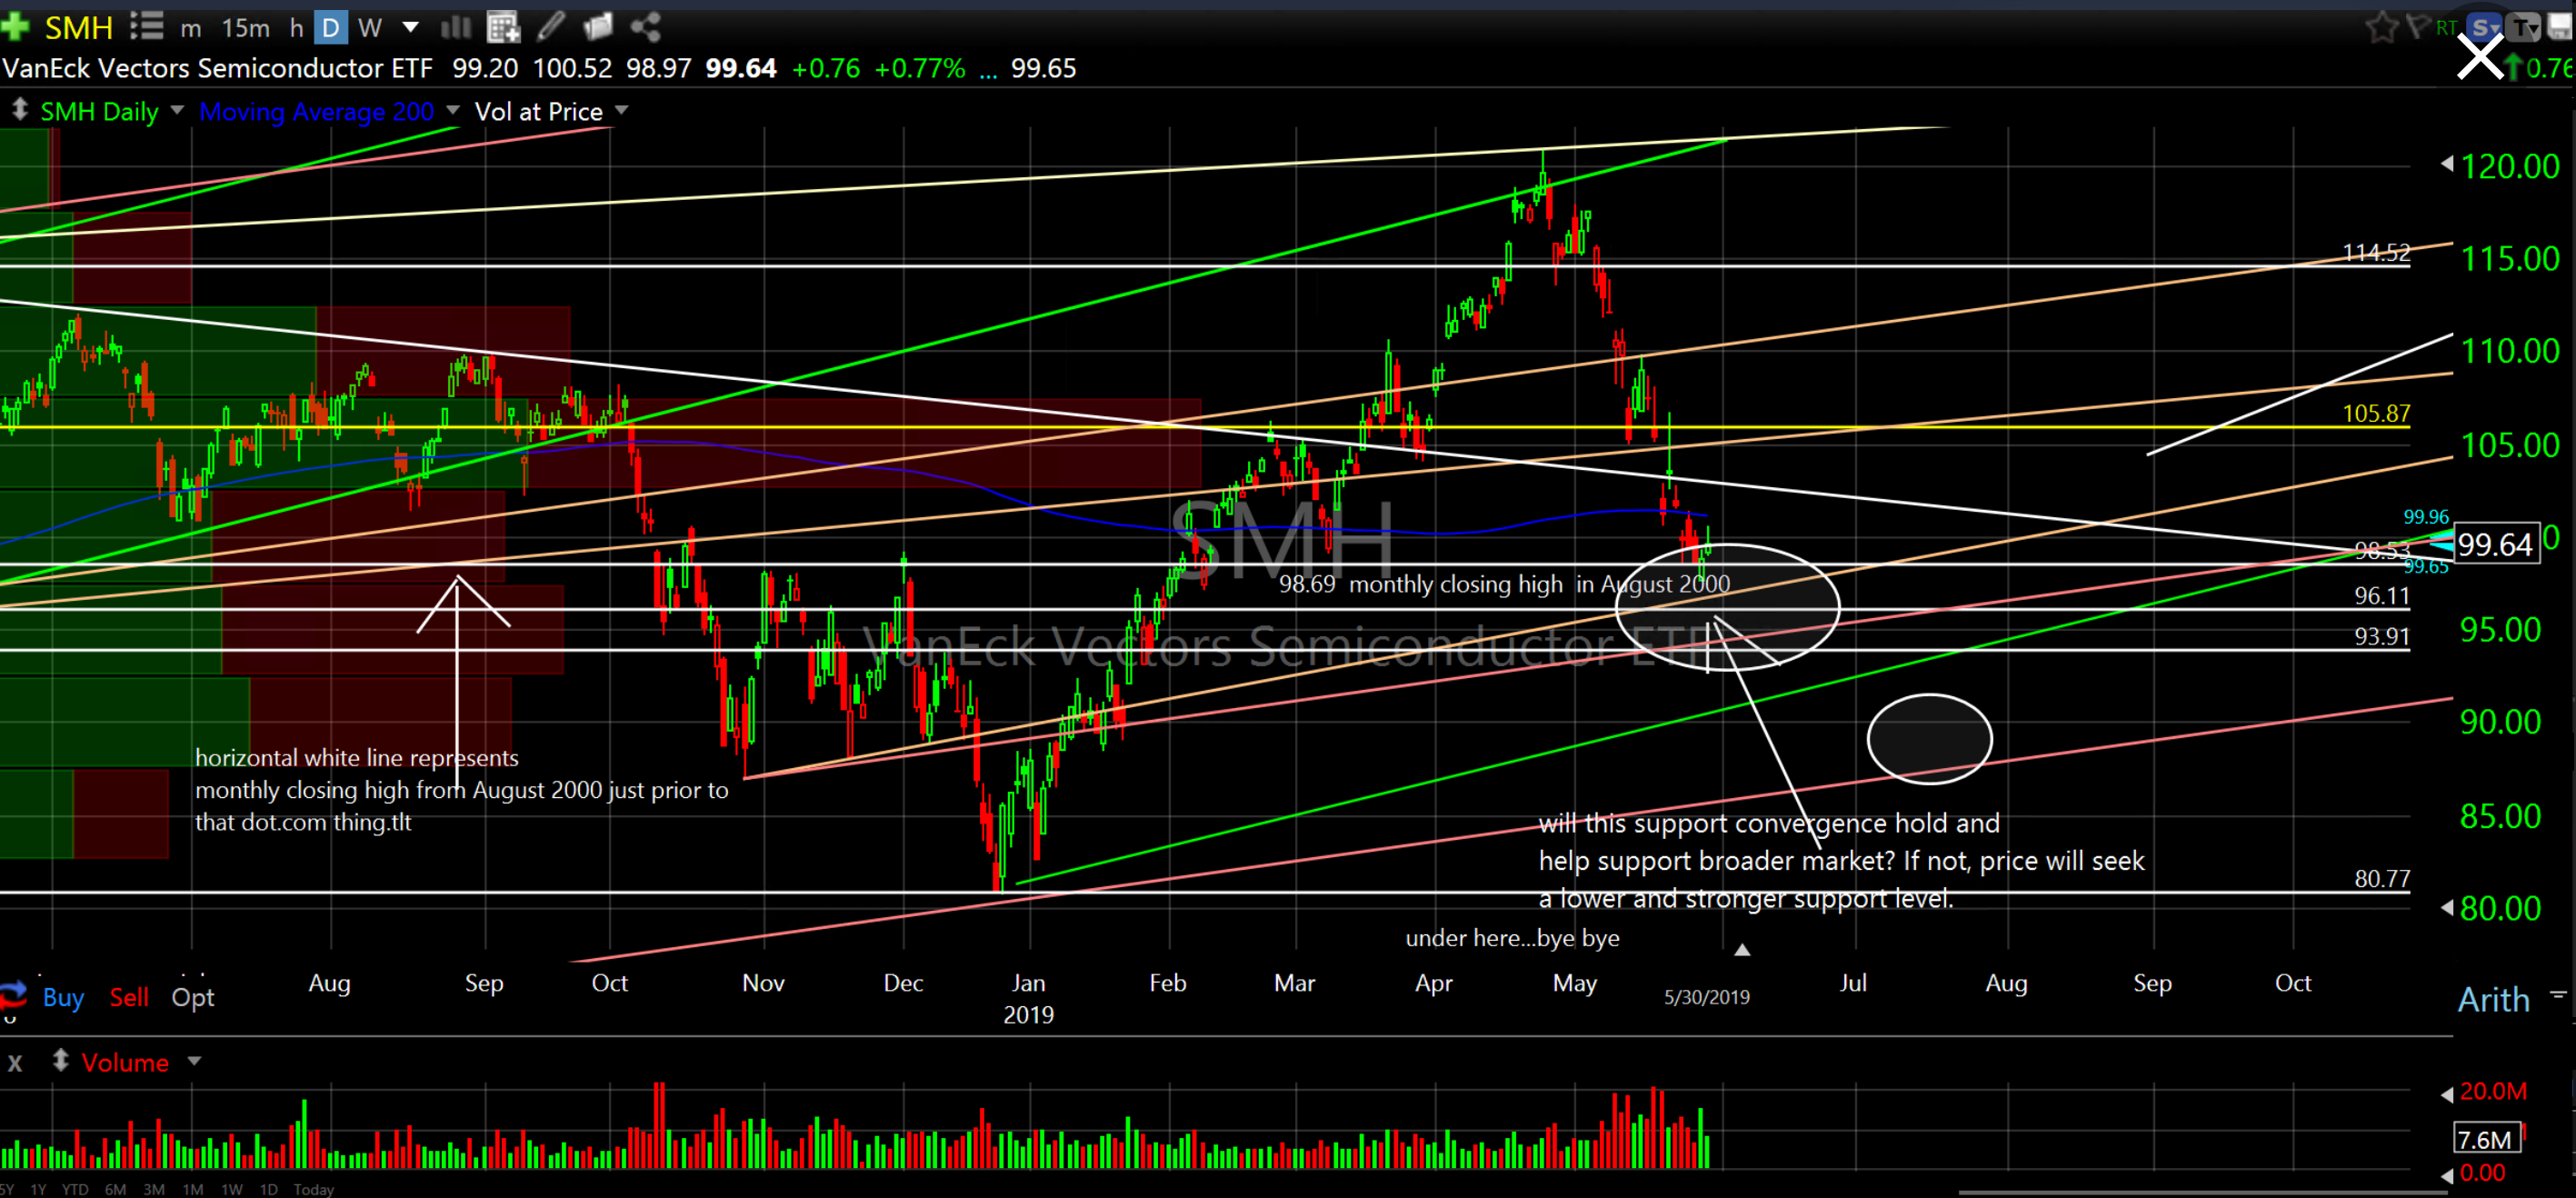
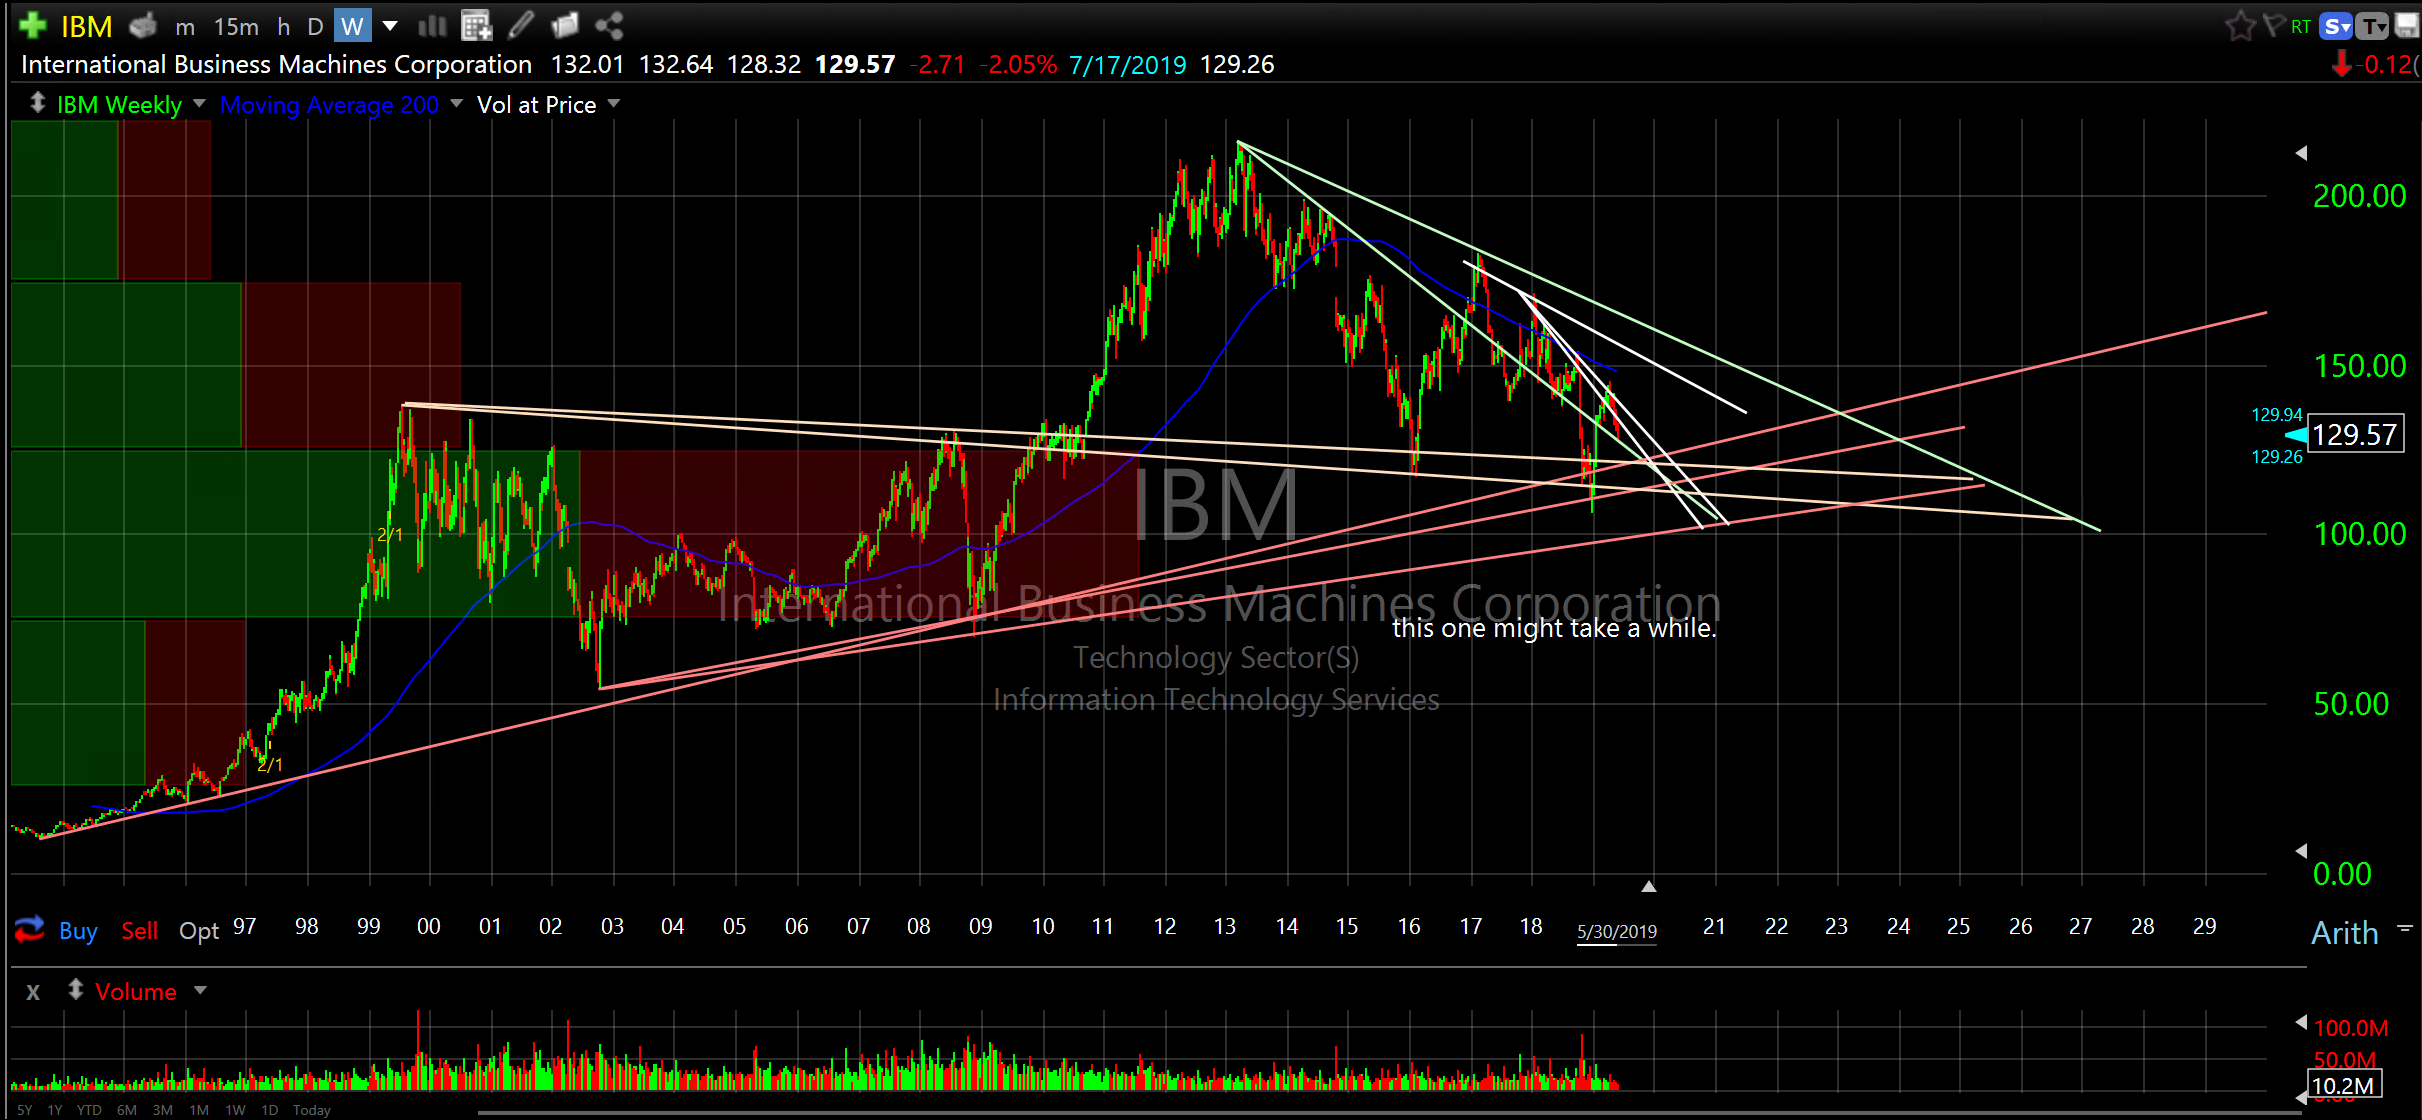
Symbol is in upper left corner of chart with product/instrument description.
S&P 500 Index ETF (SPY) 15min
Uber Technologies (UBER) 15min
Not much history.
VanEck Vectors Semiconductor ETF (SMH) daily
After Thursdays close…weak bounce but better than no bounce.
Weekly close will be important.
IBM Corp (IBM) weekly
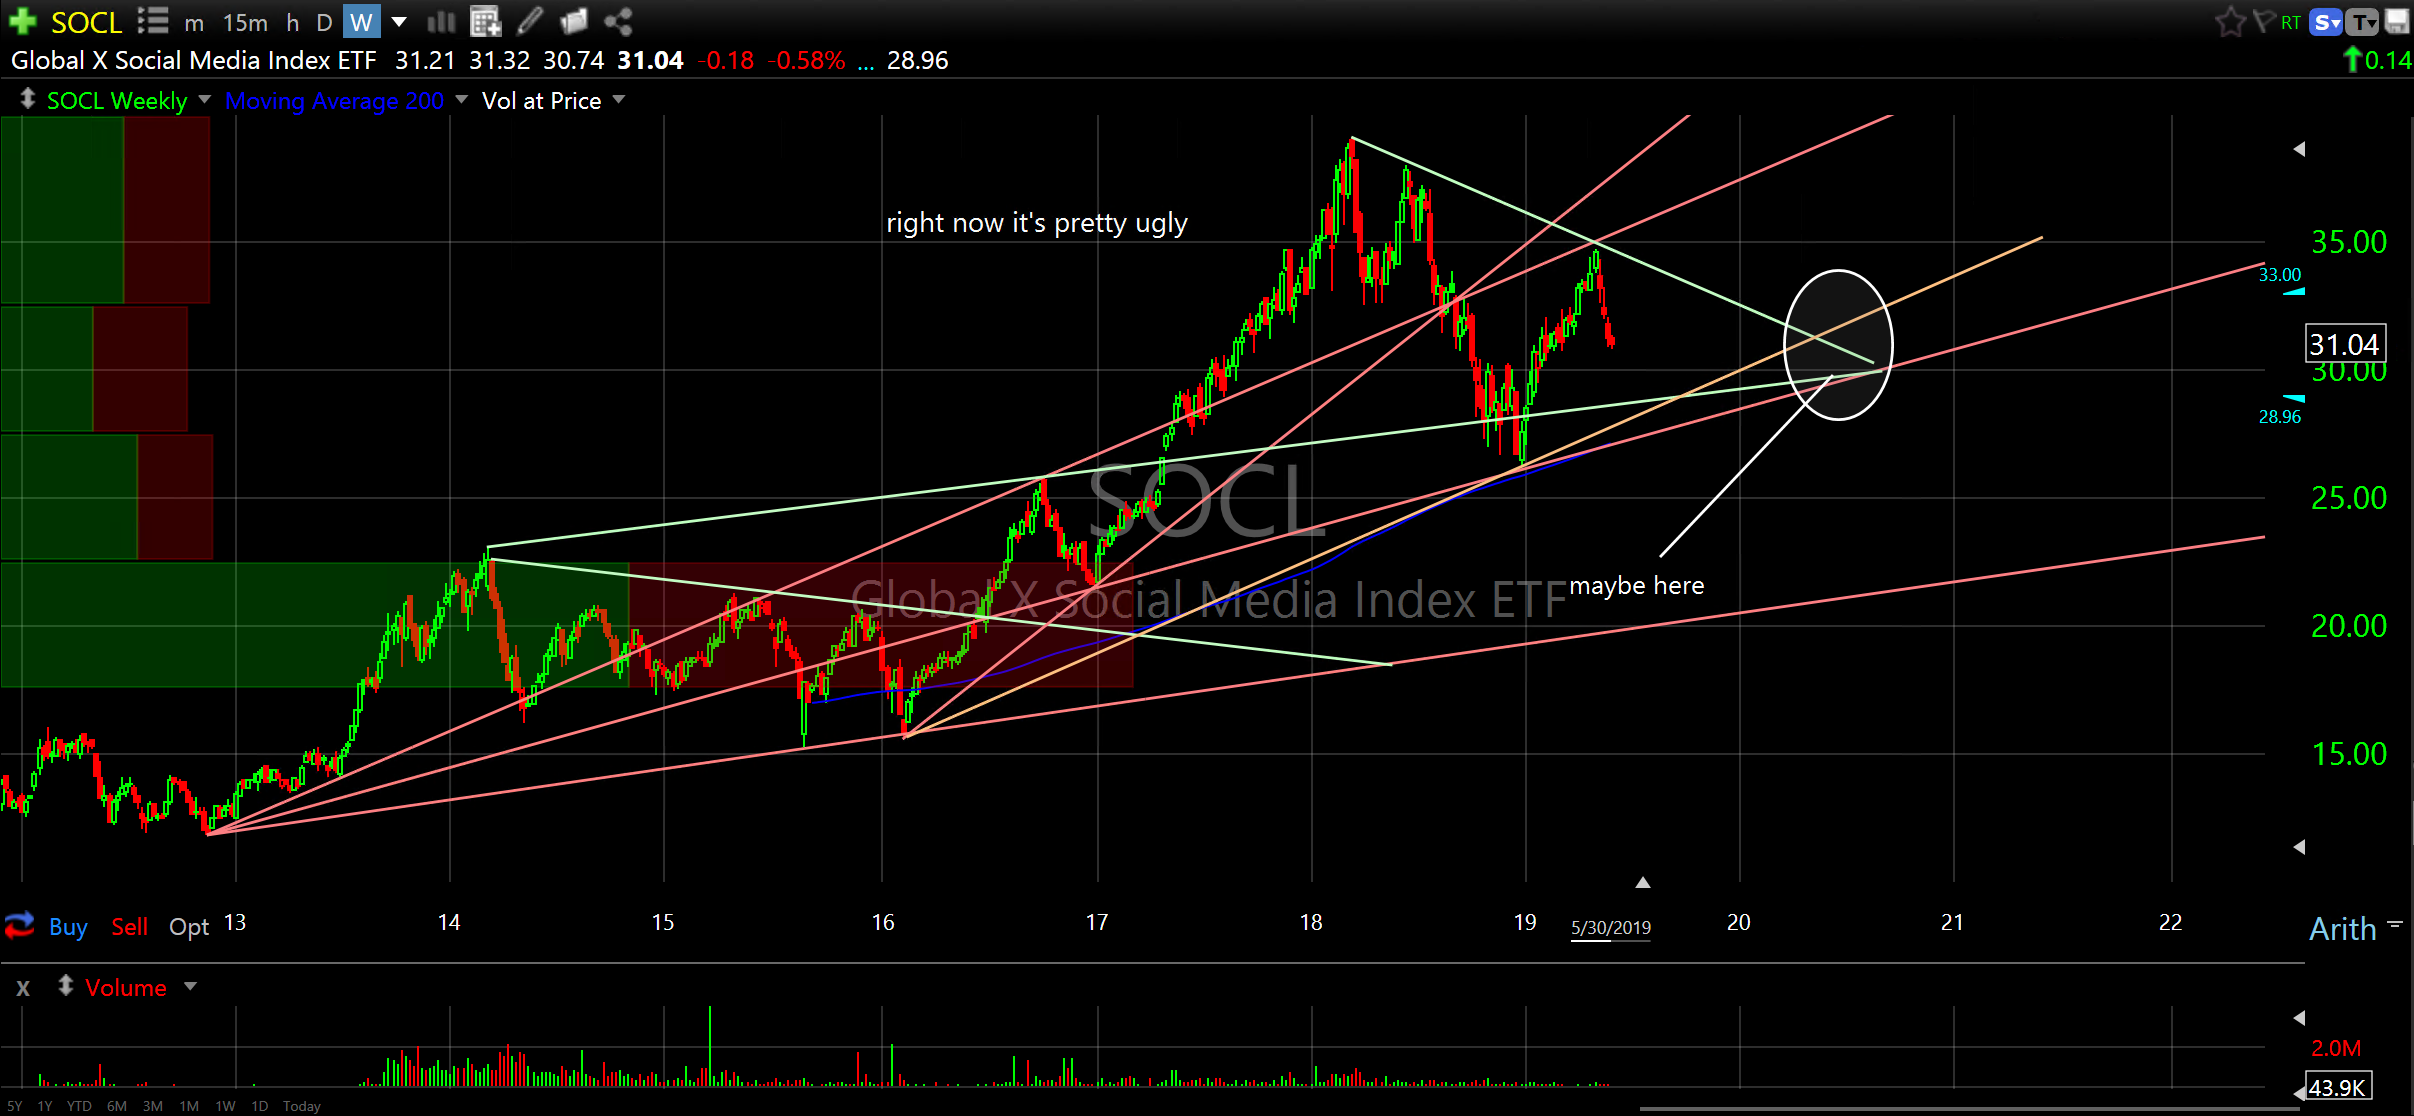
Social Media Index ETF (SOCL) weekly
Pretty ugly
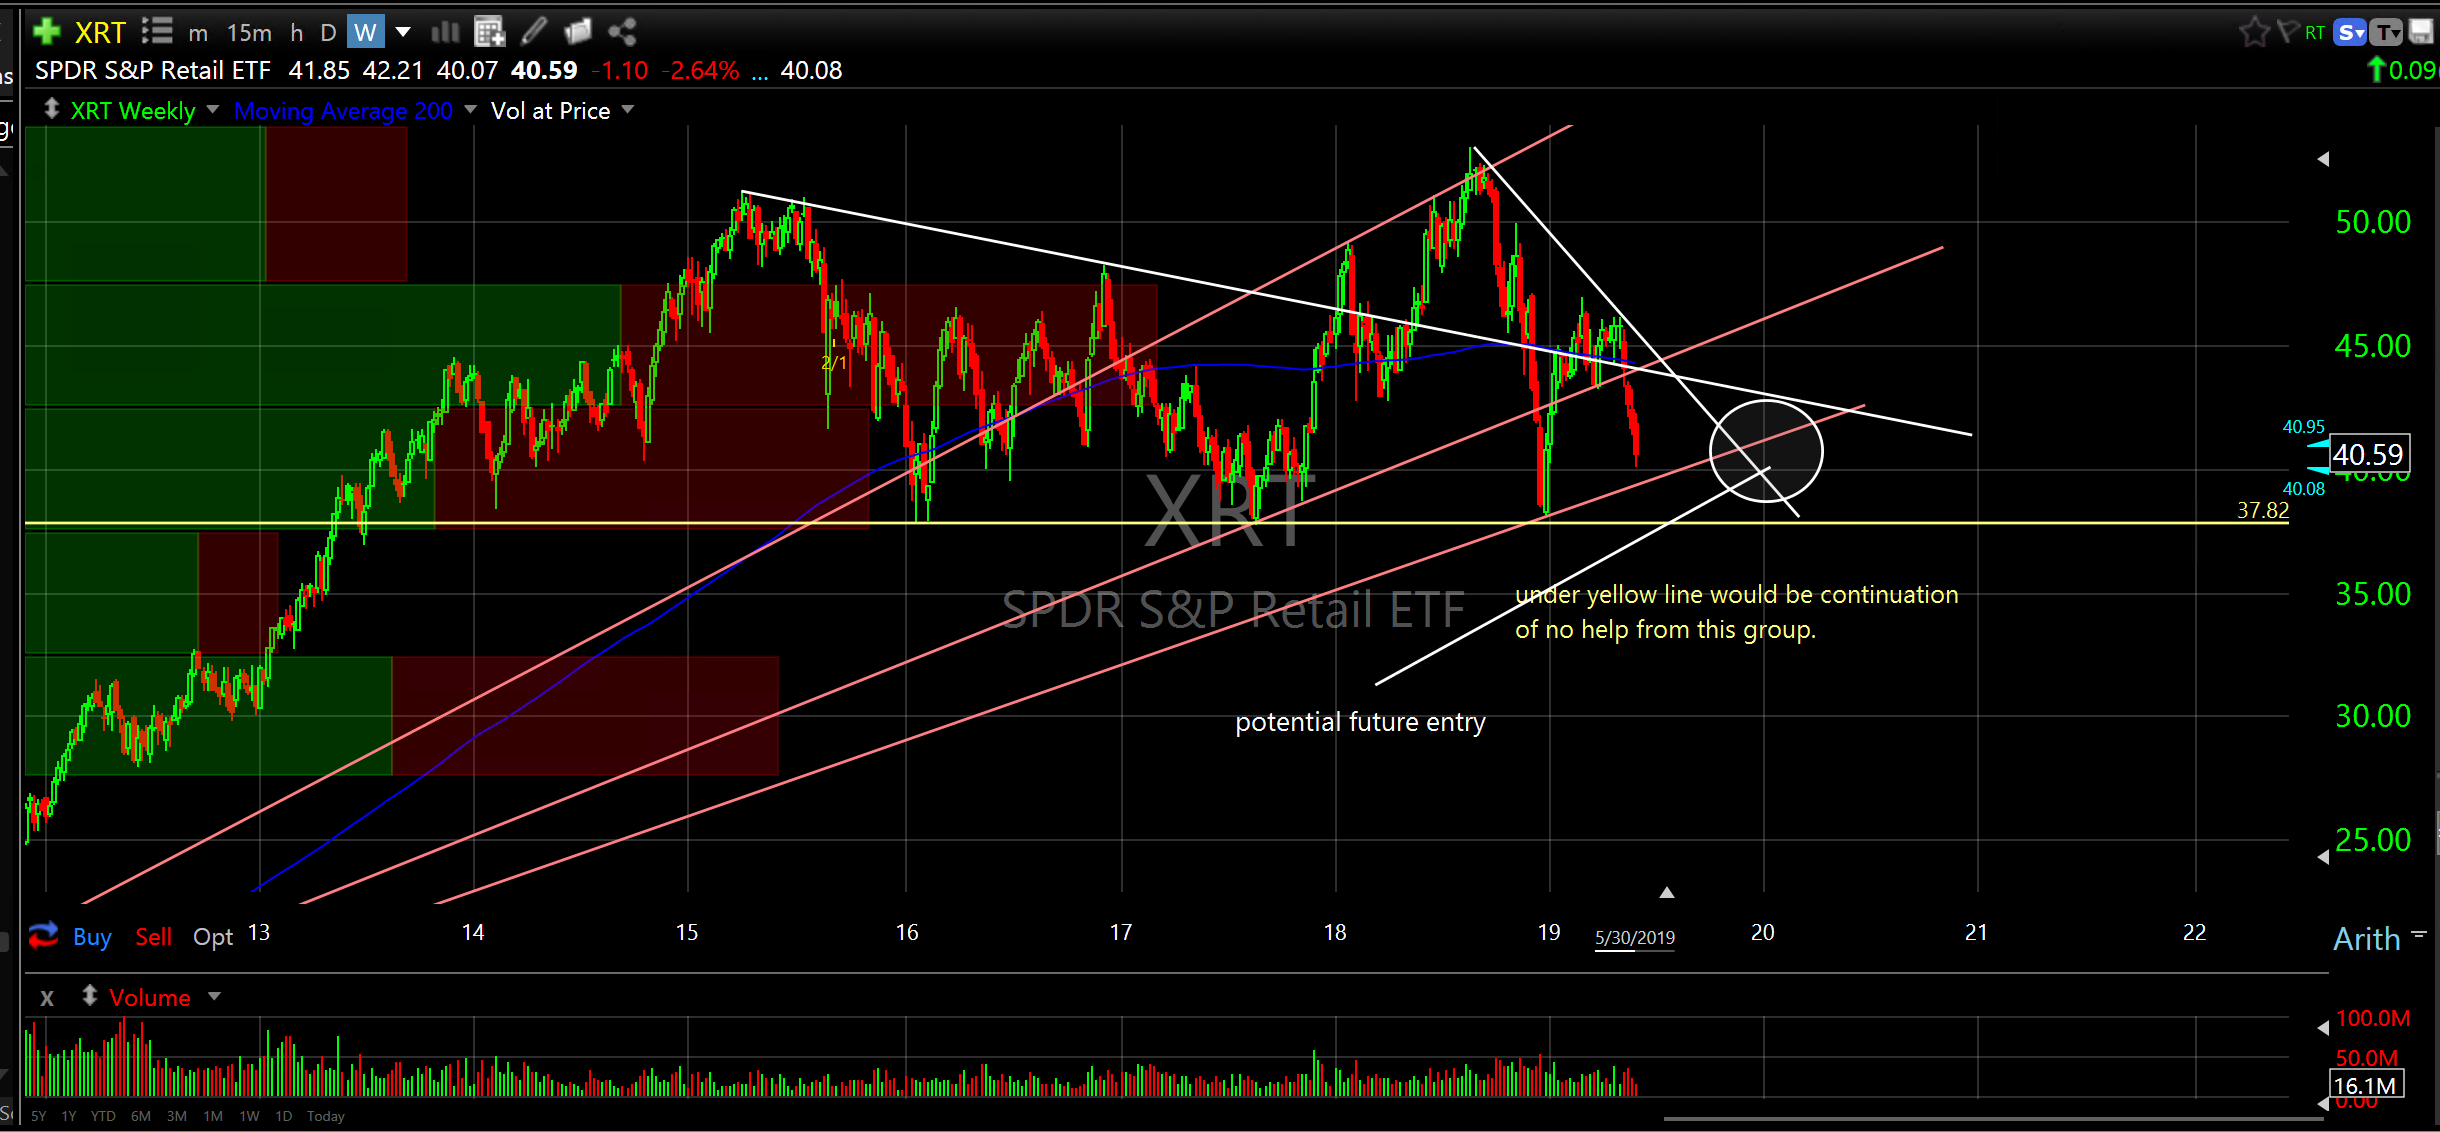
SPDR’s S&P Retail ETF (XRT) weekly
No help here
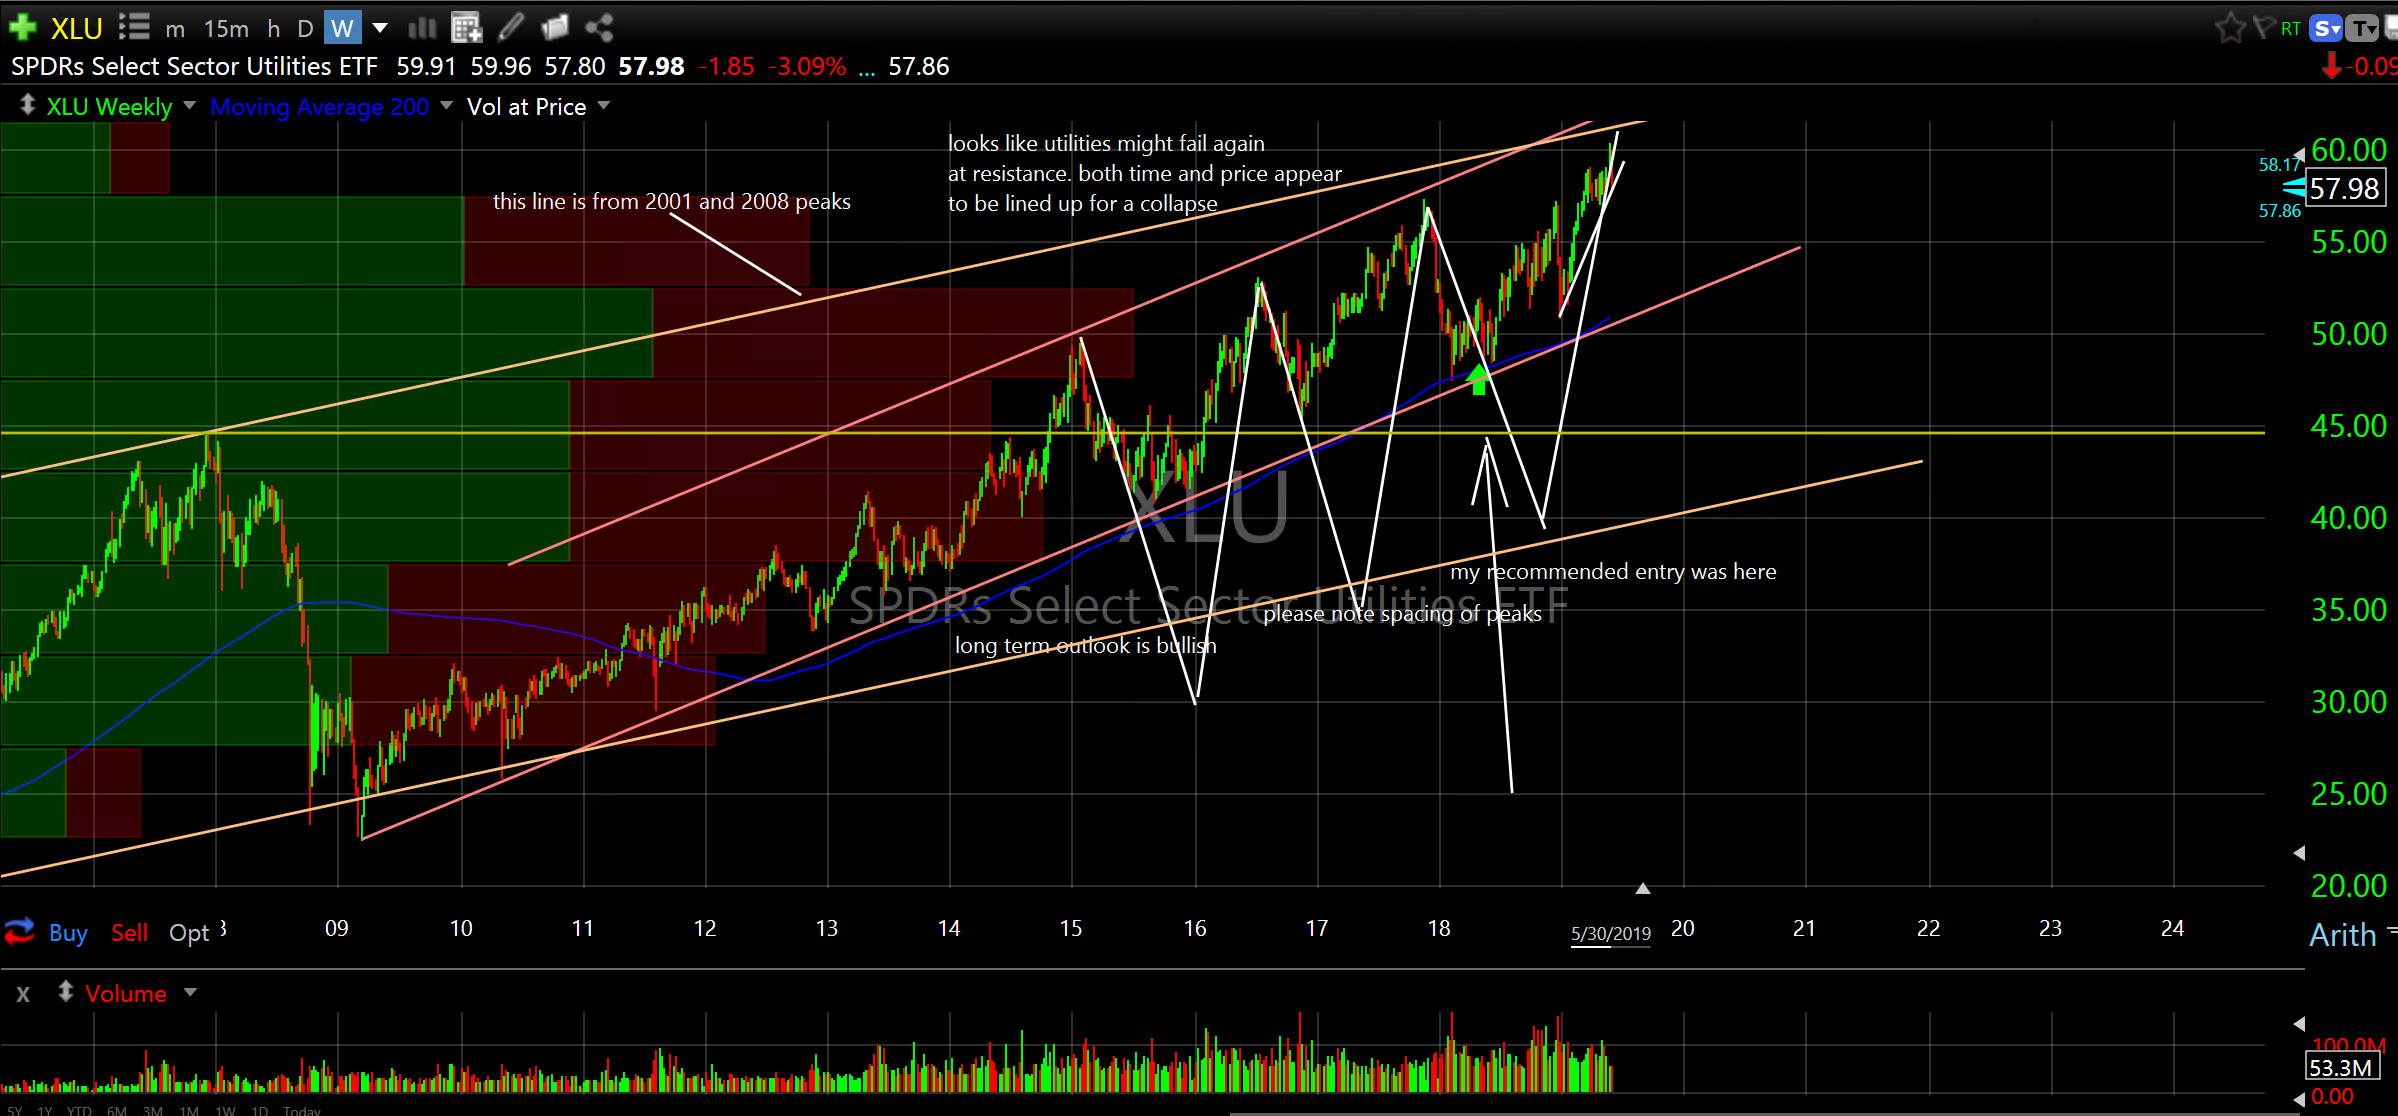
SPDR’s Select Sector Utilities ETF (XLU) weekly
Has it peaked? might have to capture gains early next week.
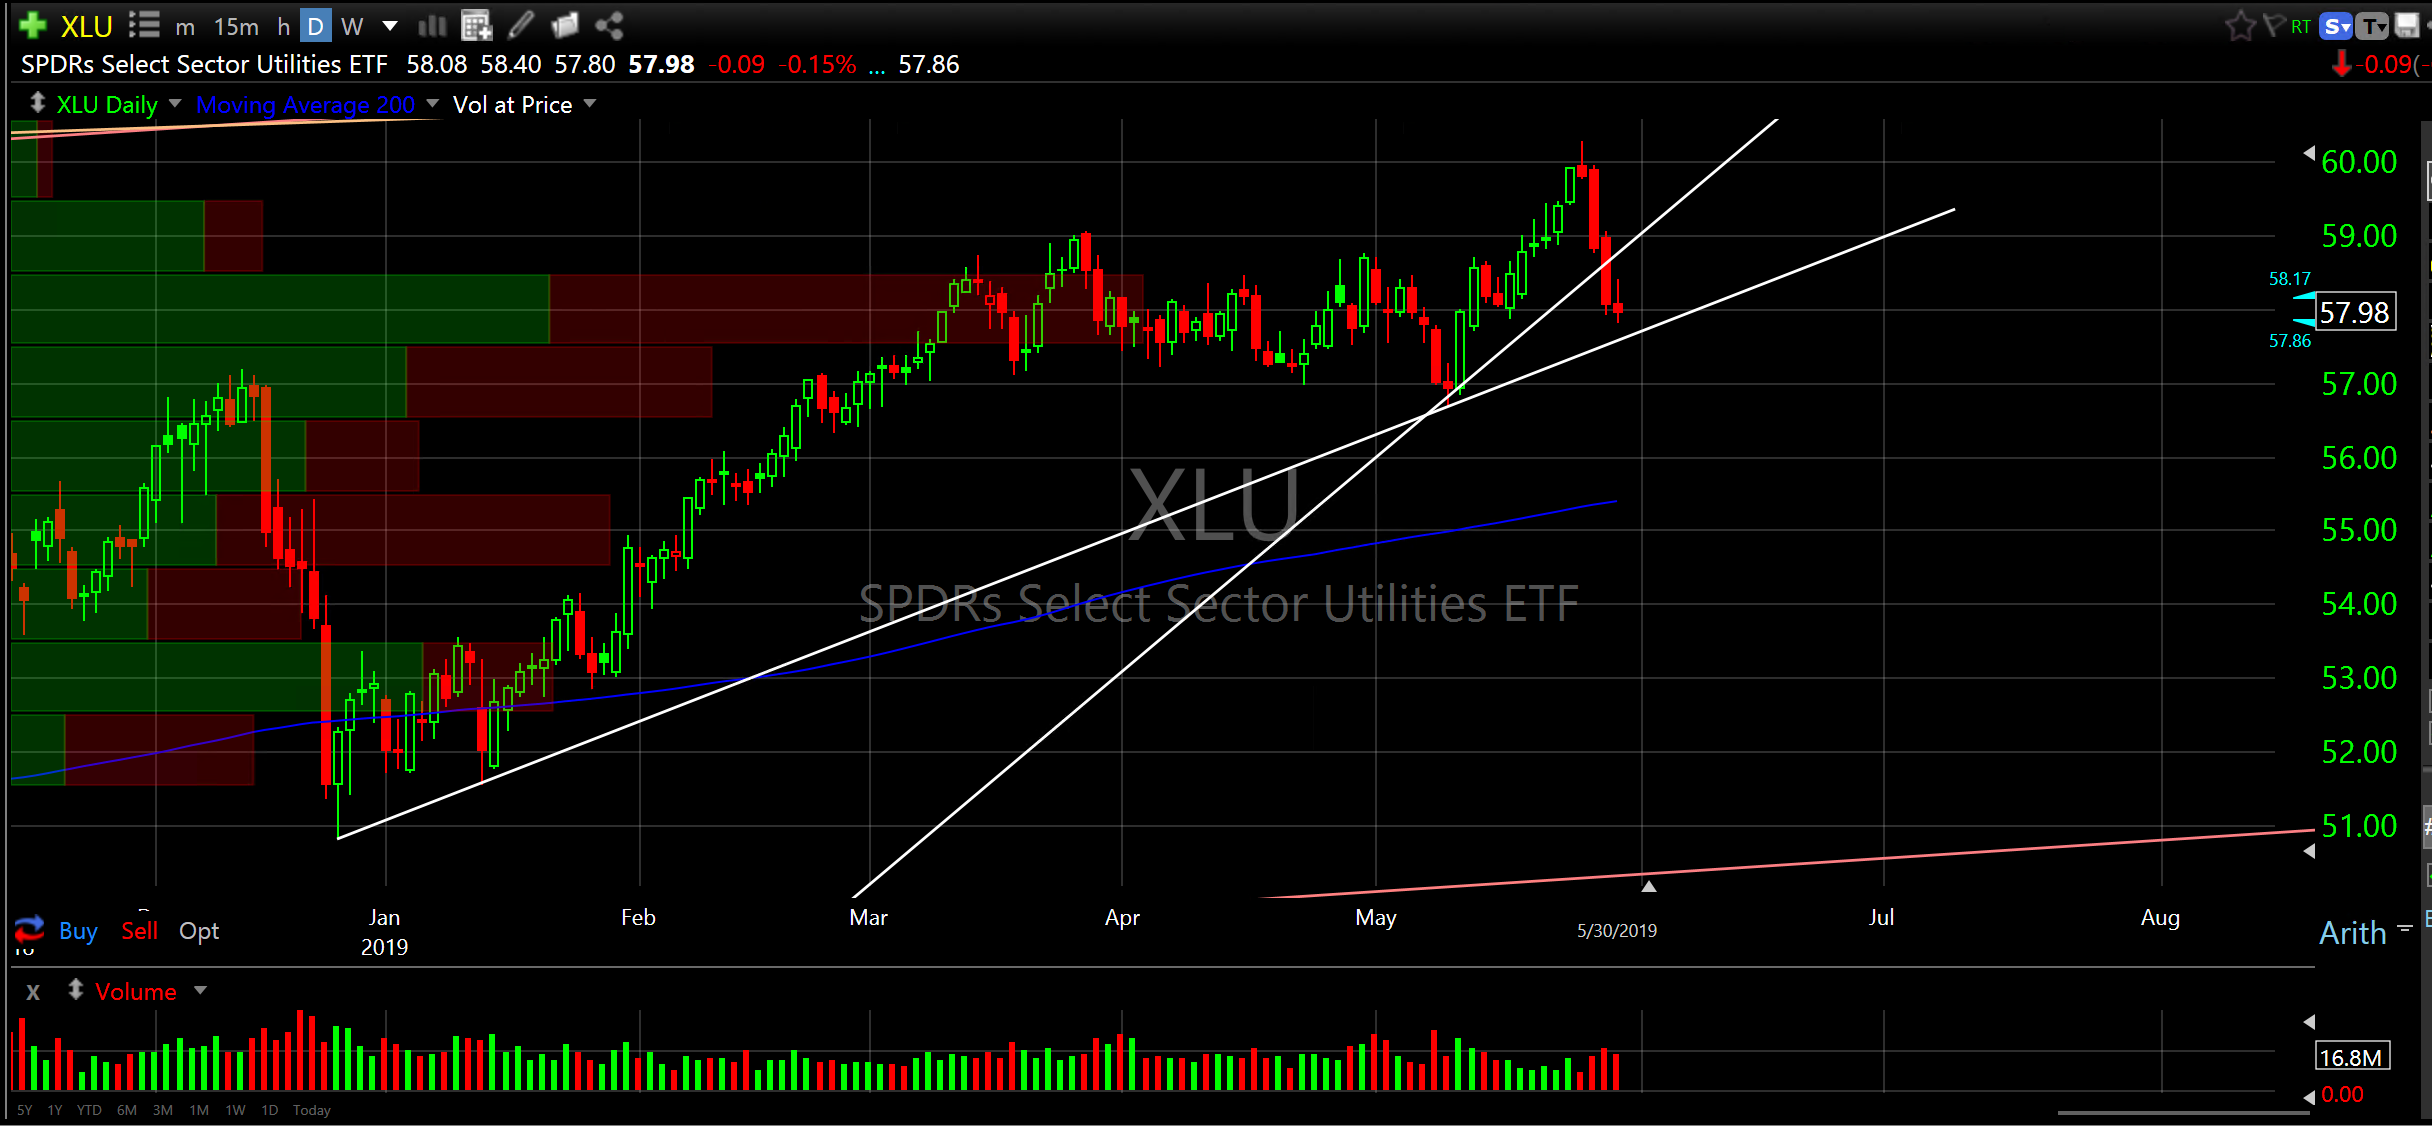
SPDR’s Select Sector Utilities ETF (XLU) daily
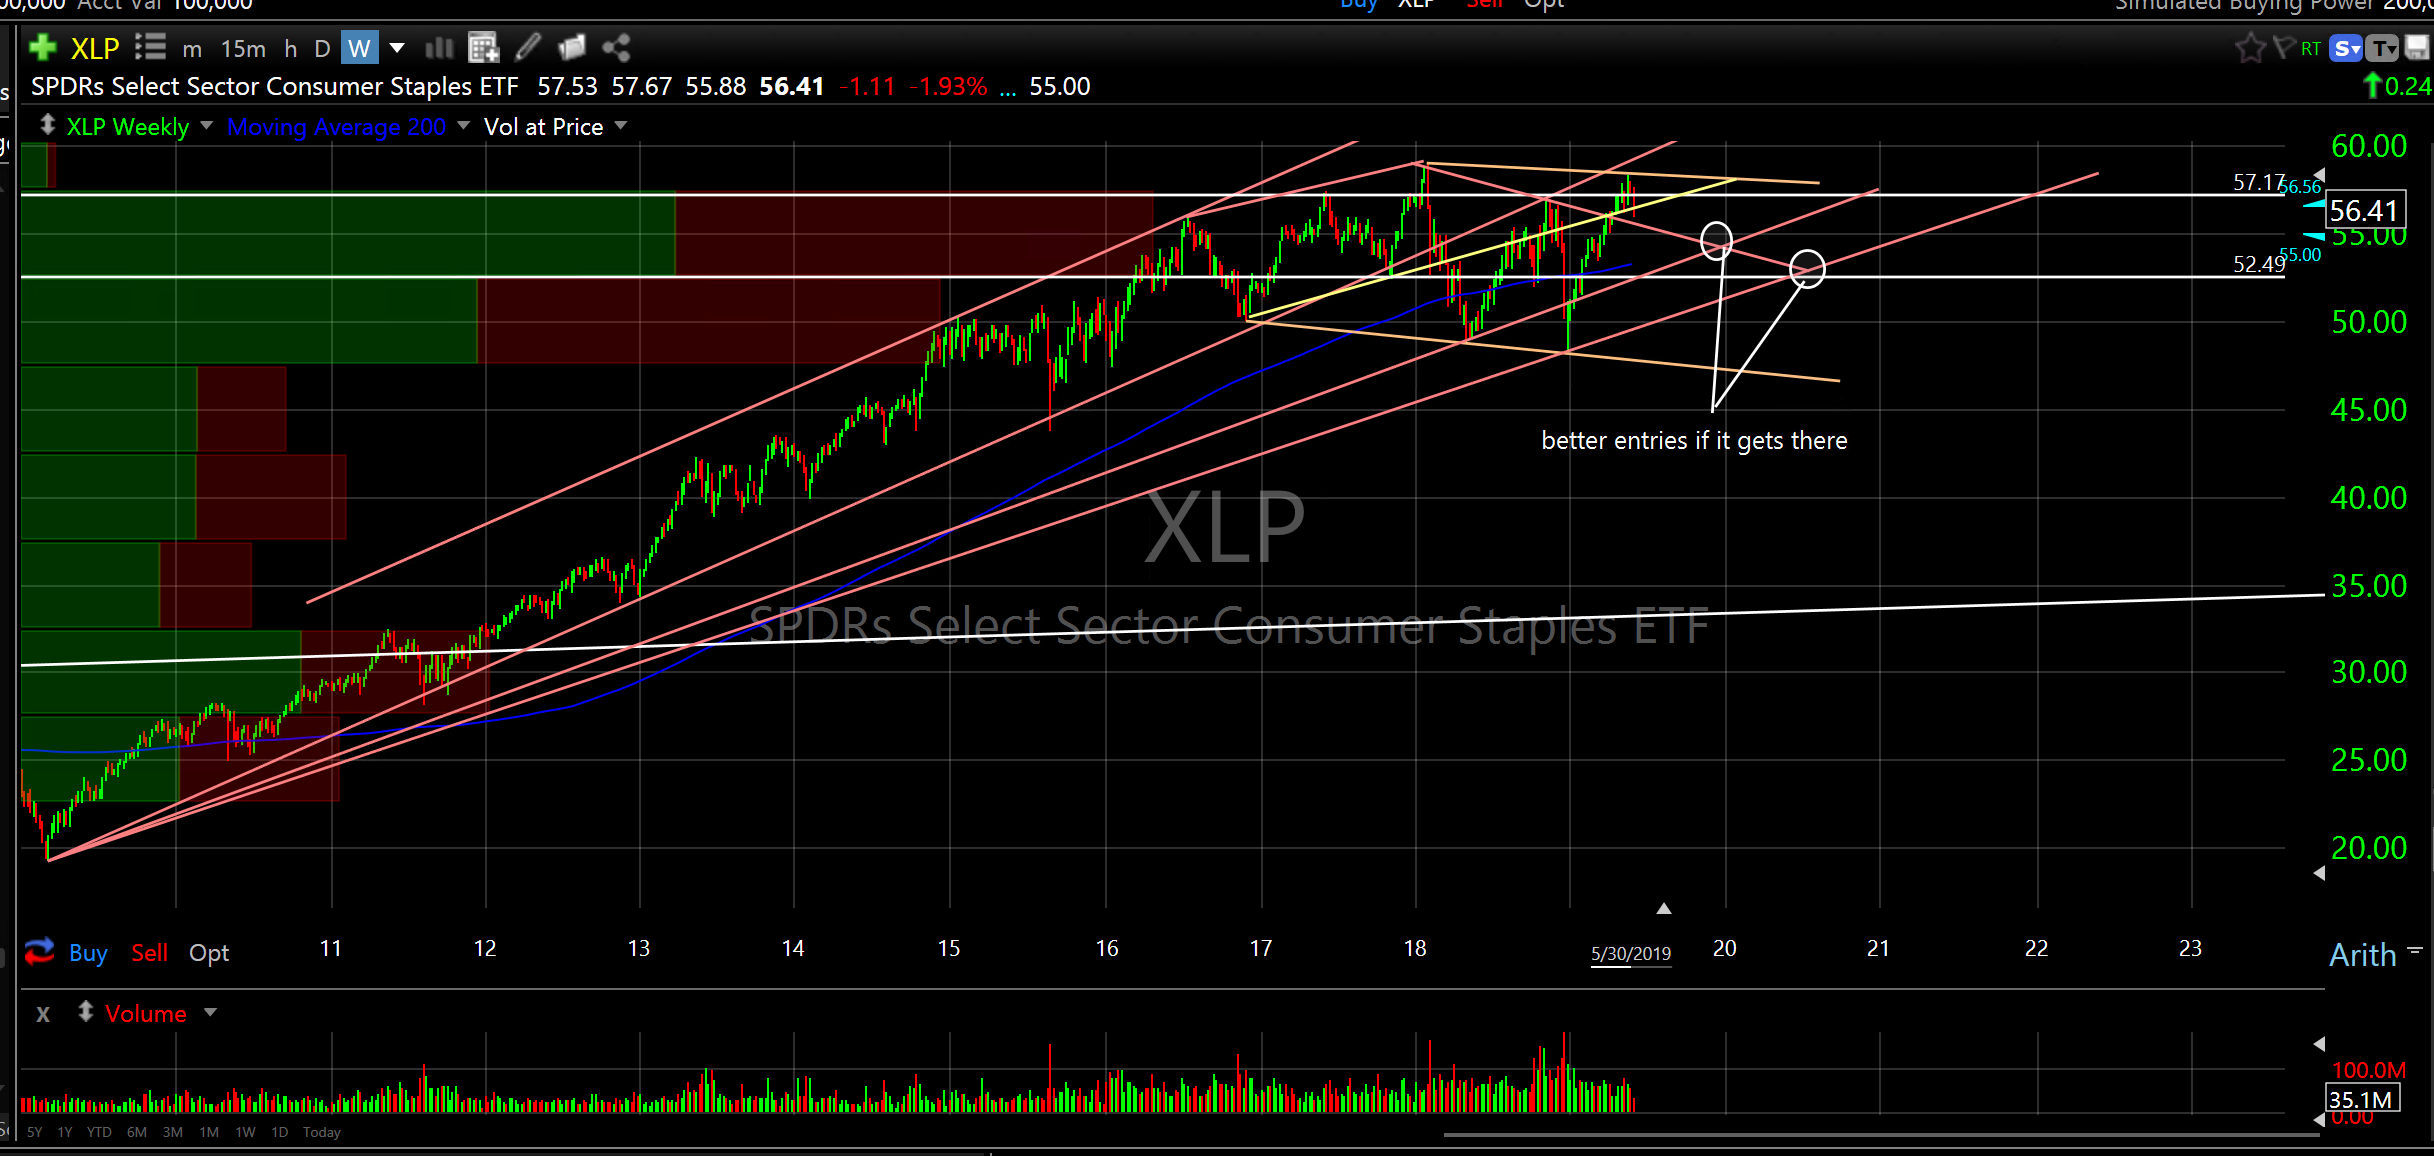
SPDR’s Select Sector Consumer Staples ETF (XLP) weekly
Entries have feelings too.
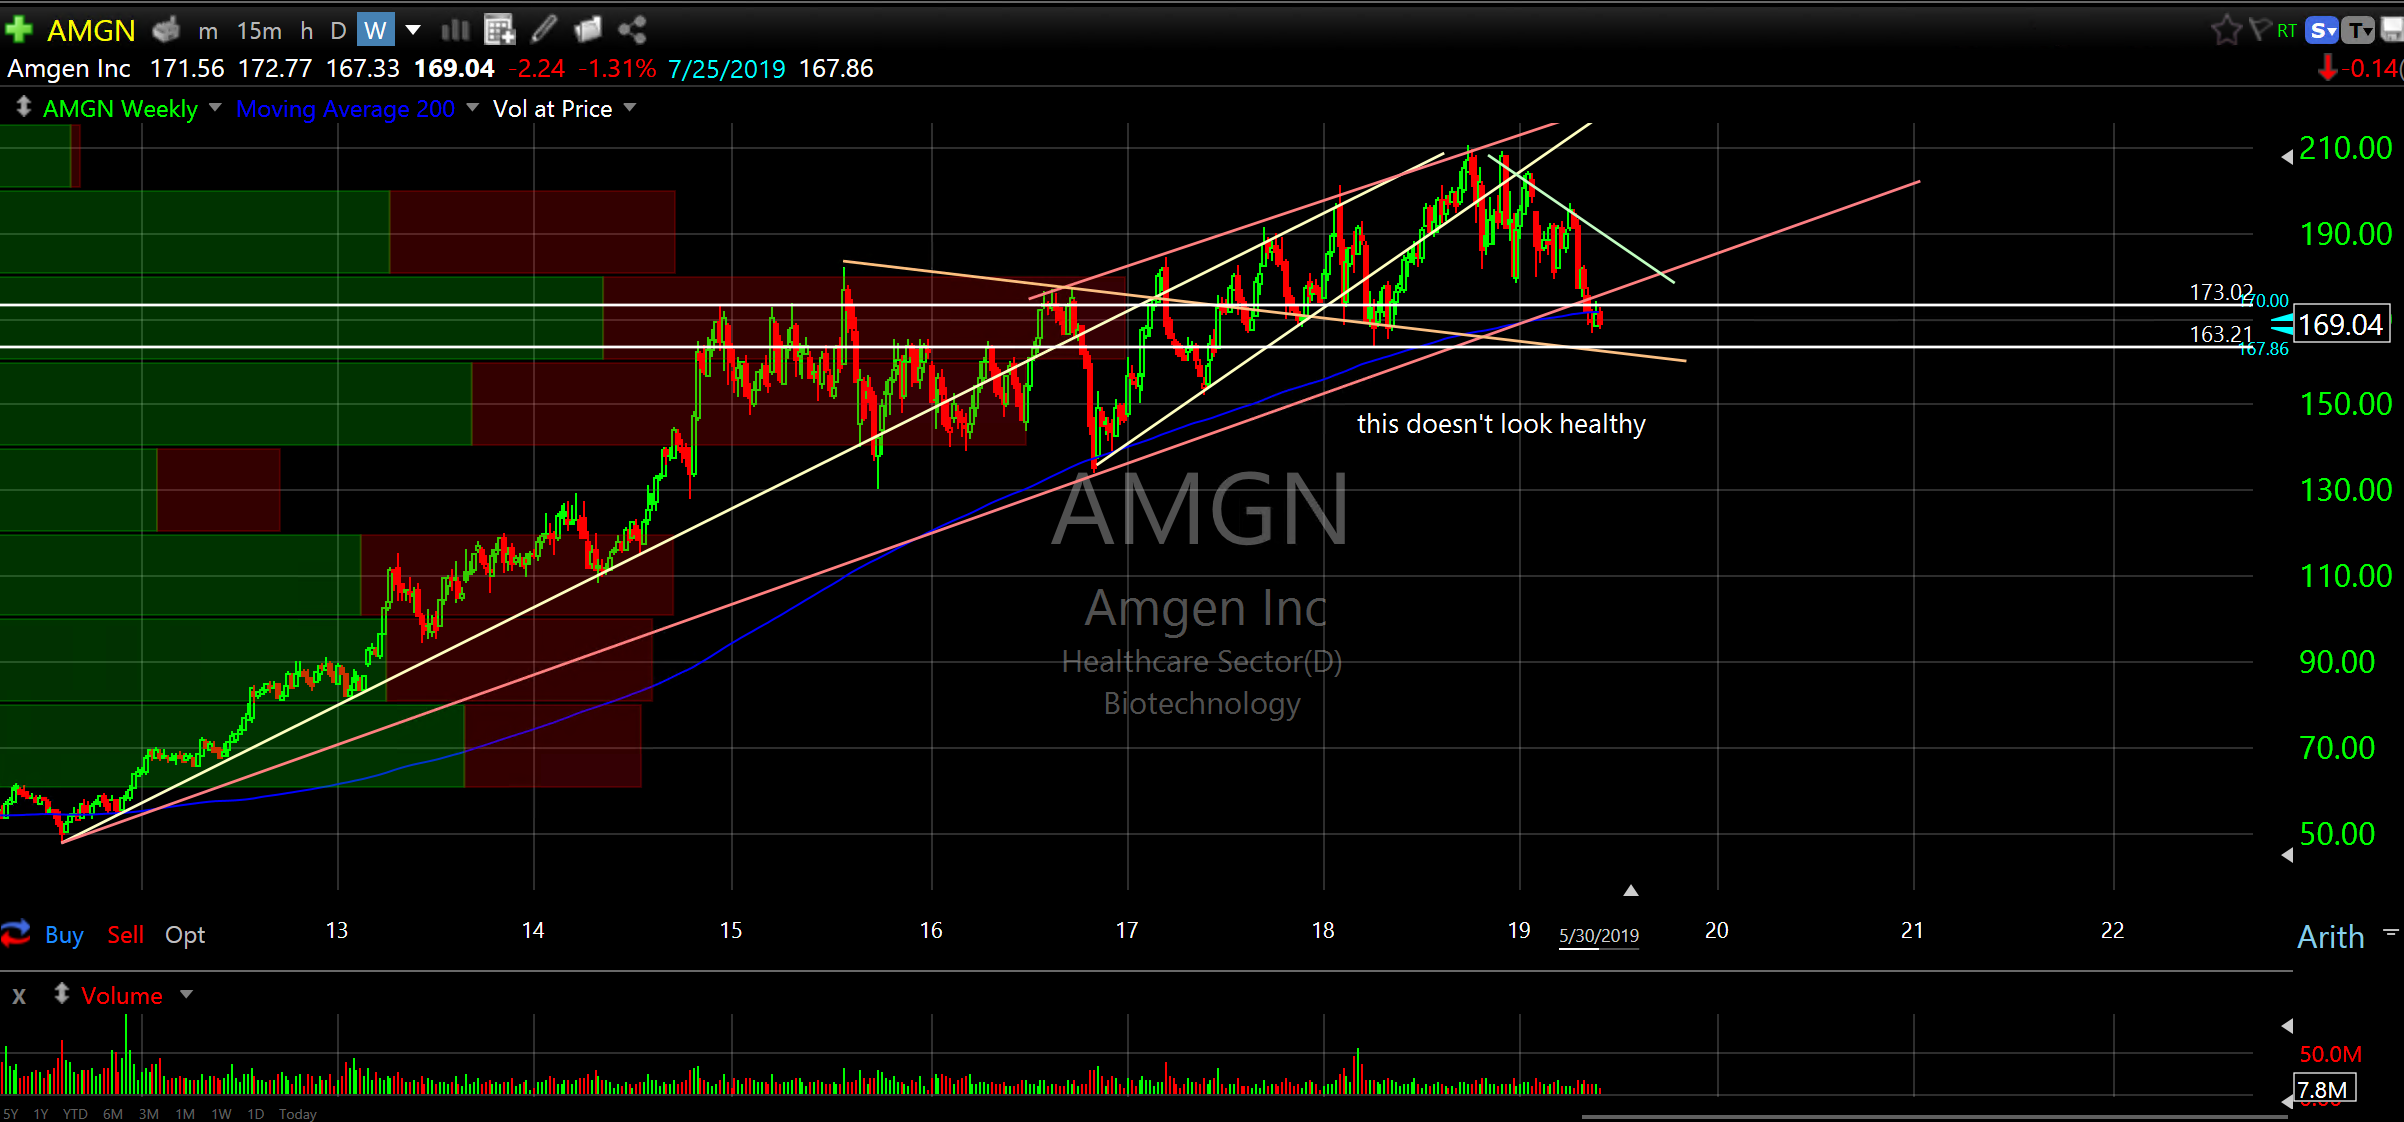
AMGN Inc (AMGN) weekly
Doesn’t look well
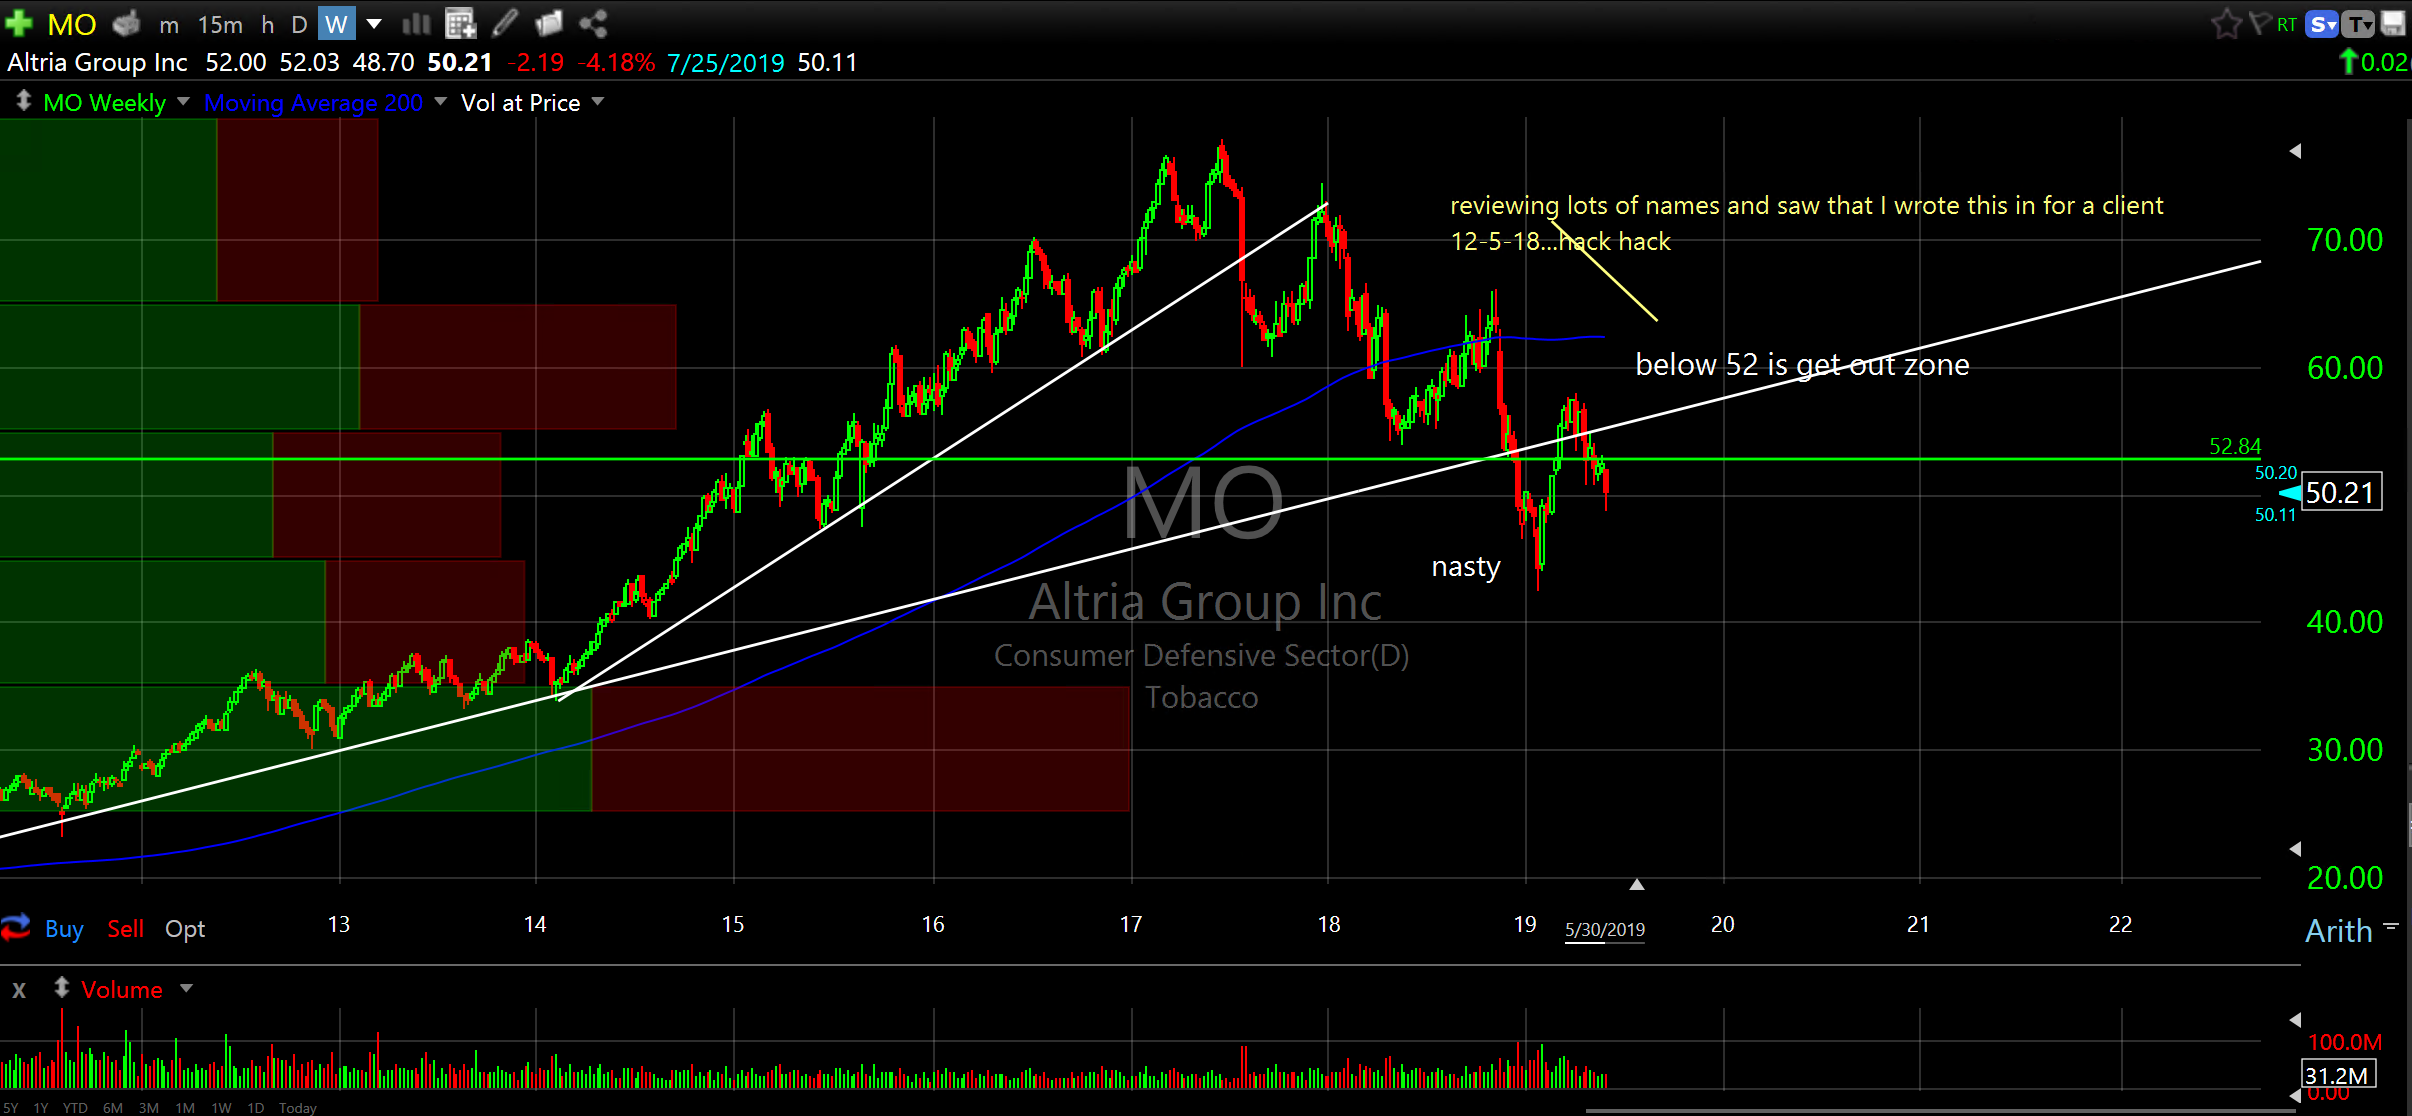
Altria Group Inc (MO) weekly
Nasty
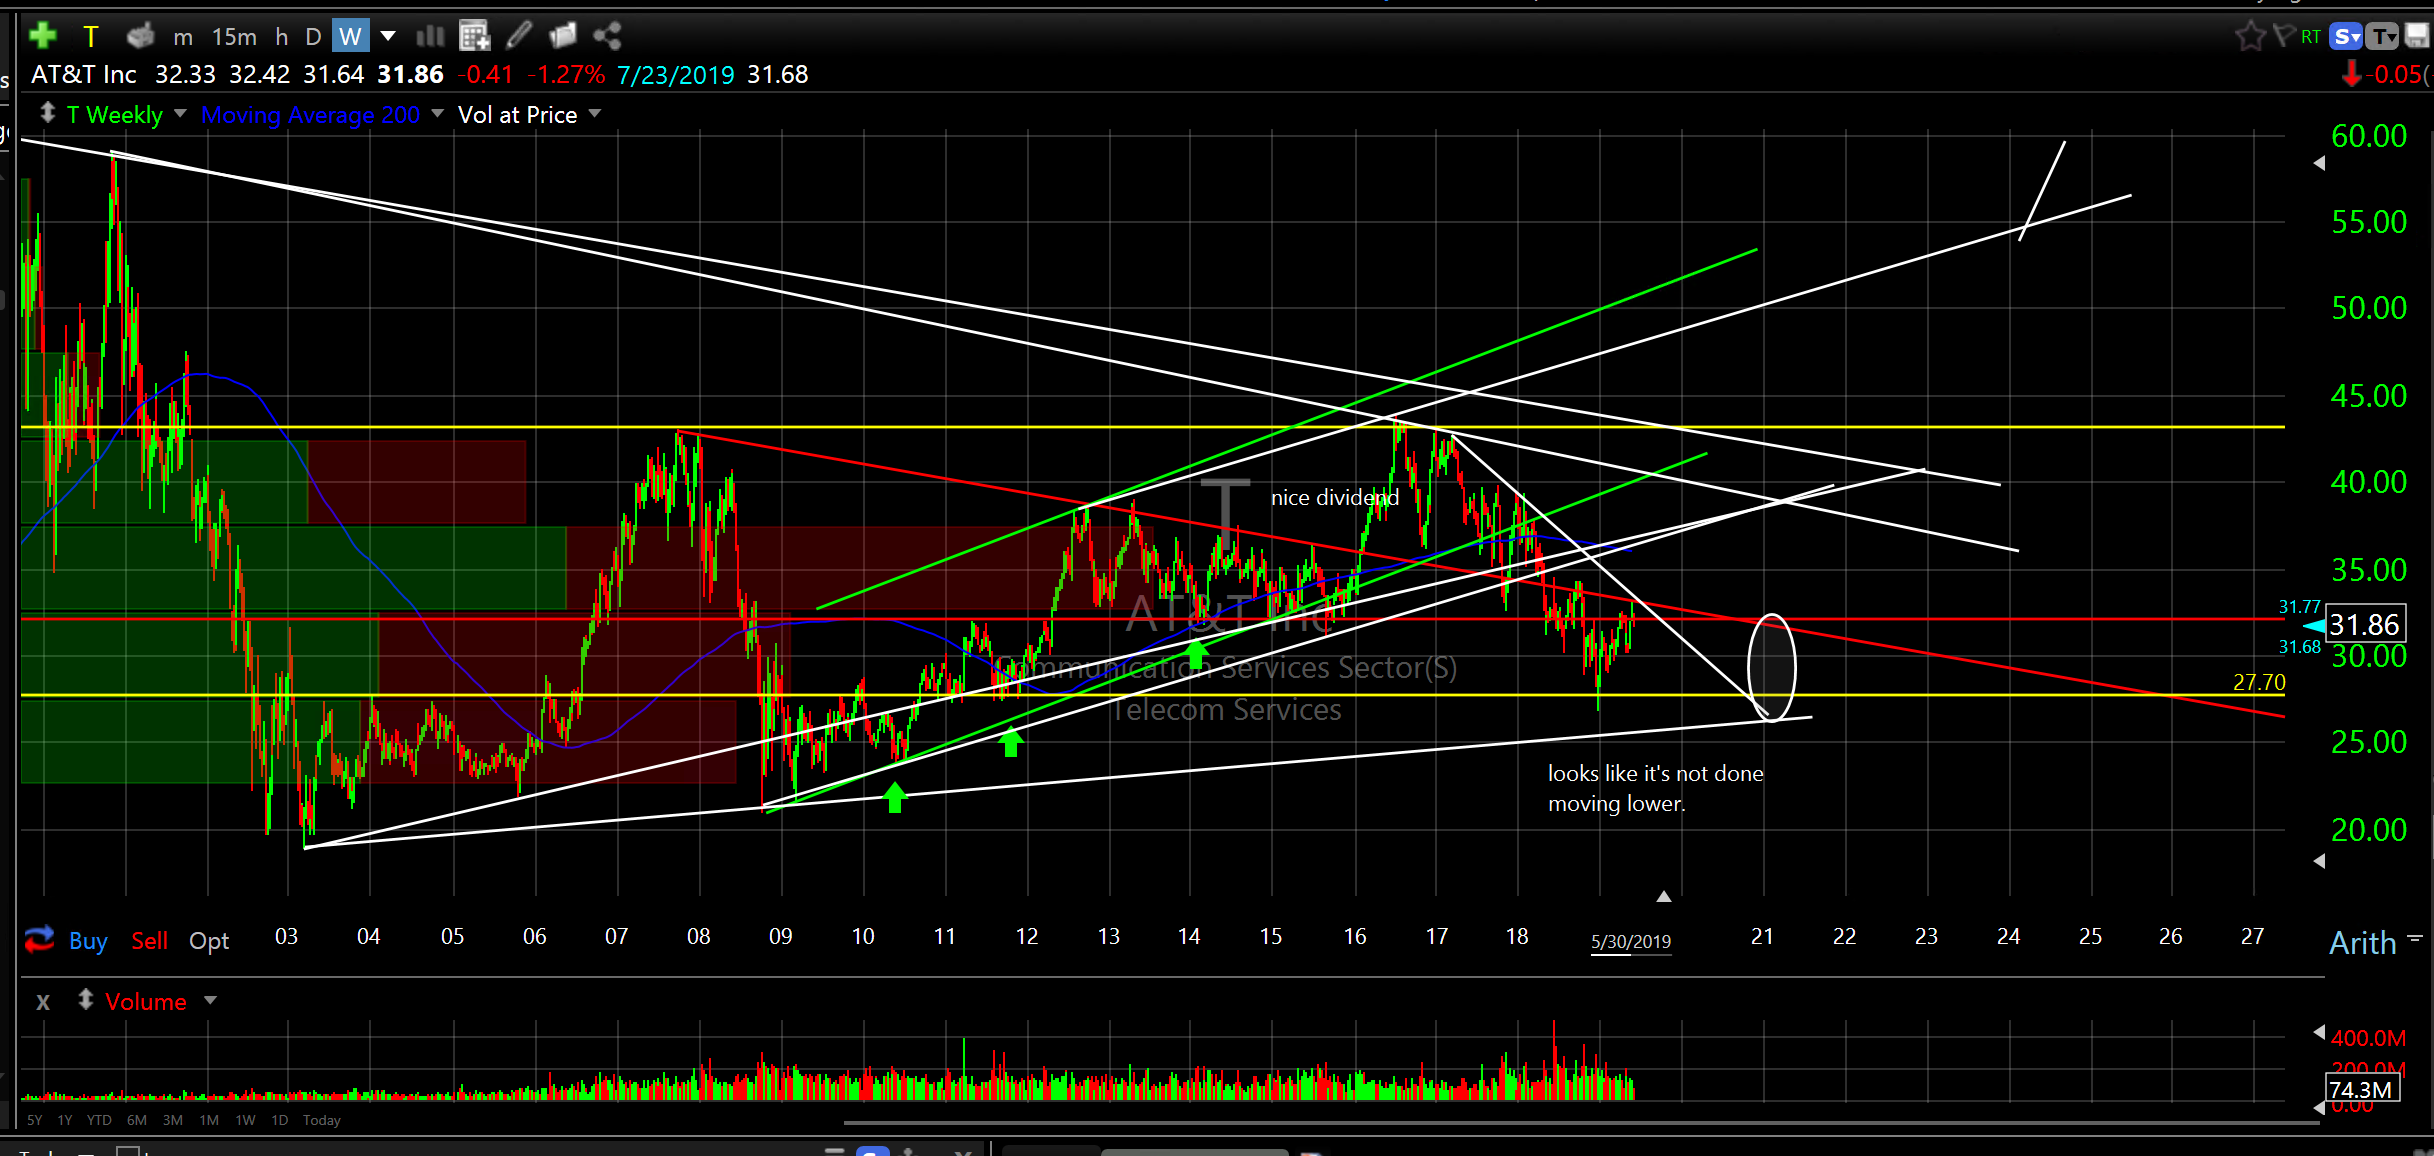
At&T Inc (T) weekly
Likely lower but nice dividend
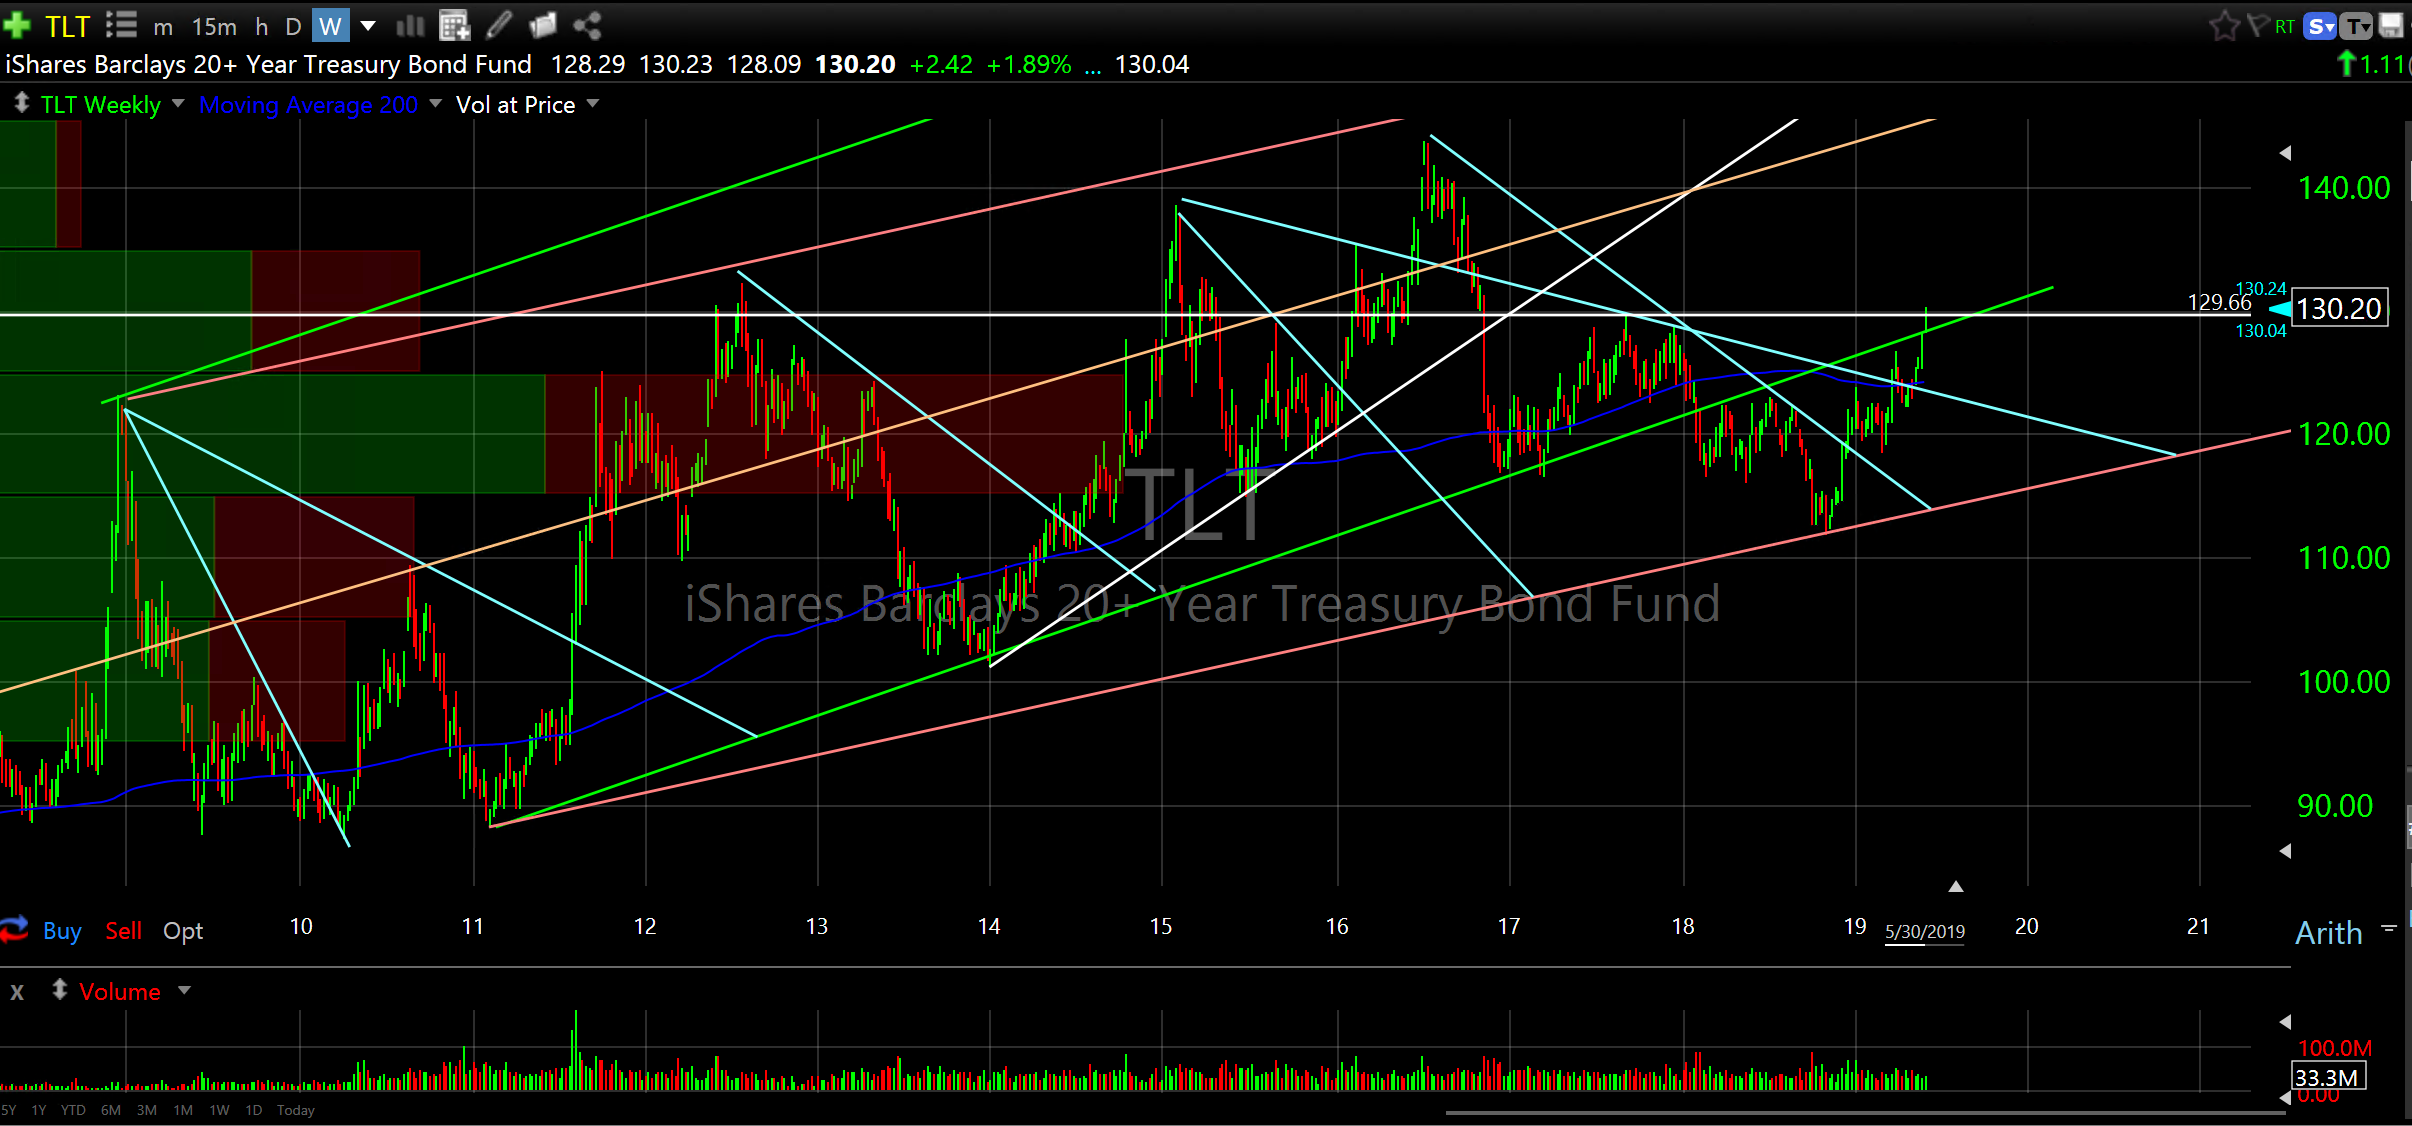
Barclay’s 20 year Treasury Bond Fund (TLT) weekly
Hard to argue against bullish…higher lows and higher highs long term.
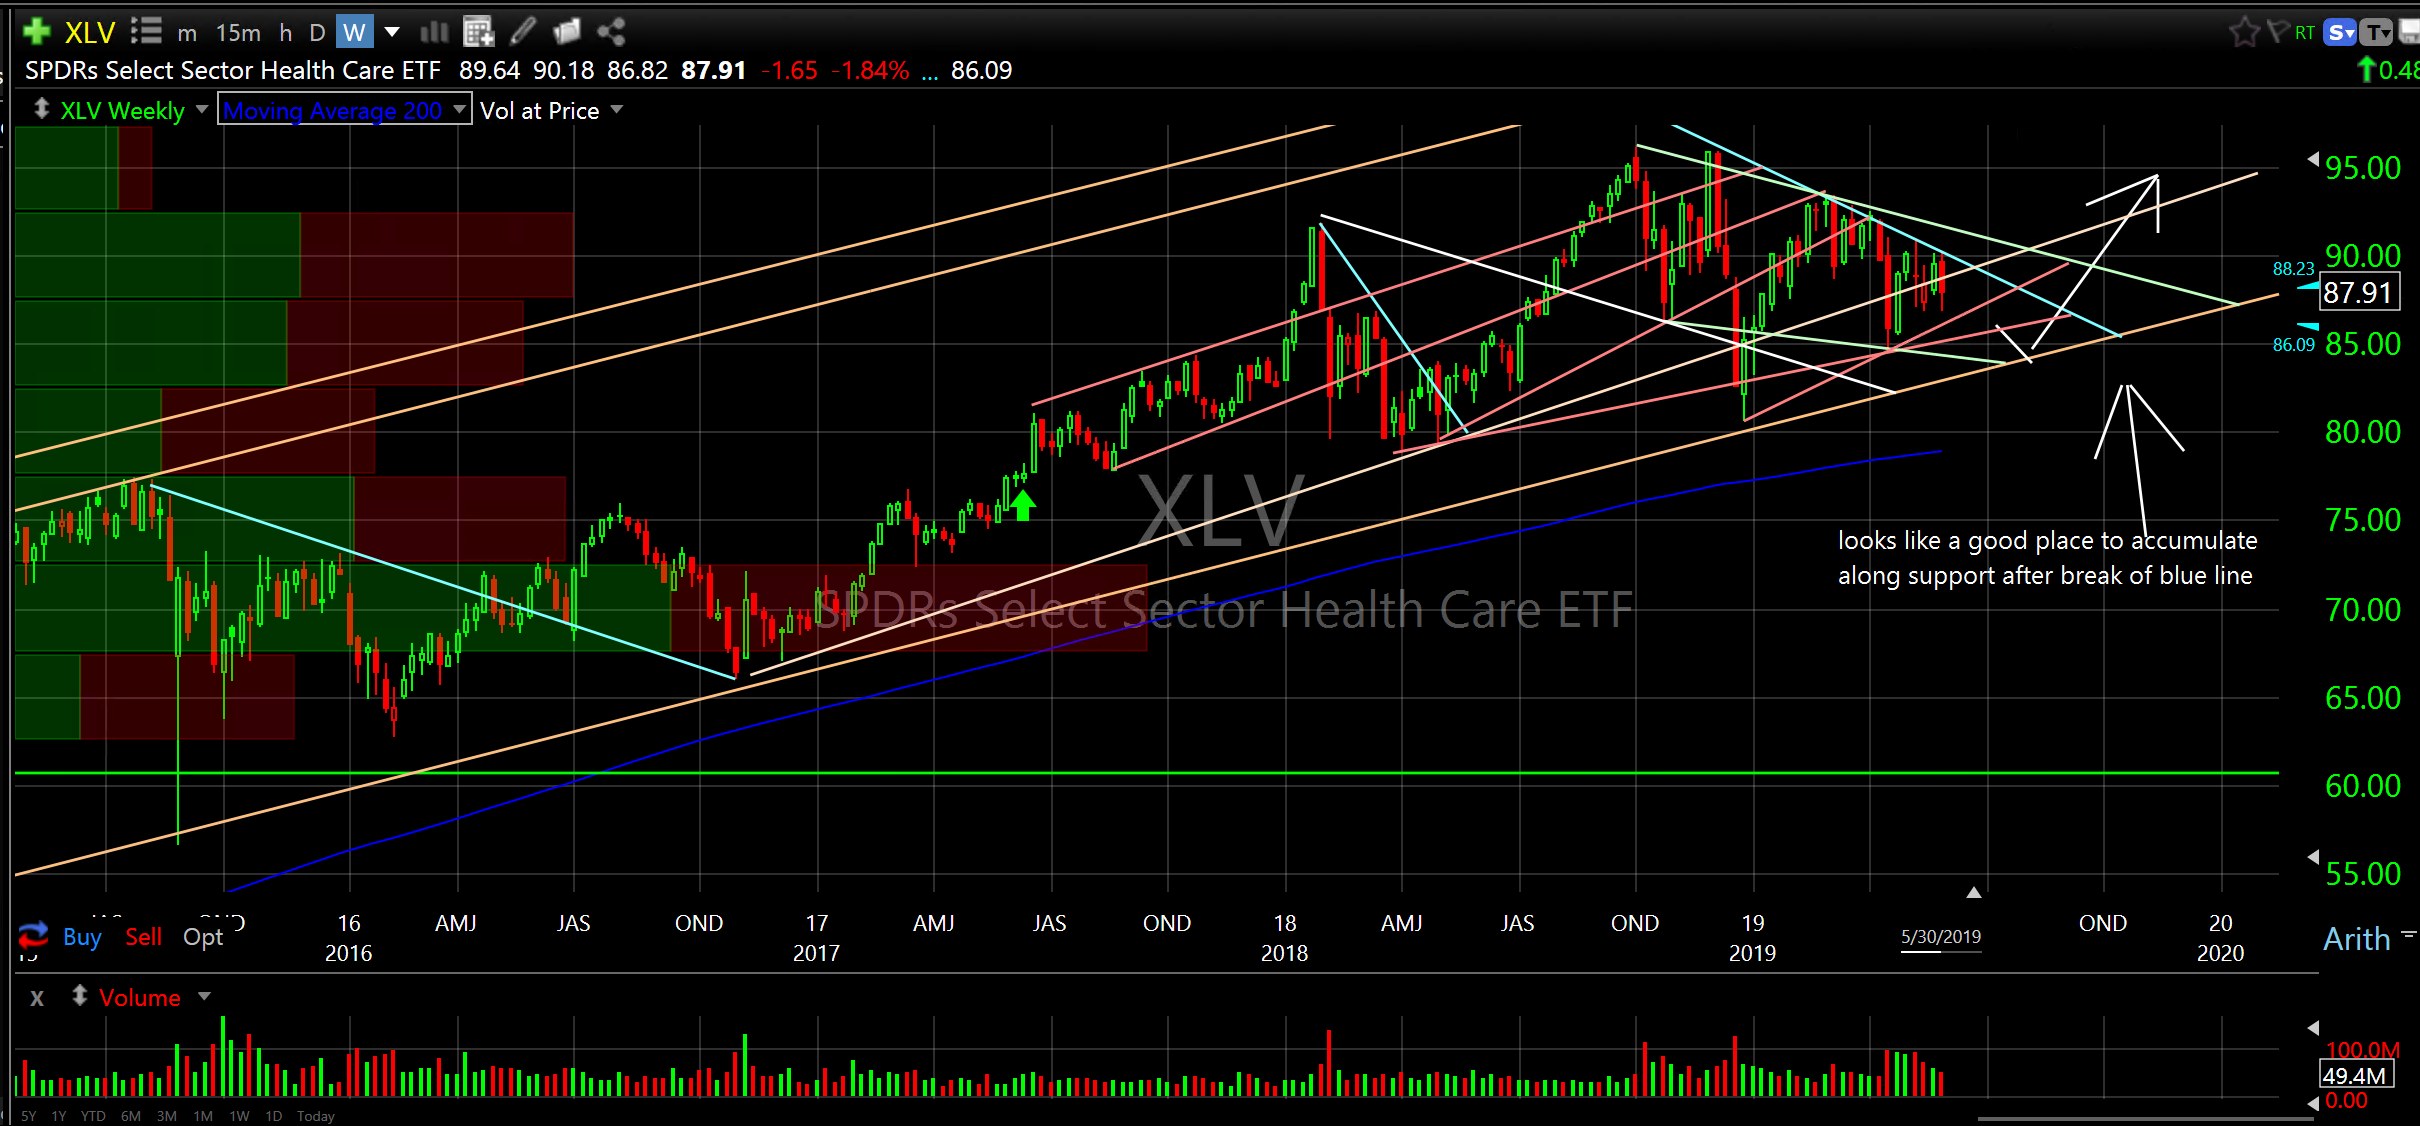
SPDR’s Select Sector Healthcare ETF (XLV) weekly
Nothing seems wrong here longer term.
If you have a particular stock/ETF that you would like charted just let me know as I probably already have it charted and if not I can build it pretty quickly.
Remember, when looking at charts I find it helpful to factor in the historical broader market to see the influence it has. The broader market can delay/change the “natural” movement of individual instruments.
Please do your due diligence.
Have a nice weekend,
Don