One chart will tell you all you need to know for the week…kind of. The 15 minute chart of the S&P 500 Index ETF (SPY) shows price action flatlined the entire week (I put the weeks price action inside the rectangle). This is good. This is miniature consolidation, a rest. This is normal.
Price action is often reflective. Oversold often results in overbought. Steep collapses often result in steep spikes. All of this recent “steepness” needs a break. Traders and investors alike need acclimation, like when climbing a mountain or scuba diving or getting used to 110 degrees in the desert, in the summer. yeah, it’s hot here! take me to the beach please. it’s actually beautiful (dry 90 degrees) but don’t tell anyone. I like the empty streets, golf courses and restaurants this time of year. Think of consolidation as acclimation.
SPDR’s S&P 500 Trust Series ETF (SPY) 15 min
(prior to close on Friday)
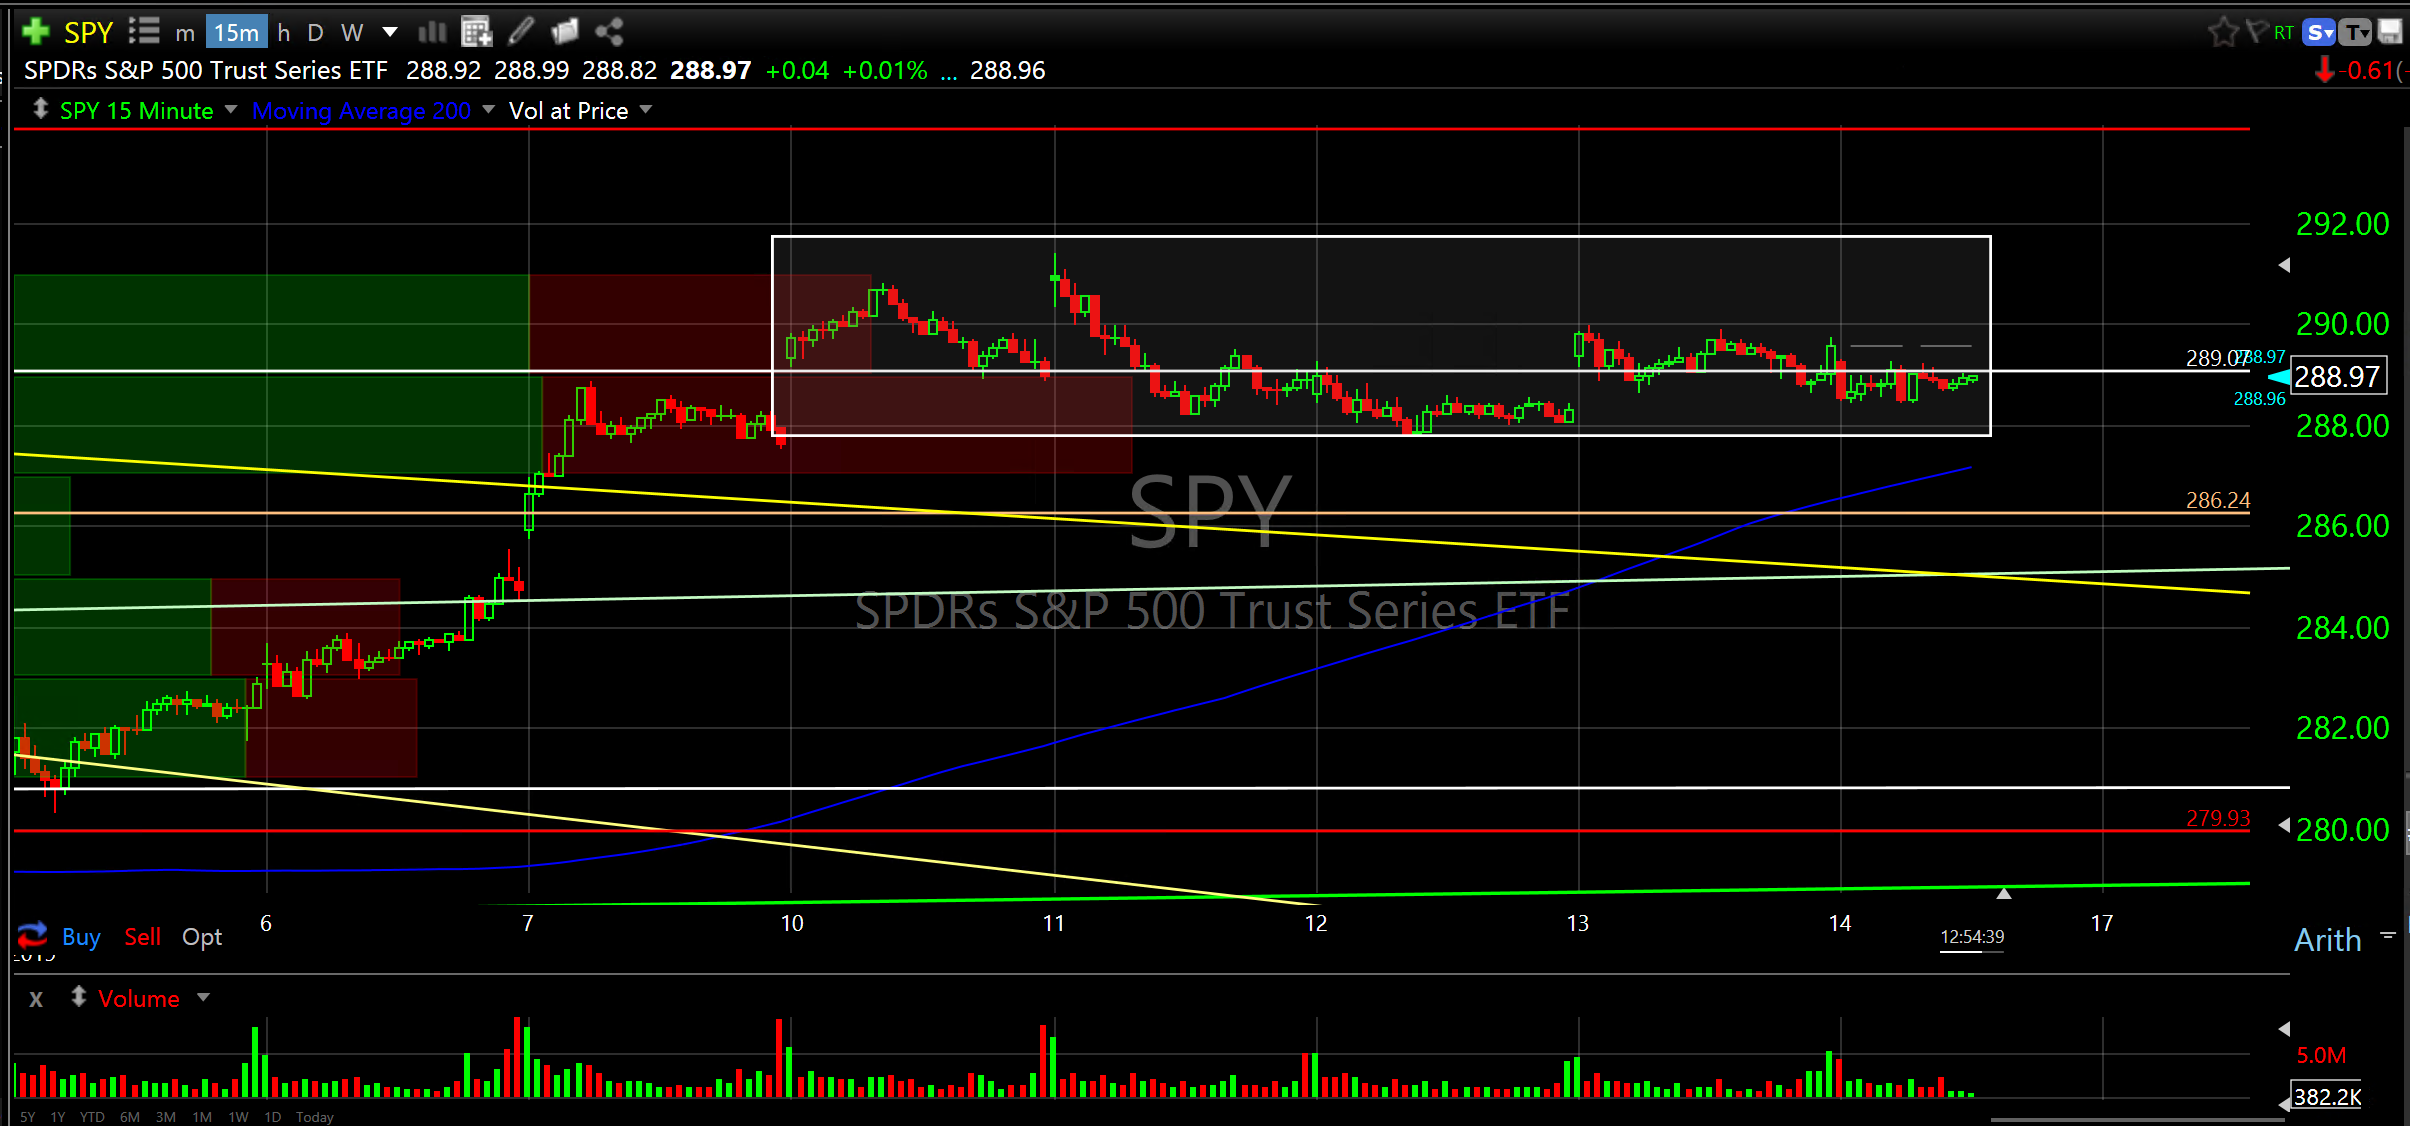
We have had a lot of “steep” recently and now price action needs a nap; consolidation. frankly, I could use a nap. Seriously, I think we are nearing a lower volatility expansionary cycle. The advance that really started in early 2016 became unsustainably steep in the later half of 2017 resulting in the early 2018 collapse, the summer recovery in 2018 then the larger collapse in late 2018 then the right side of the V shaped spike for the first third of this year and then the quick dip in May and now the quick rip this month. It is all very reflectionary. Who was that Newton guy?
I think everyone took a well deserved break this week. The short sellers must be exhausted. The bulls were ready to charge at lower support levels and need a rest and the penny flippers are probably out of pennies. So after all that SPY price is right back to where it was before all the drama began in early 2018. That was an exhausting year and a half for going nowhere. Whew!
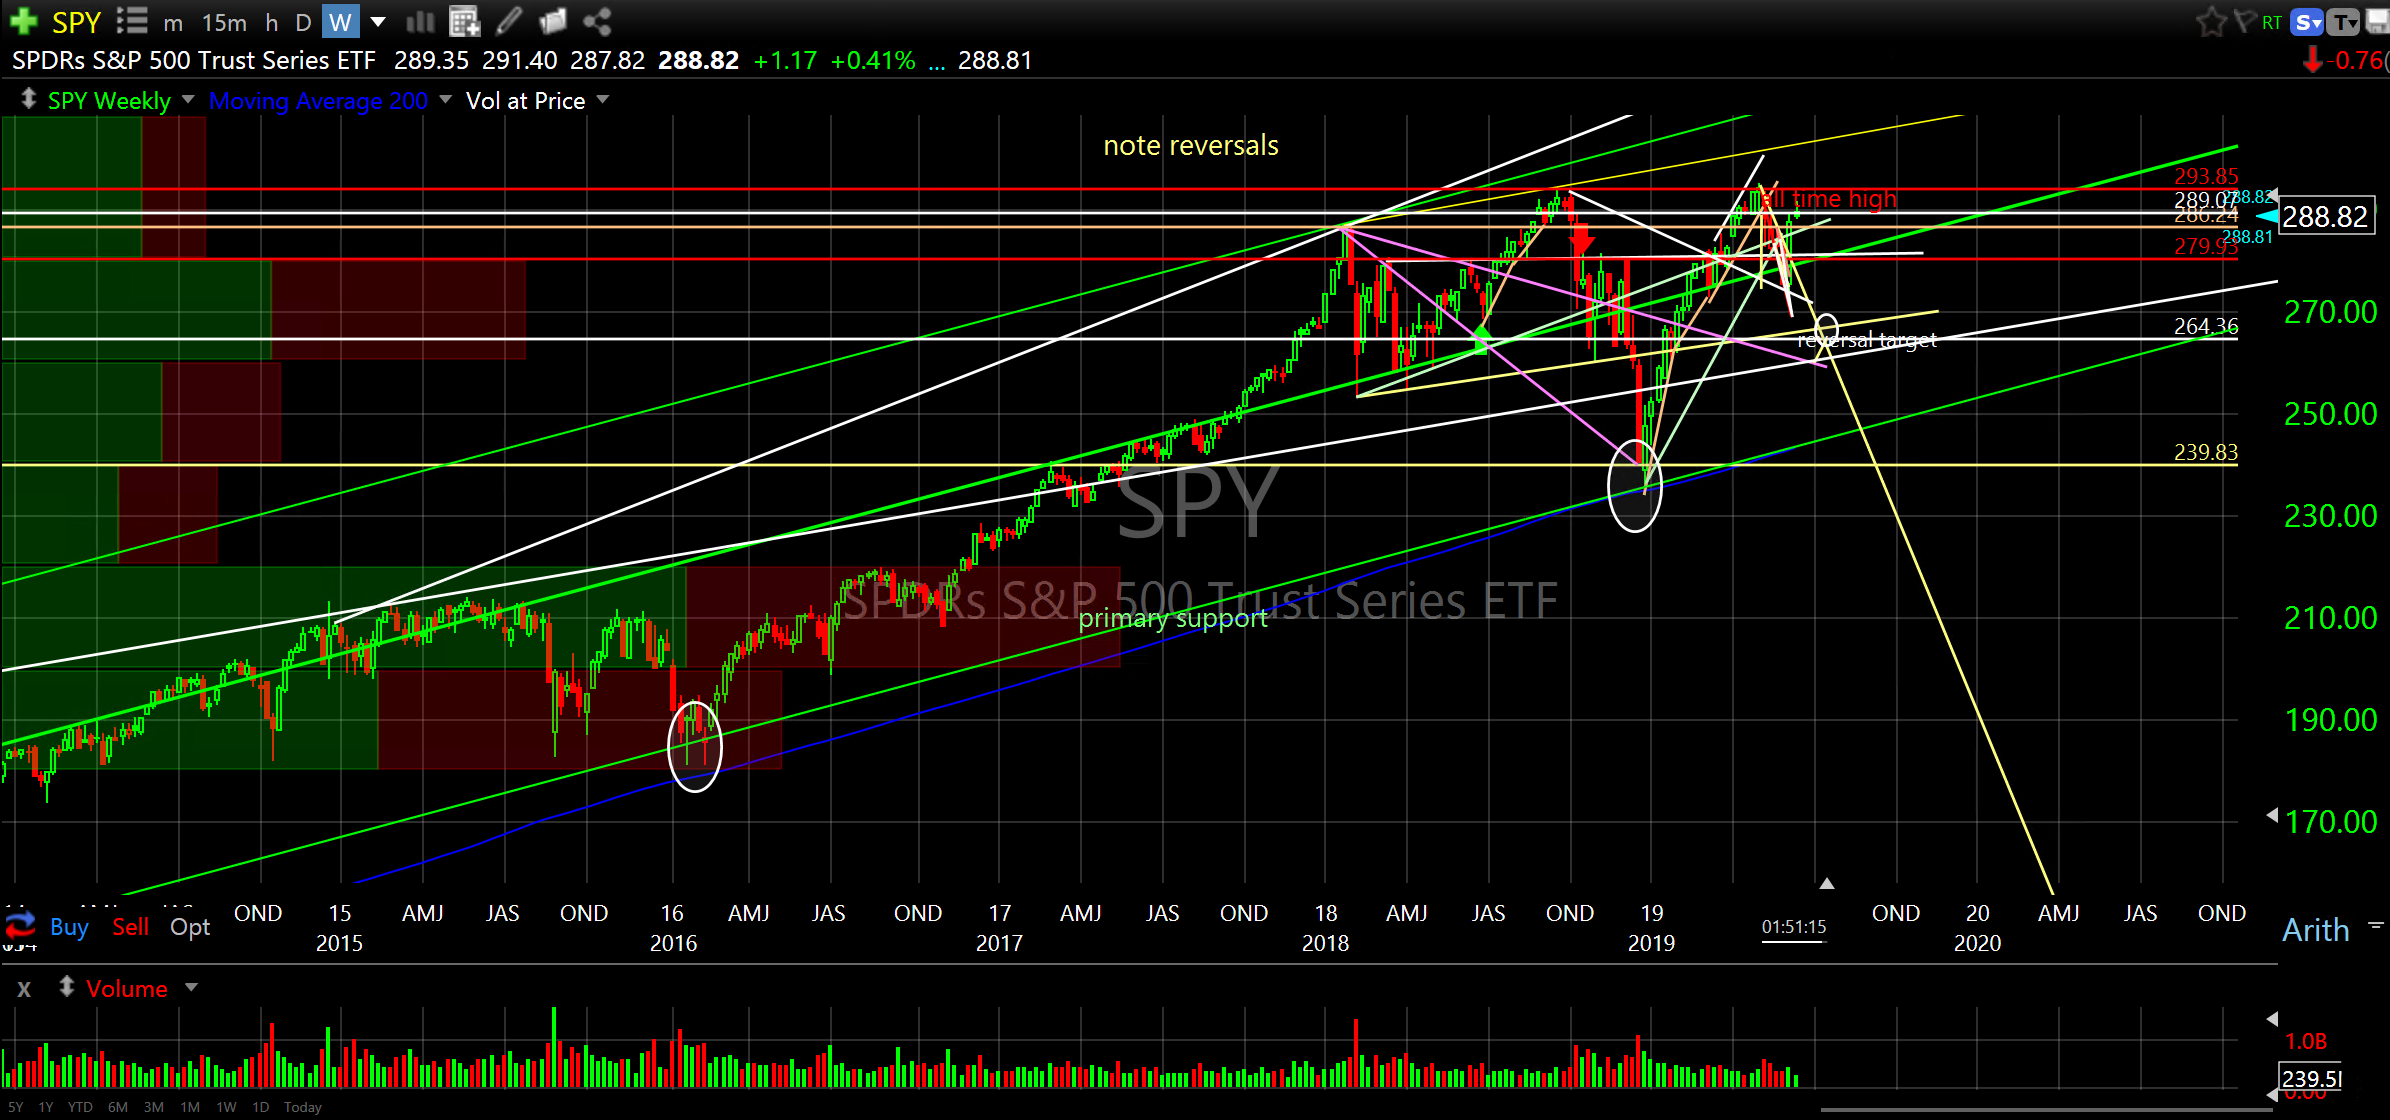
So, this week has been a mini consolidation. The past year and a half has been a mega consolidation, not too different from 2015/2016, just a little longer. Price tested and reversed at primary support (Dec 2018) which it hadn’t done since February 2016. A quick look at the weekly chart of SPY shows very similar price action off primary support then and now. Reversals higher off primary support is consistent with continued expansion. And, with continued expansion I would expect volatility to decrease just as it did in 2016 during that expansionary cycle.
SPDR’s S&P 500 Trust Series ETF (SPY) weekly
Remember, these are just my observations and opinions. I use these observations to help guide my actions. For the life of me though I will never understand investing without charts. Without charts there are no dots to connect. Literally!
OK, on to the good stuff. By the way… no exits this week. If you are uncomfortable with any position don’t wait for me to exit. Go for it. You should sleep well at night. Know your risk tolerance. I know, selling is not easy.
Here are a few charts I like this week…
YETI Holdings Inc (YETI) daily
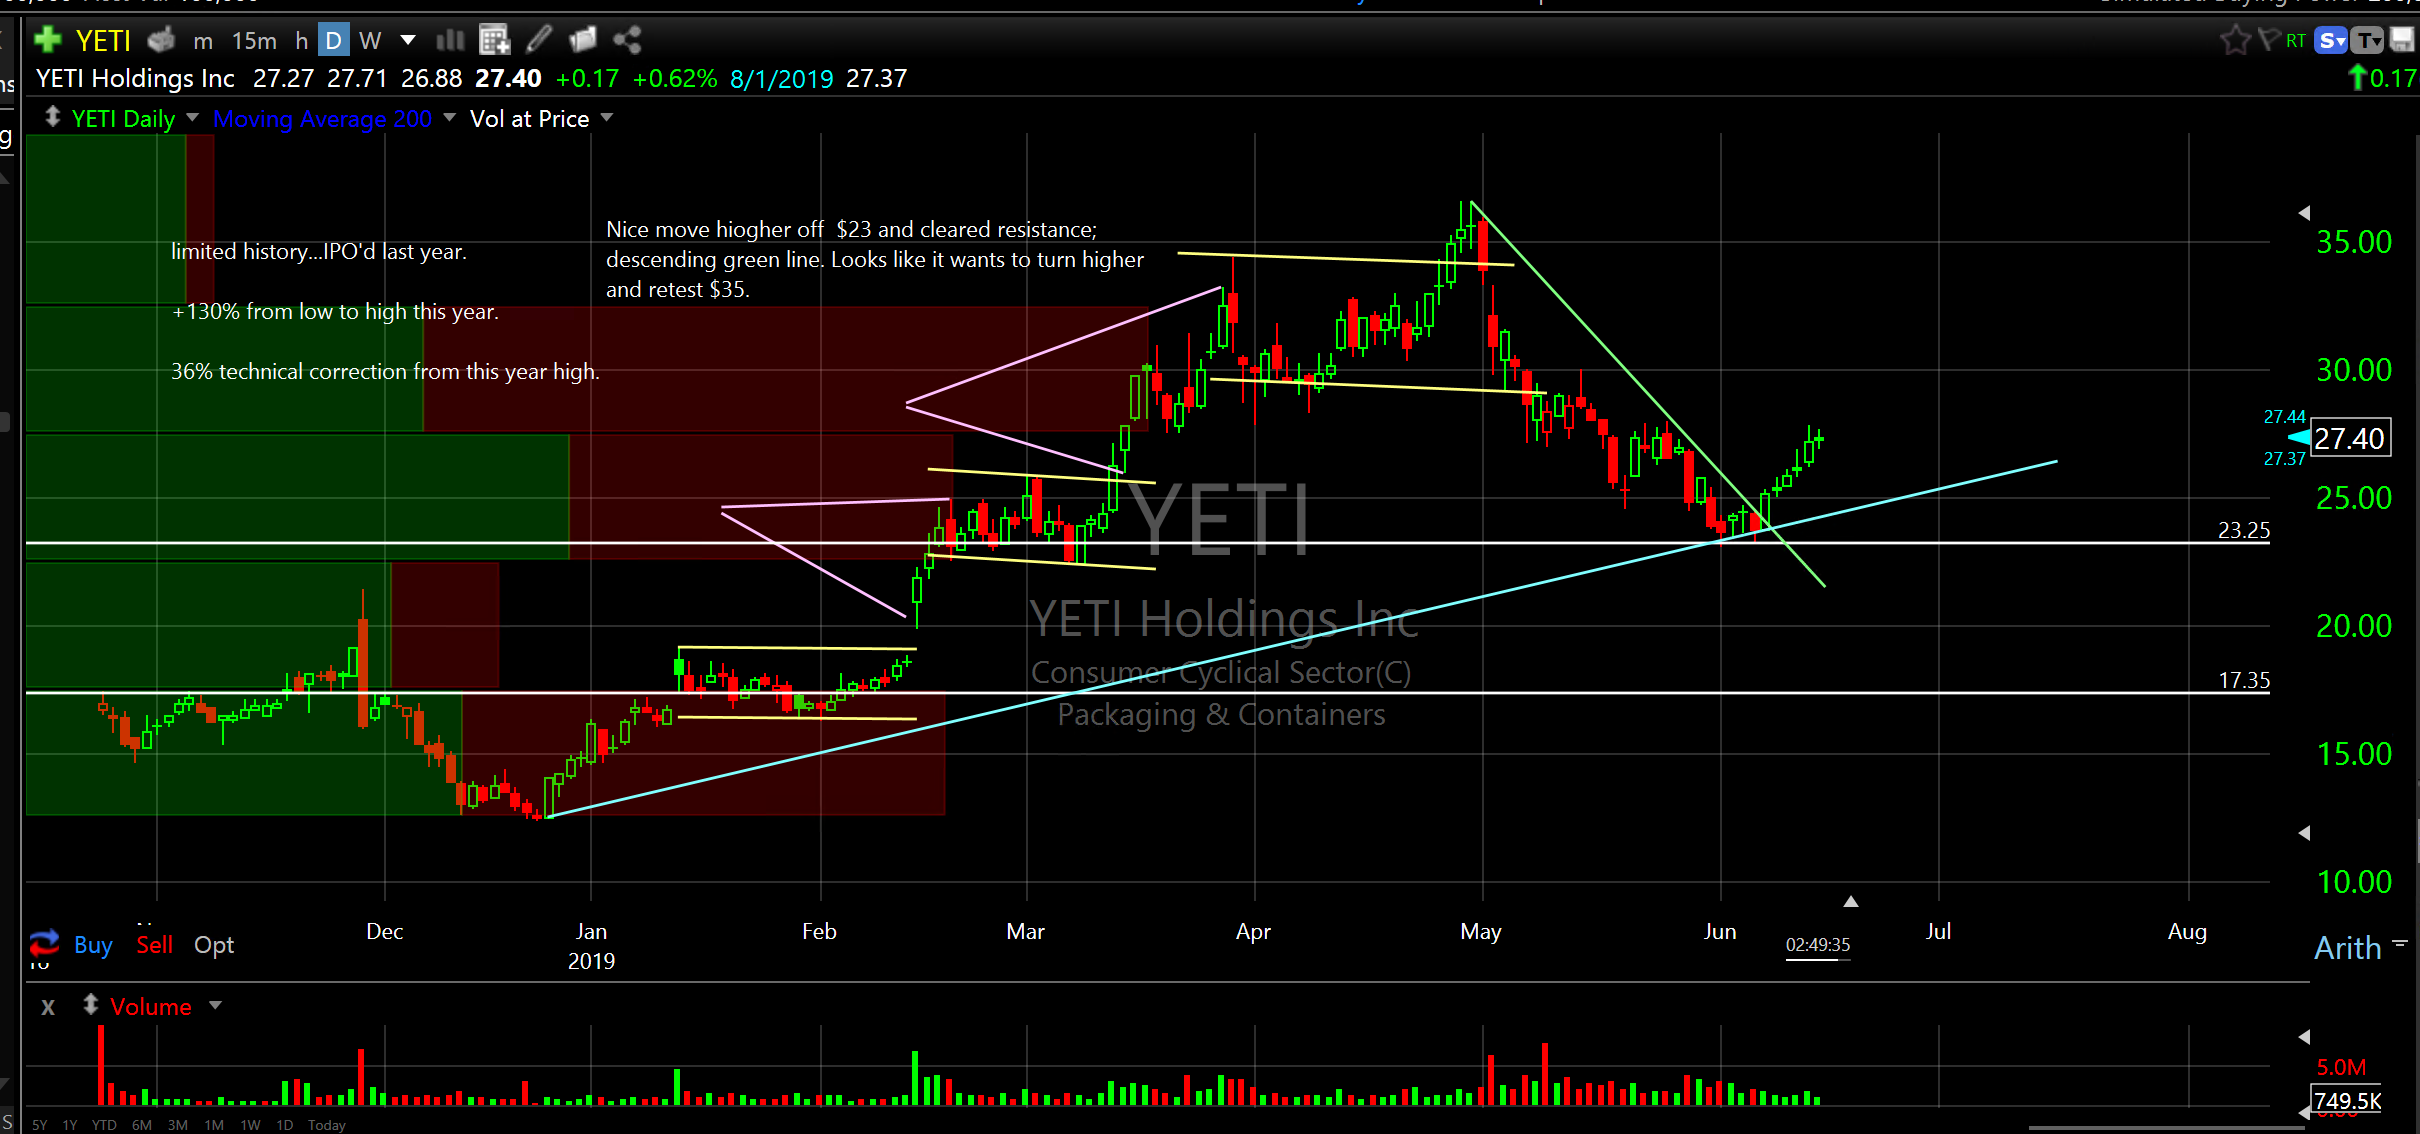
I love this chart. See notes on chart. Just bought some at 11:38pm Friday at $27.38. They have a lot of cool Fathers Day gifts. Just sayin’.
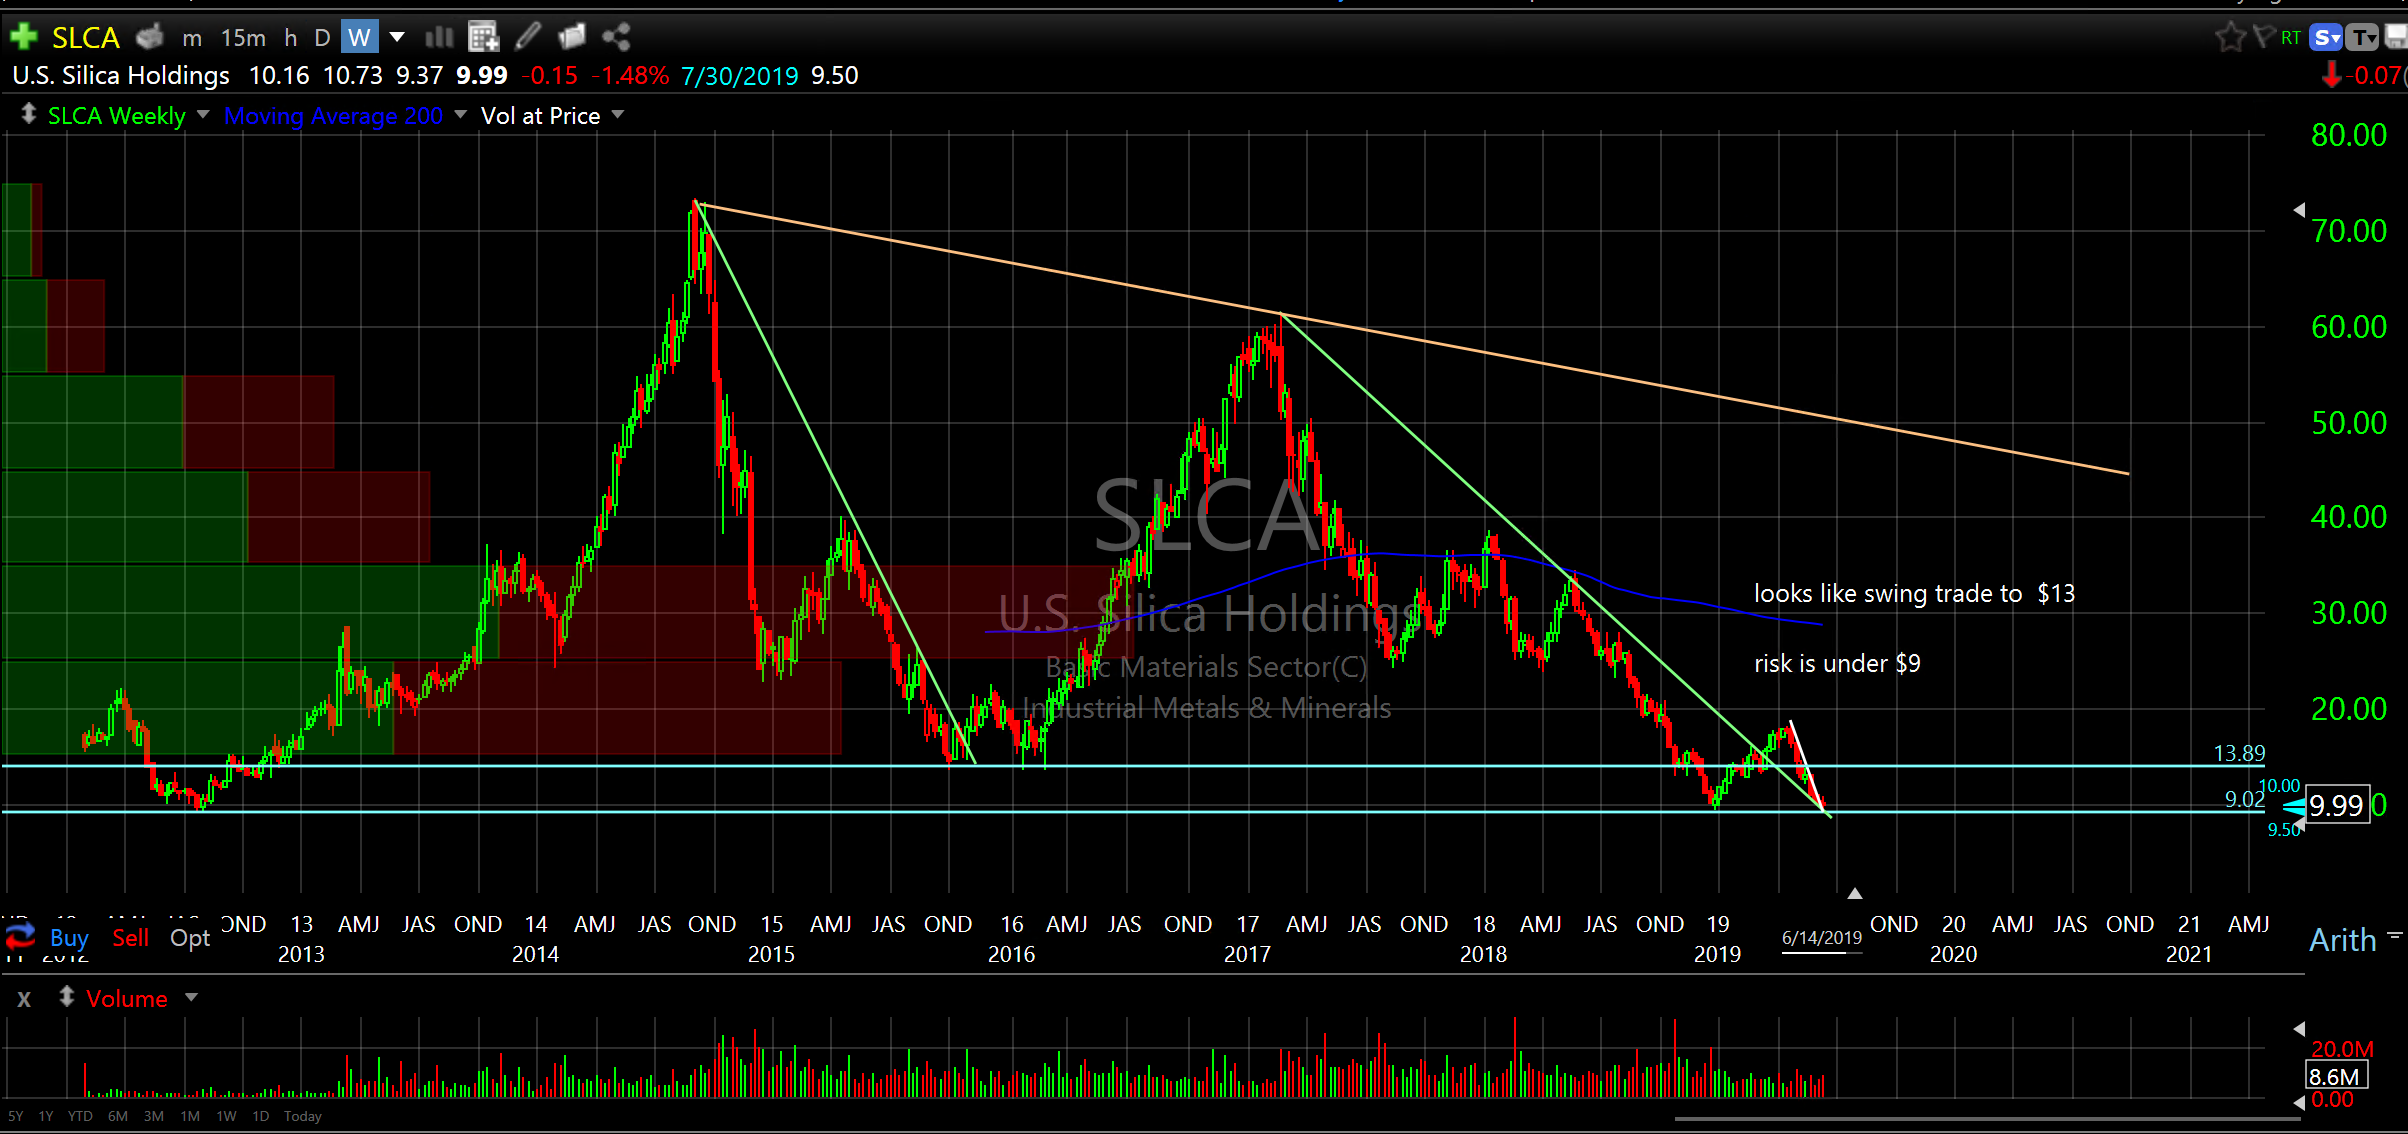
US Silica Holdings (SLCA) weekly
US Silica Holdings (SLCA) daily
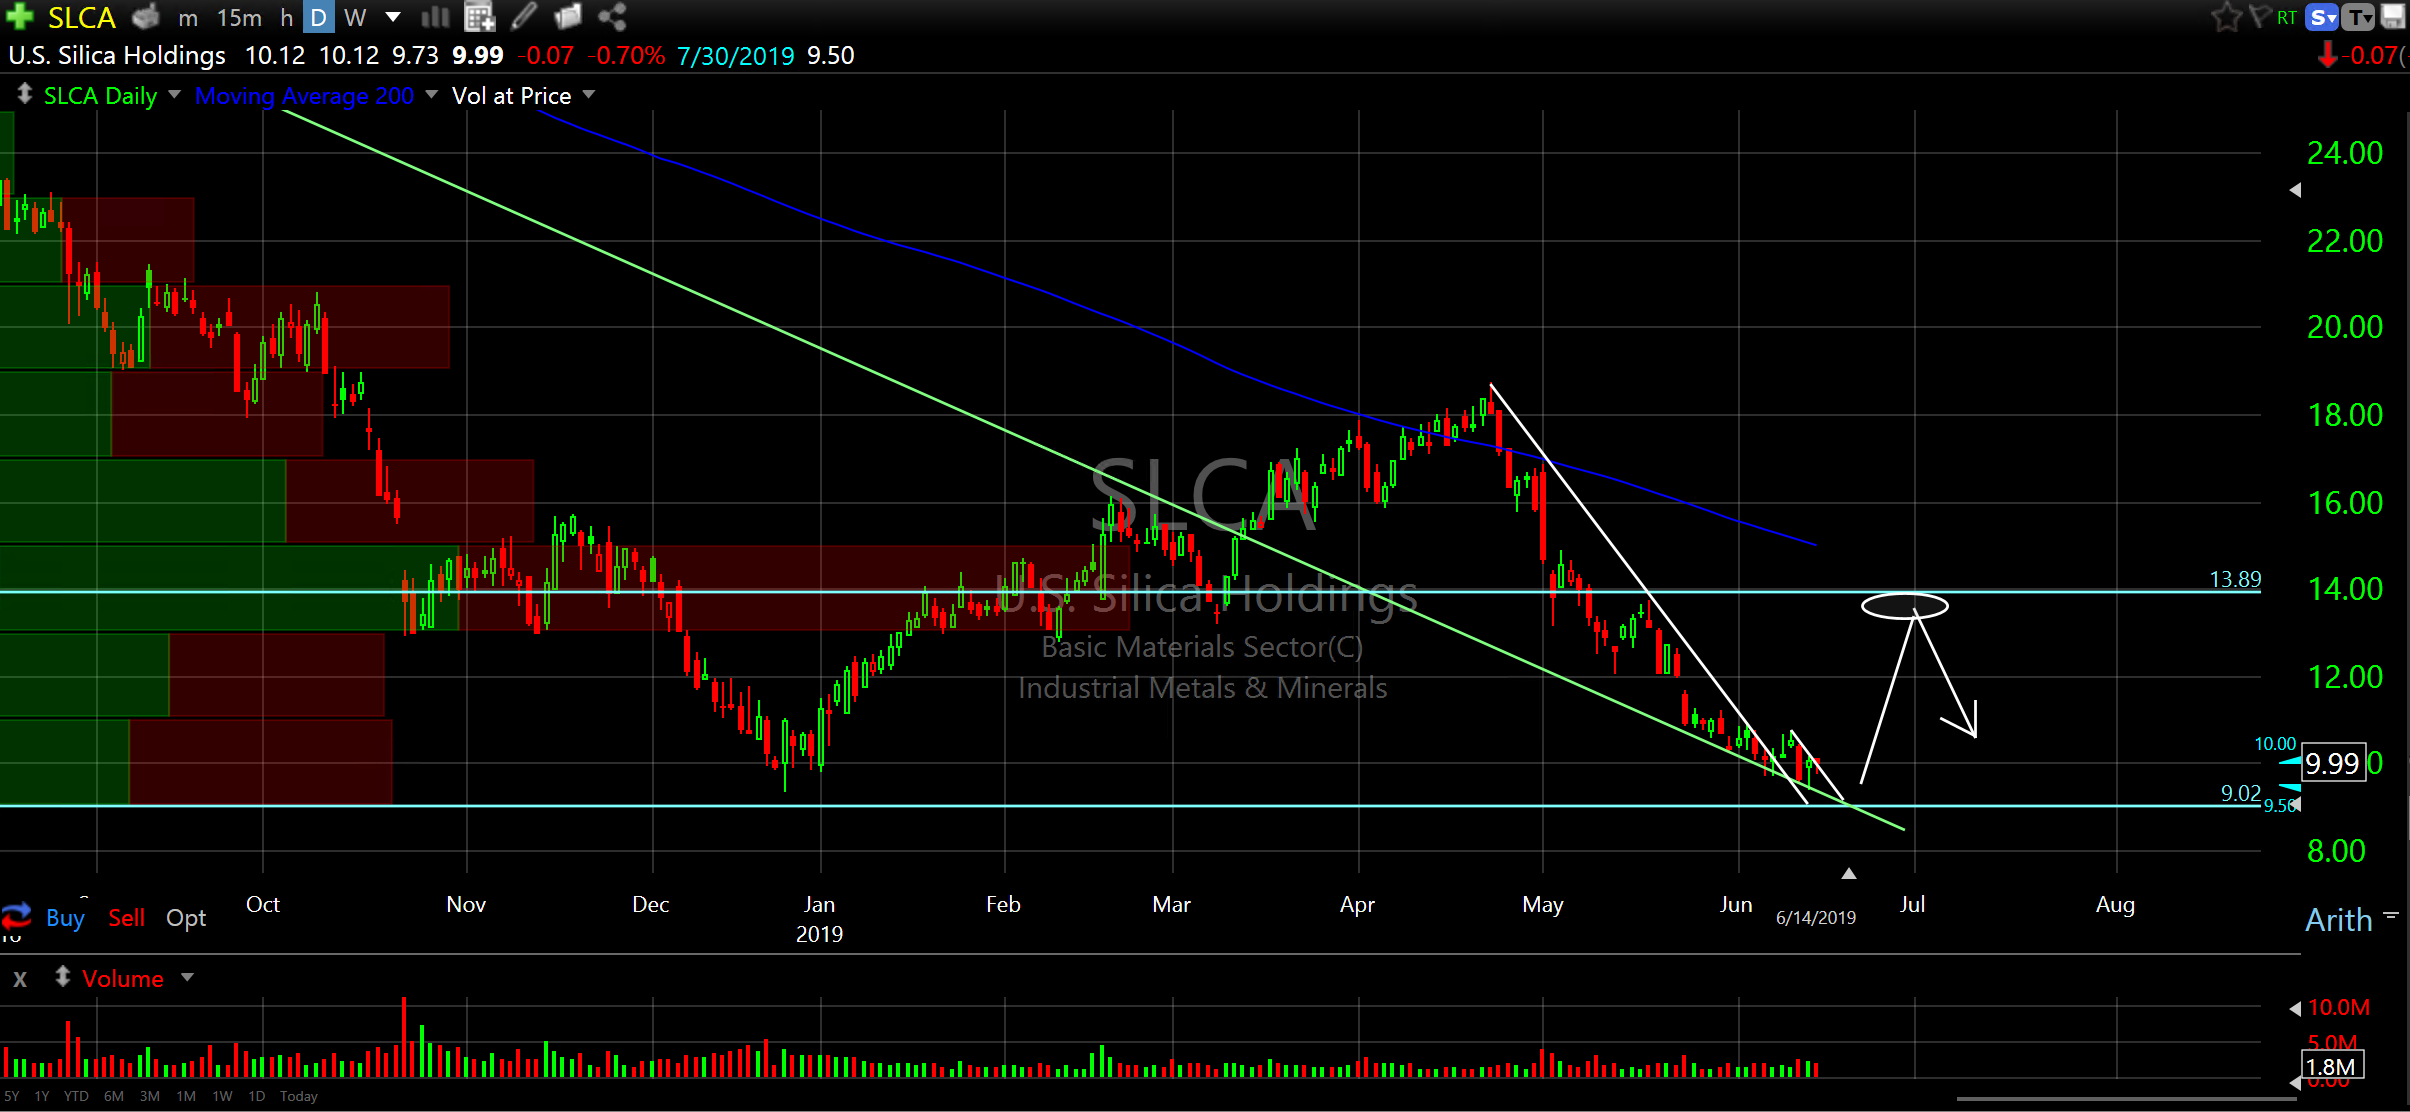
This is a swing trade set up. It’s getting down to the lows from 2012. This is a likely level for a short term reversal. Please note this is in a long term collapse so be aware of that. This is a short term spec play, if you are into this sort of thing. I generally don’t make these types of trades but I want you to be able to spot them as well. I would expect this to get a last gasp at $13 then reverse again. We can watch it play out together and I will send out a note if I buy it. Look at the two charts for different perspectives. Look at the daily chart and see how price looks like it wants to squeeze down into the wedges formed by the white, green and blue lines then reverse. See it?
Pinterest Inc (PINS) hourly
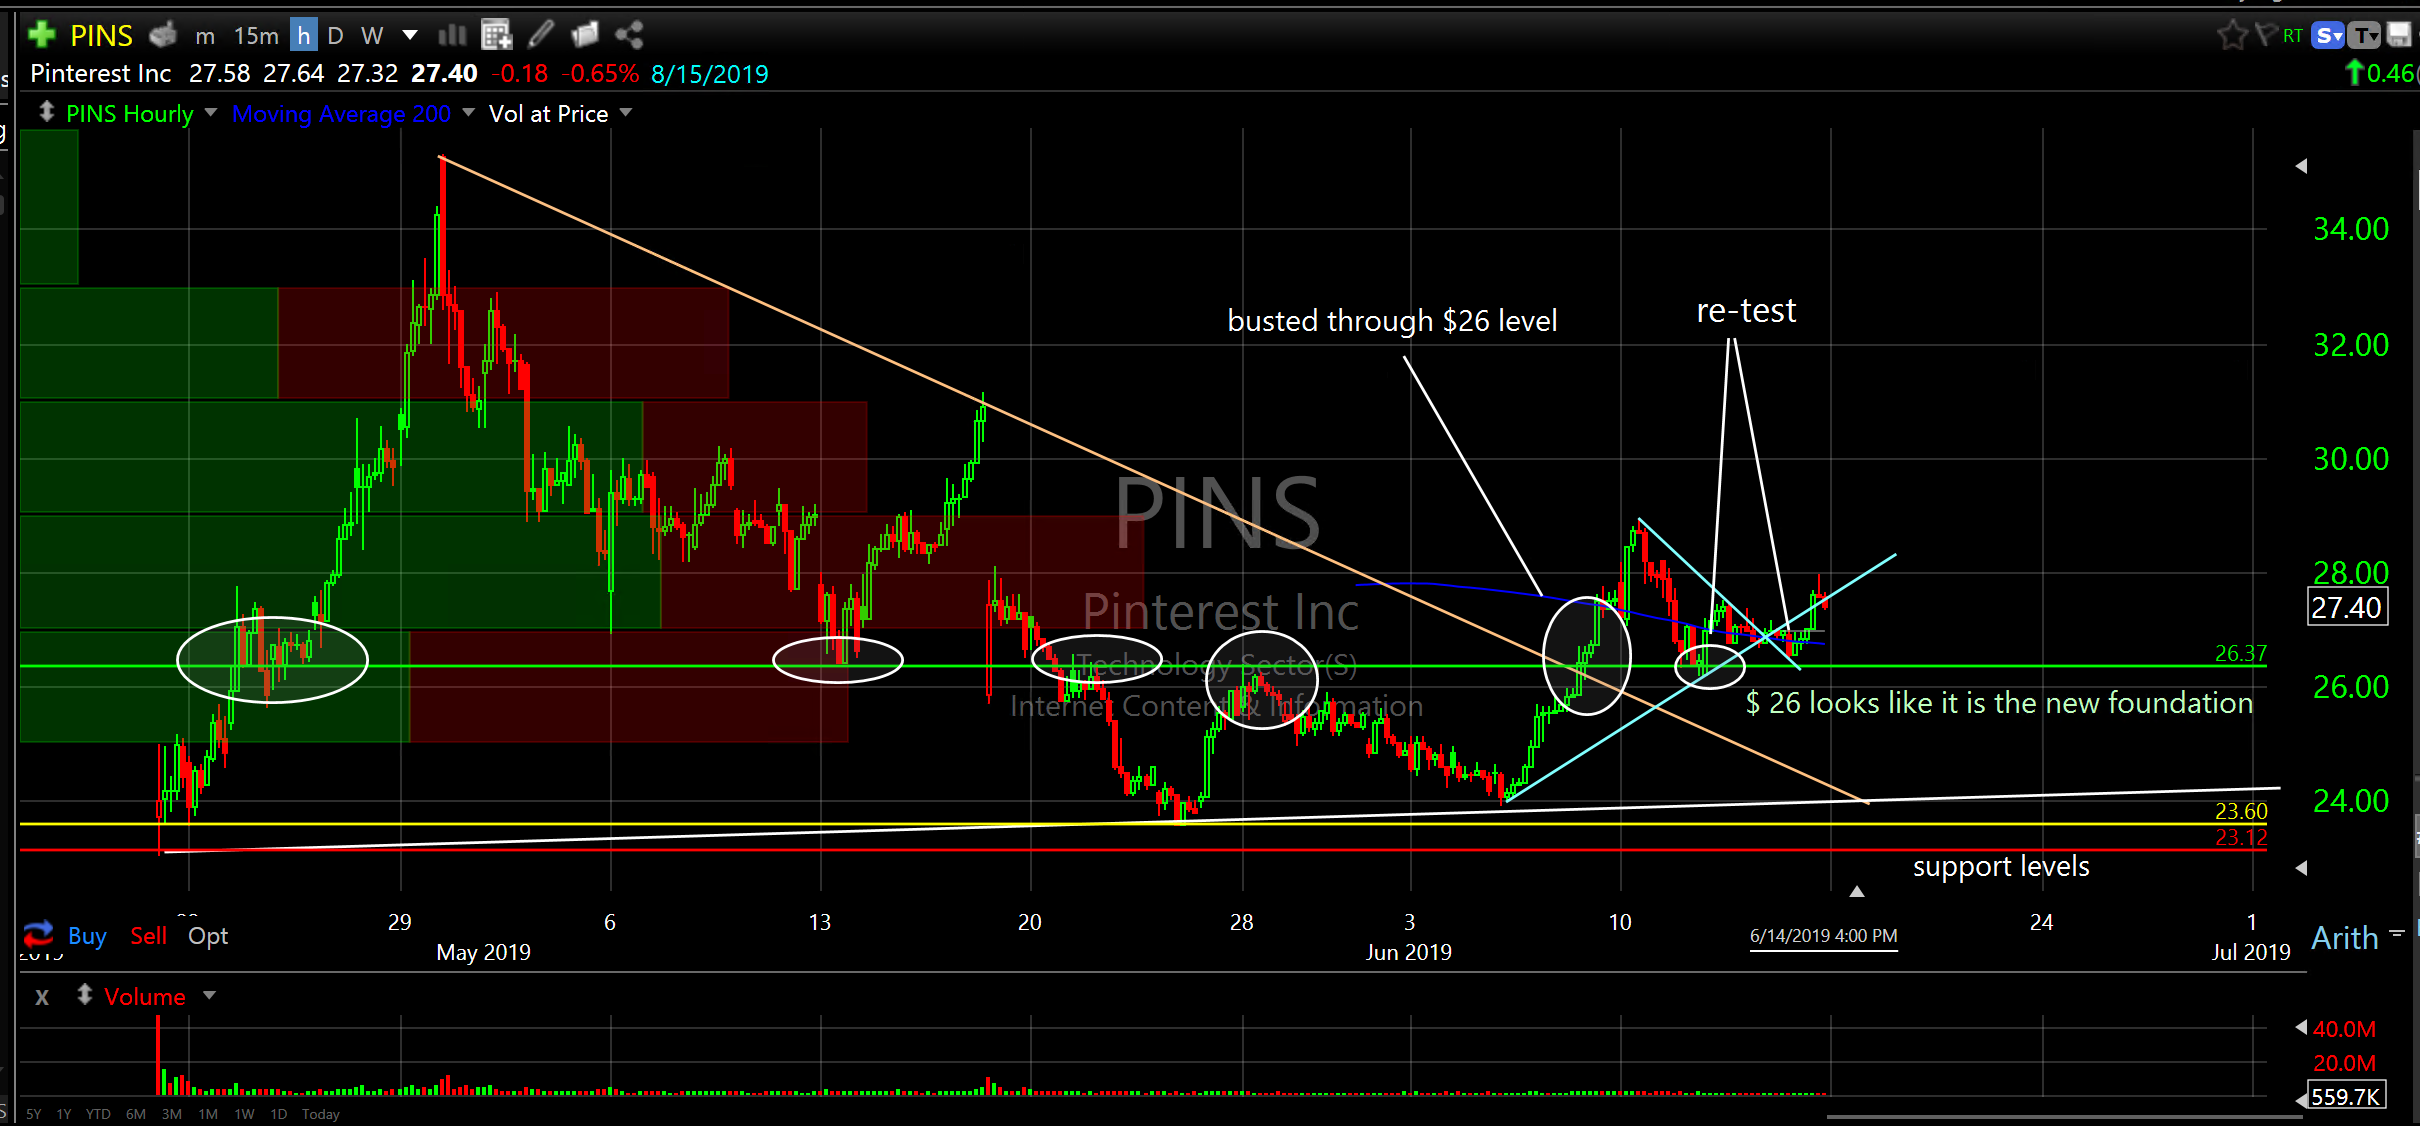
Pinterest (PINS) has my interest. (that’s got to be the worst line ever..haha) It IPO’d in April and after spiking 45% it collapsed all the way back down and has since reversed higher by about 13%. It appears to be basing at $26 which has been a consistent reversal level. See it? See how it ripped through $26 on Jun 7th and kept re-testing last week? It’s definitely trying to base there. Good risk/reward. Risk is under $6. I drew in all other support levels. Reward is the sky. Well, the first target is $34.
Square (SQ) daily
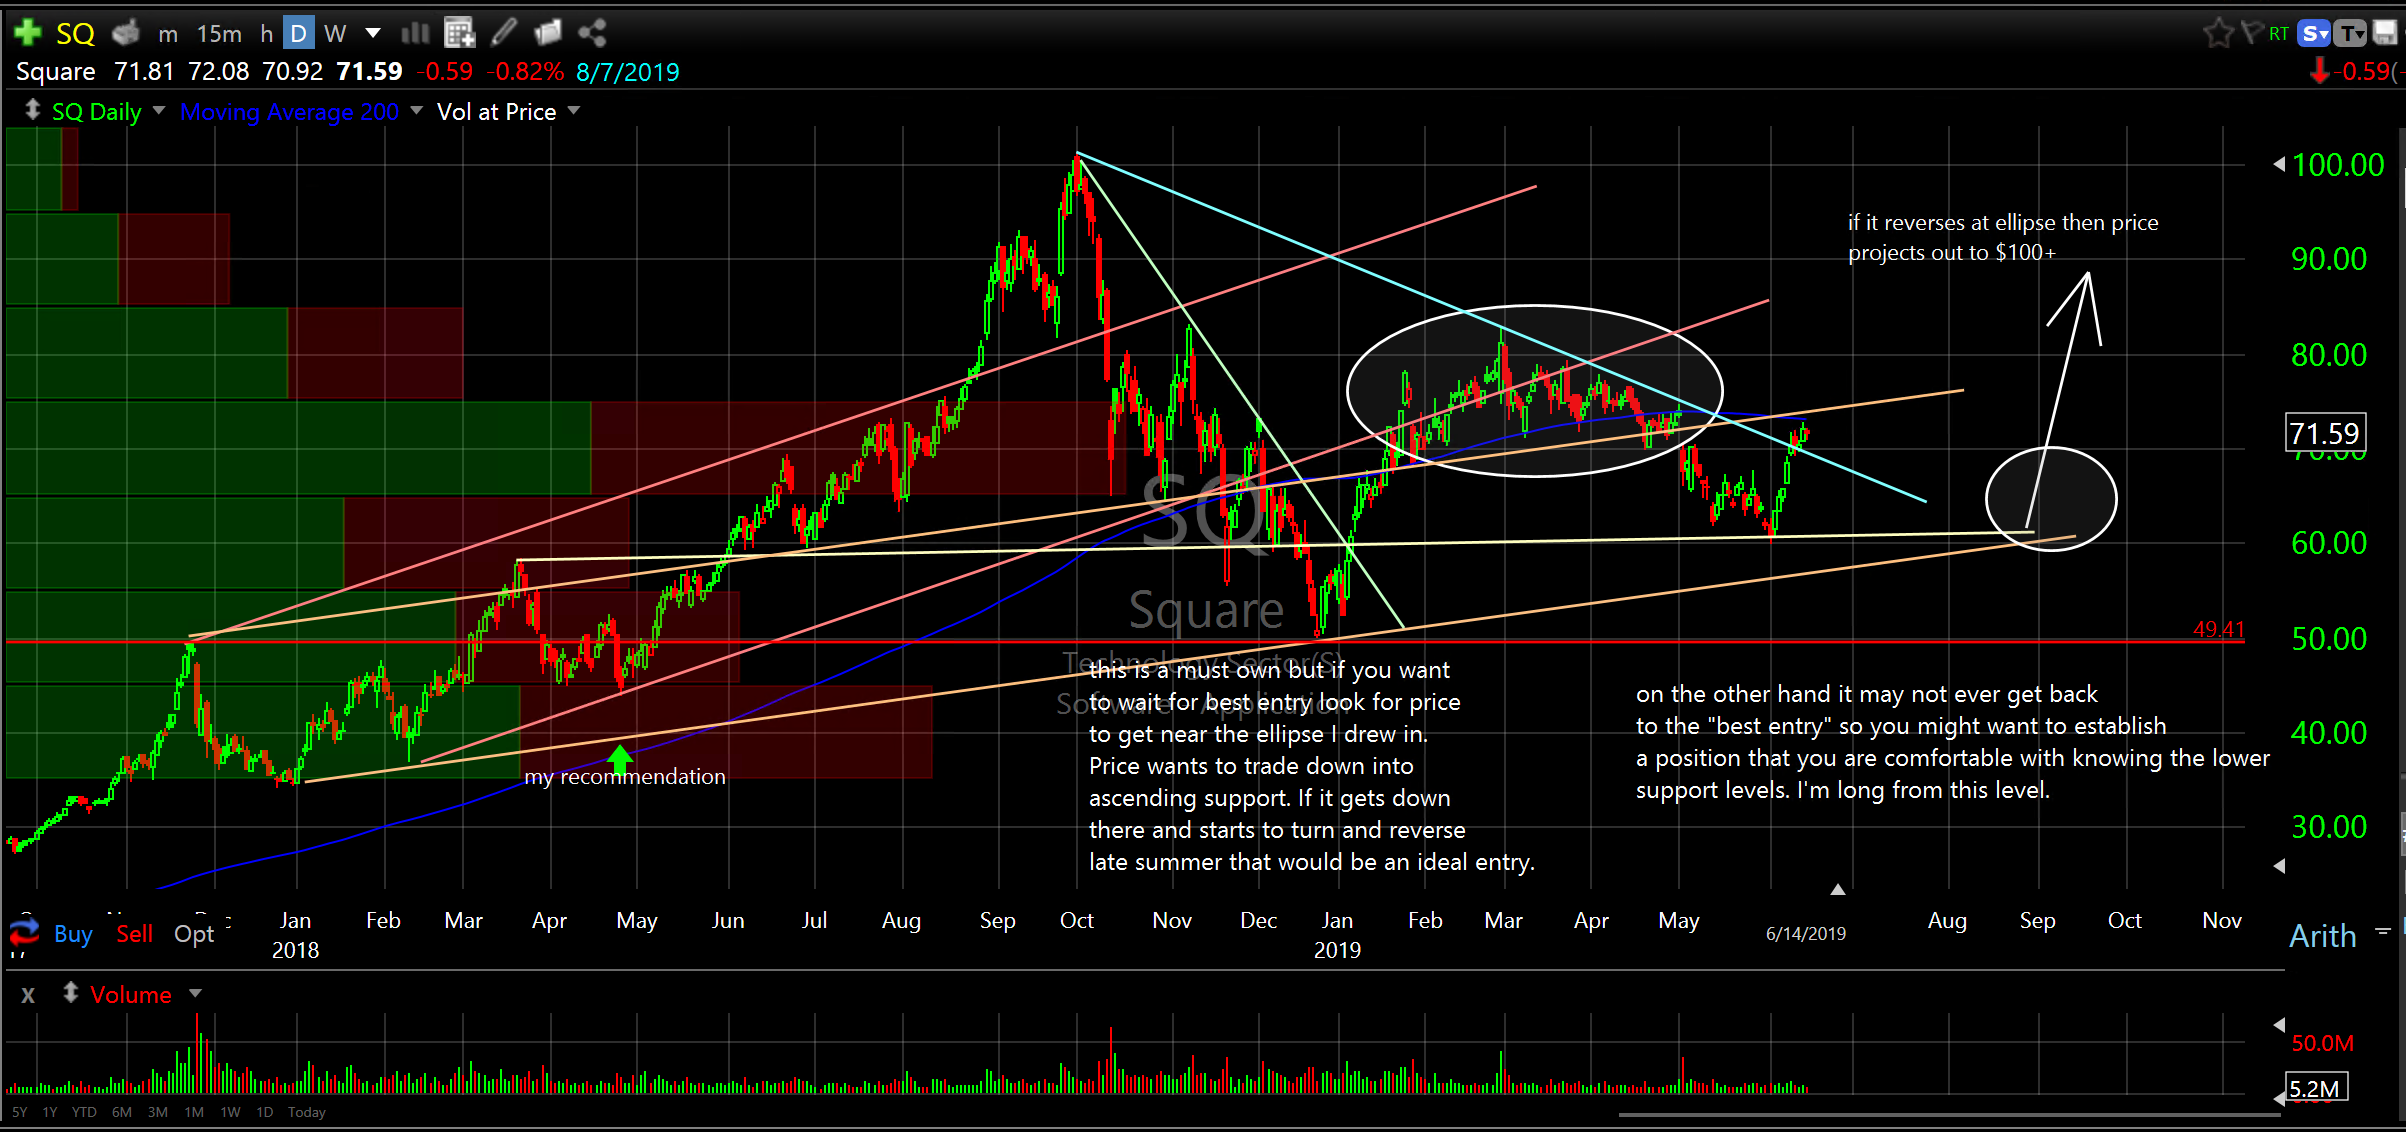
Square (SQ) is everywhere…hehe. Please see my notes on the chart. I think this is a long term hold for continued expansion. It corrected a whopping 50% during the late 2018 collapse but that’s after spiking more than 190% from the beginning of the year. Now it’s back to what appears to be equilibrium. A 50% retracement of the move higher in 2018 is about $68 and that is a very normal retracement for a reversal to take place and that is what seems to be happening after going beyond, snapping below and now possibly “acclimating”. there’s that word again…maybe I’m not acclimating to the heat and my brain is just on fire……… Price is trading just above that area now and has popped up through descending resistance. I would expect a little dip to take out the penney flippers then on to another expansion cycle. I have drawn in the support levels. I am long.
JB Hunt Transport Services (JBHT) weekly
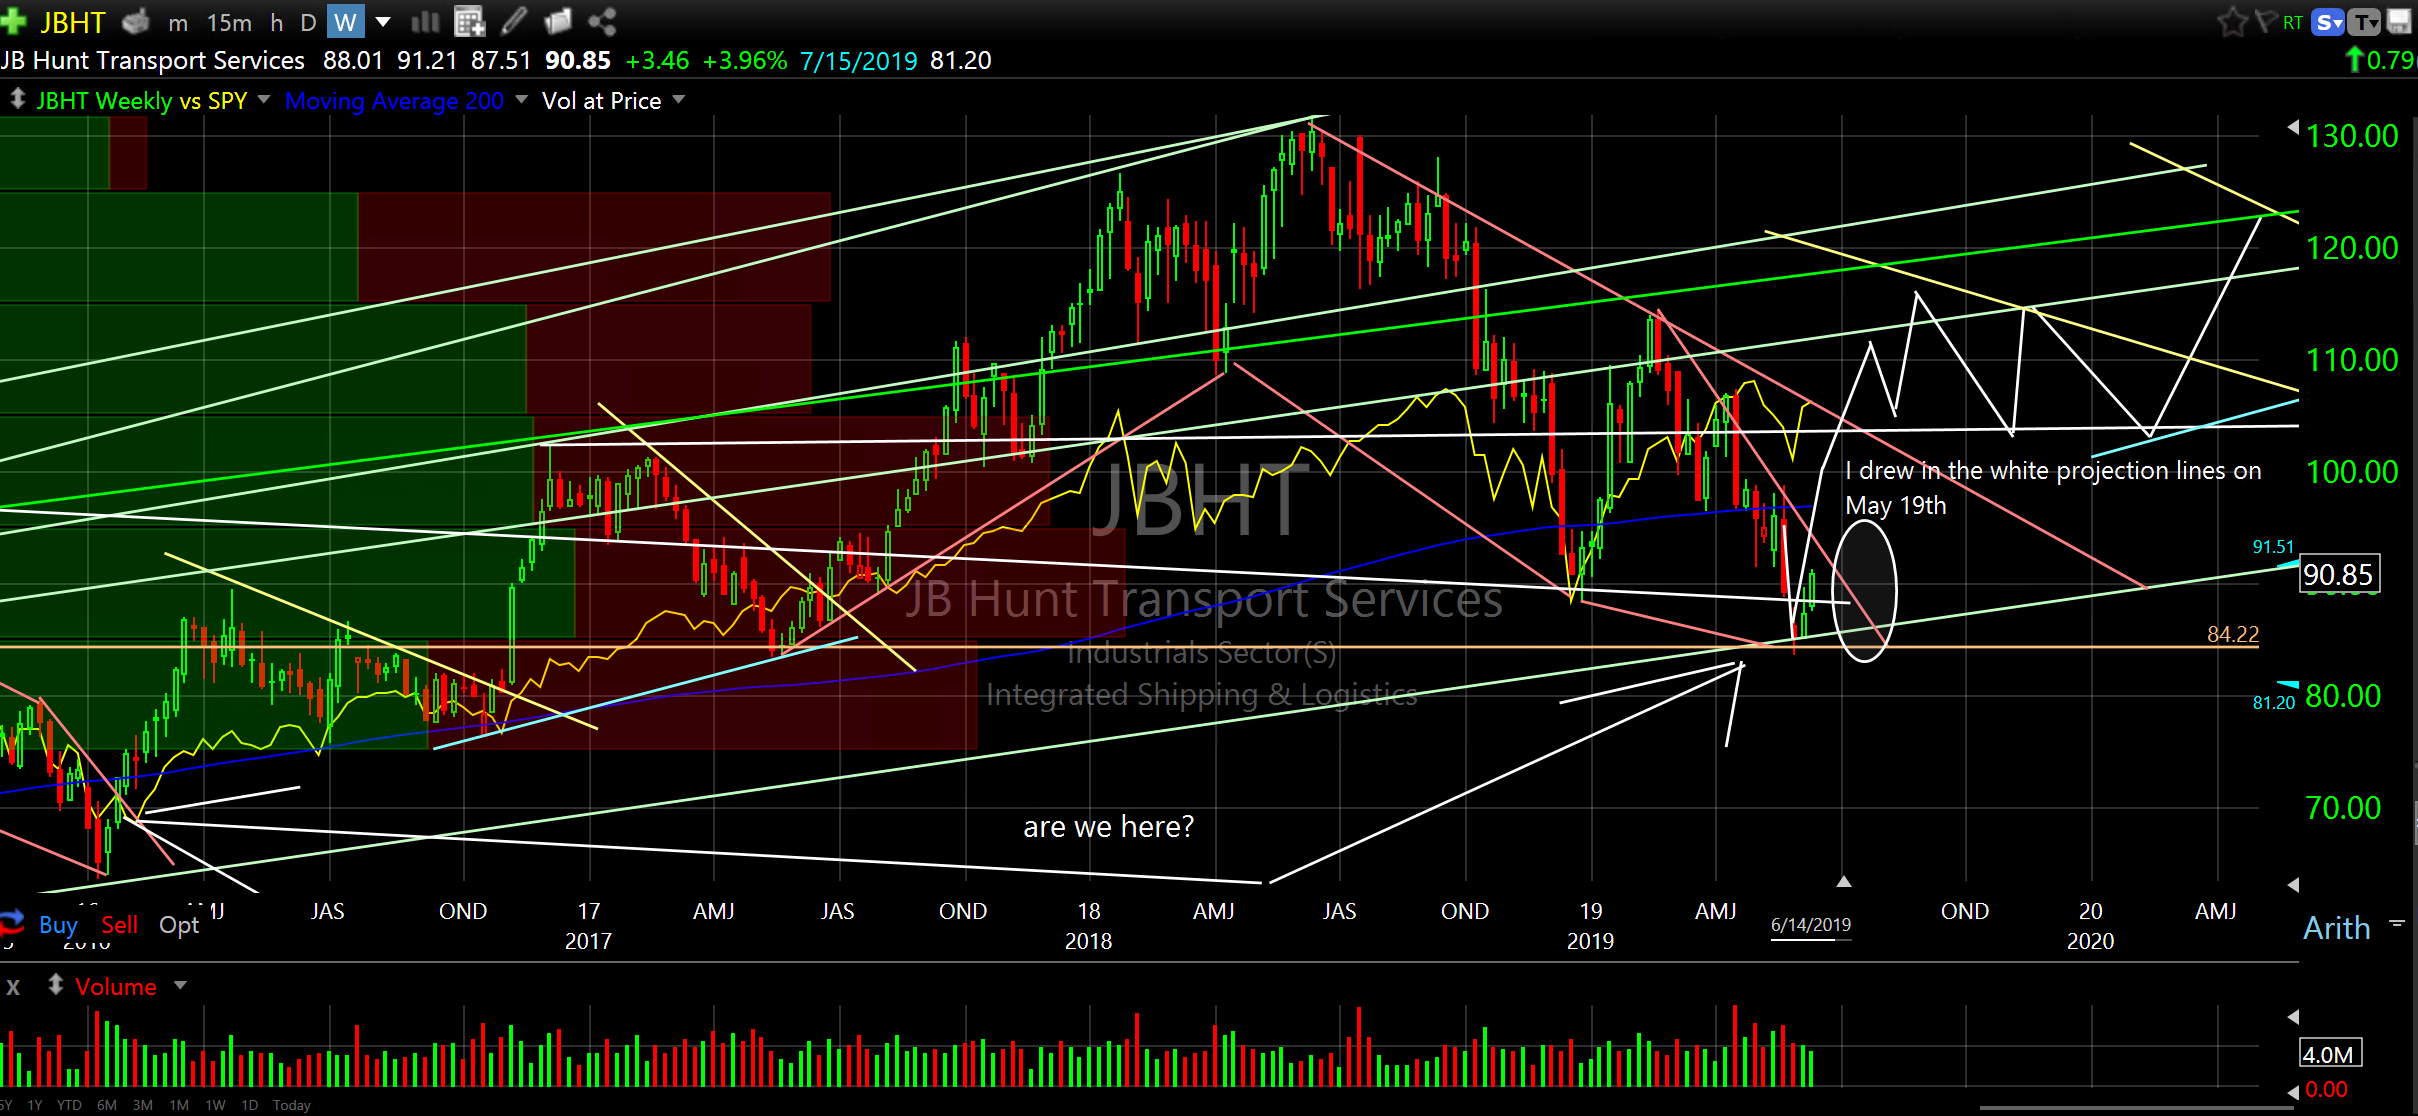
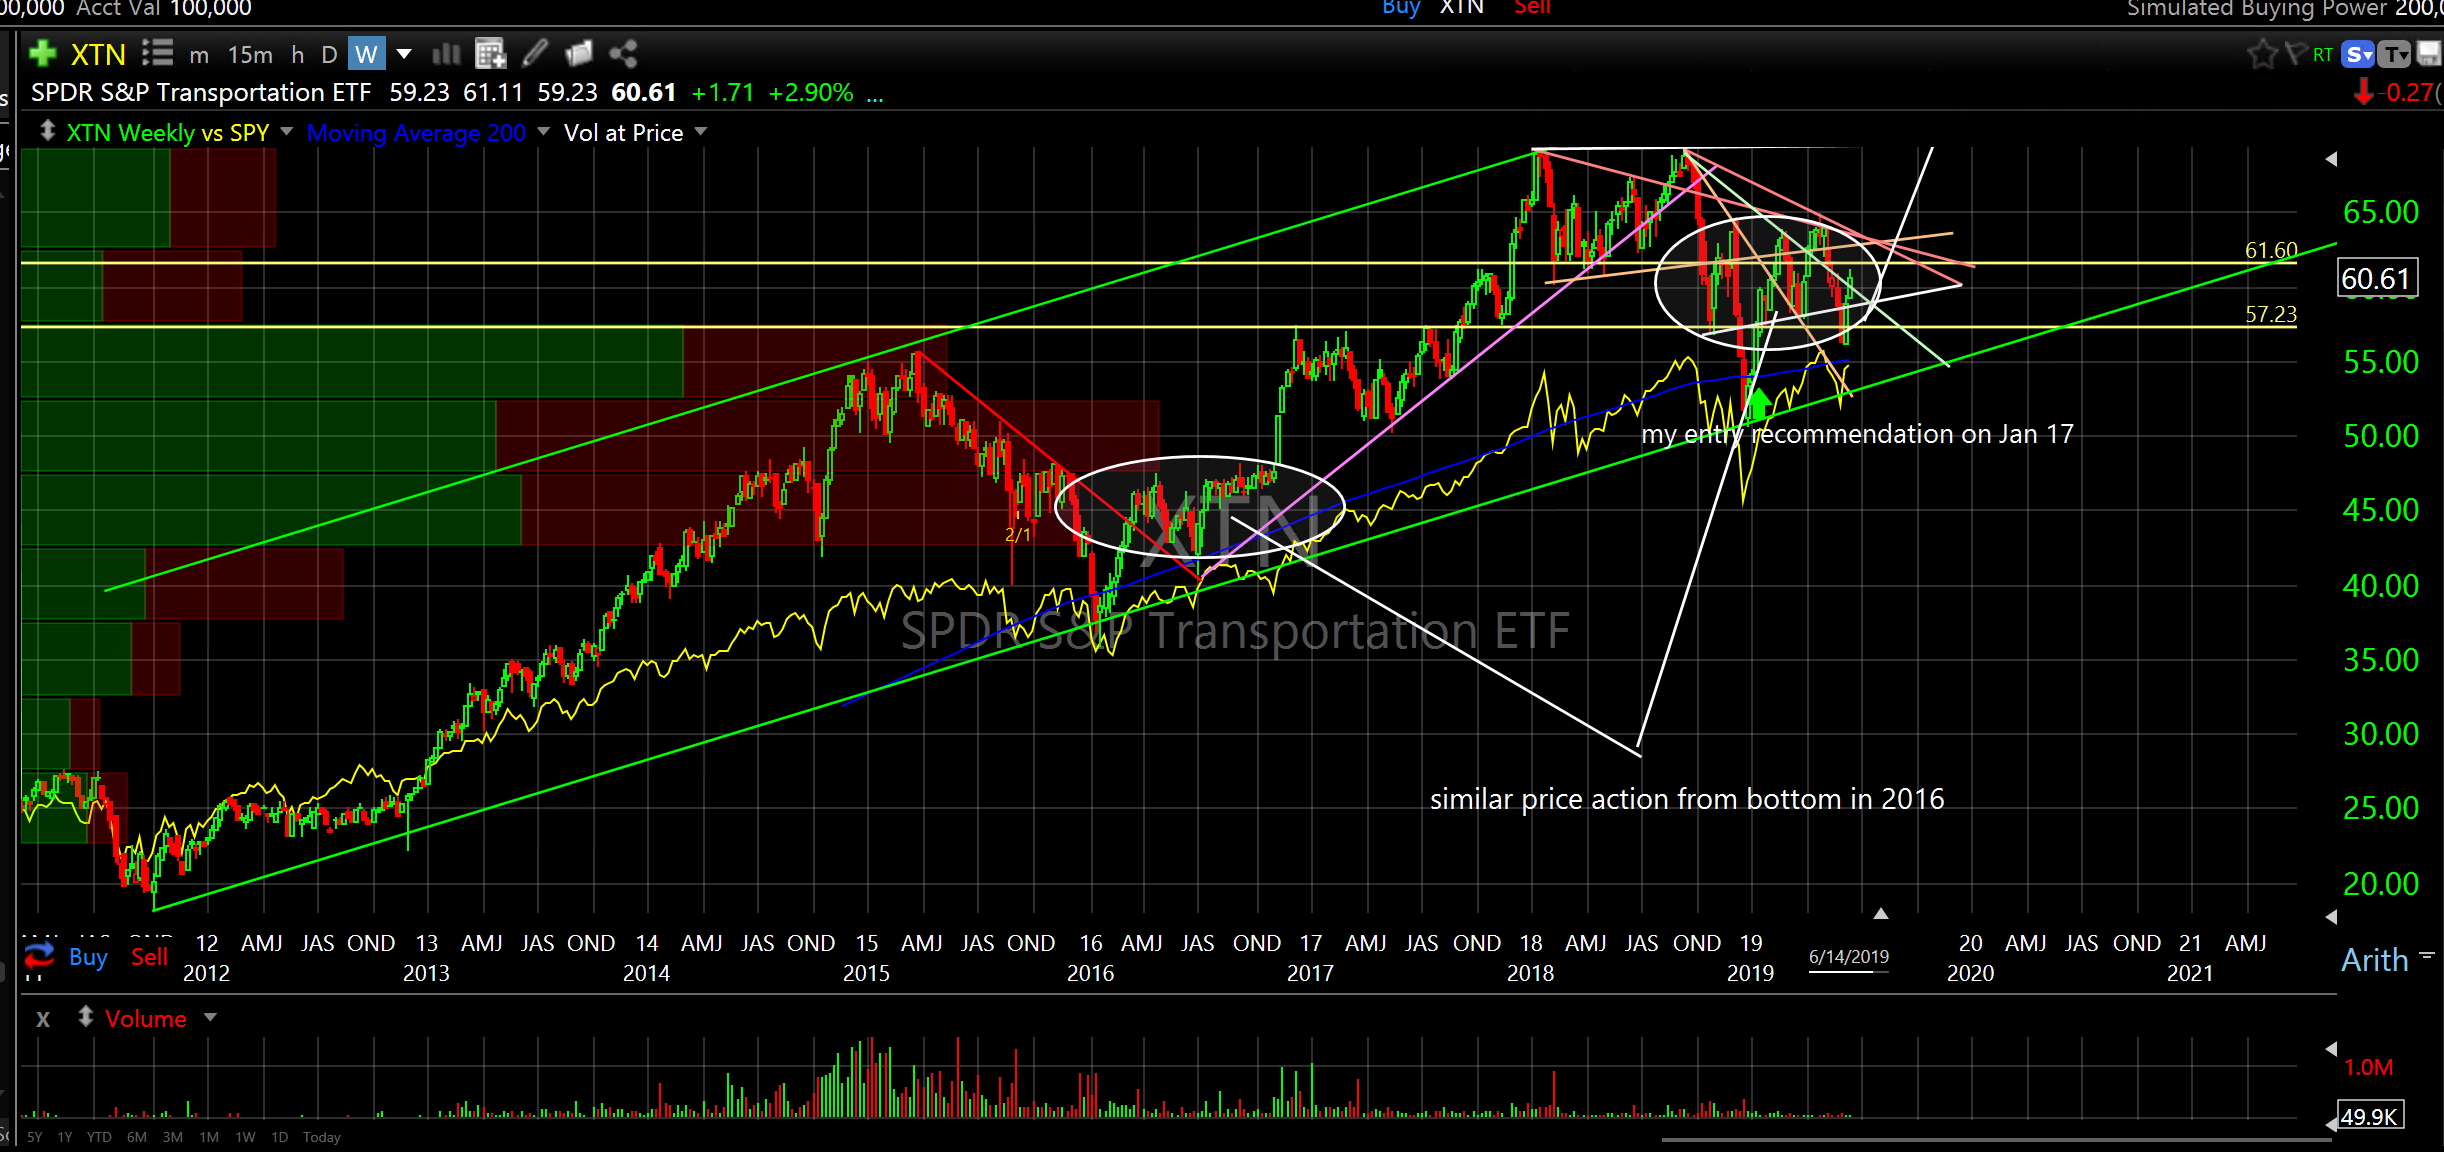
I recommended the Transportation Sector ETF (XTN) on January 17th this year. It tracks the S&P 500 Index pretty closely with a little higher volatility. Higher vol greater risk. Higher vol greater reward. So, if the S&P 500 is preparing for another expansionary cycle then the Transportation Sector should follow suit (or is it the other way around?…nod to Charles H. Dow). Then, if the Transportation Sector (XTN) is about to expand then JB Hunt Transport Services (JBHT) should follow suit. And if JBHT follows suit it should outperform SPY. My logic anyway. Look at the weekly chart of JBHT. The squiggly yellow line is SPY. See the comparison?
The next chart is also weekly but with a longer look back to the bottom in 2009. See the squiggly yellow line? That is still the comparison to SPY but from the bottom in 2009. See the difference in Alpha (outperformance)? JBHT collapsed about 35% from the 2018 highs to the Dec 2018 lows then reversed up to about half that move and then resumed the cascade down to lower than the Dec 2018 low right into primary support where it has been bid up this month. There is definite risk with this. It has underperformed the broader market recently so that is both a concern and an opportunity. A concern that underperformance will continue and at the same time an opportunity for Alpha (outperformance).
JB Hunt Transport Services (JBHT) weekly
(longer view)
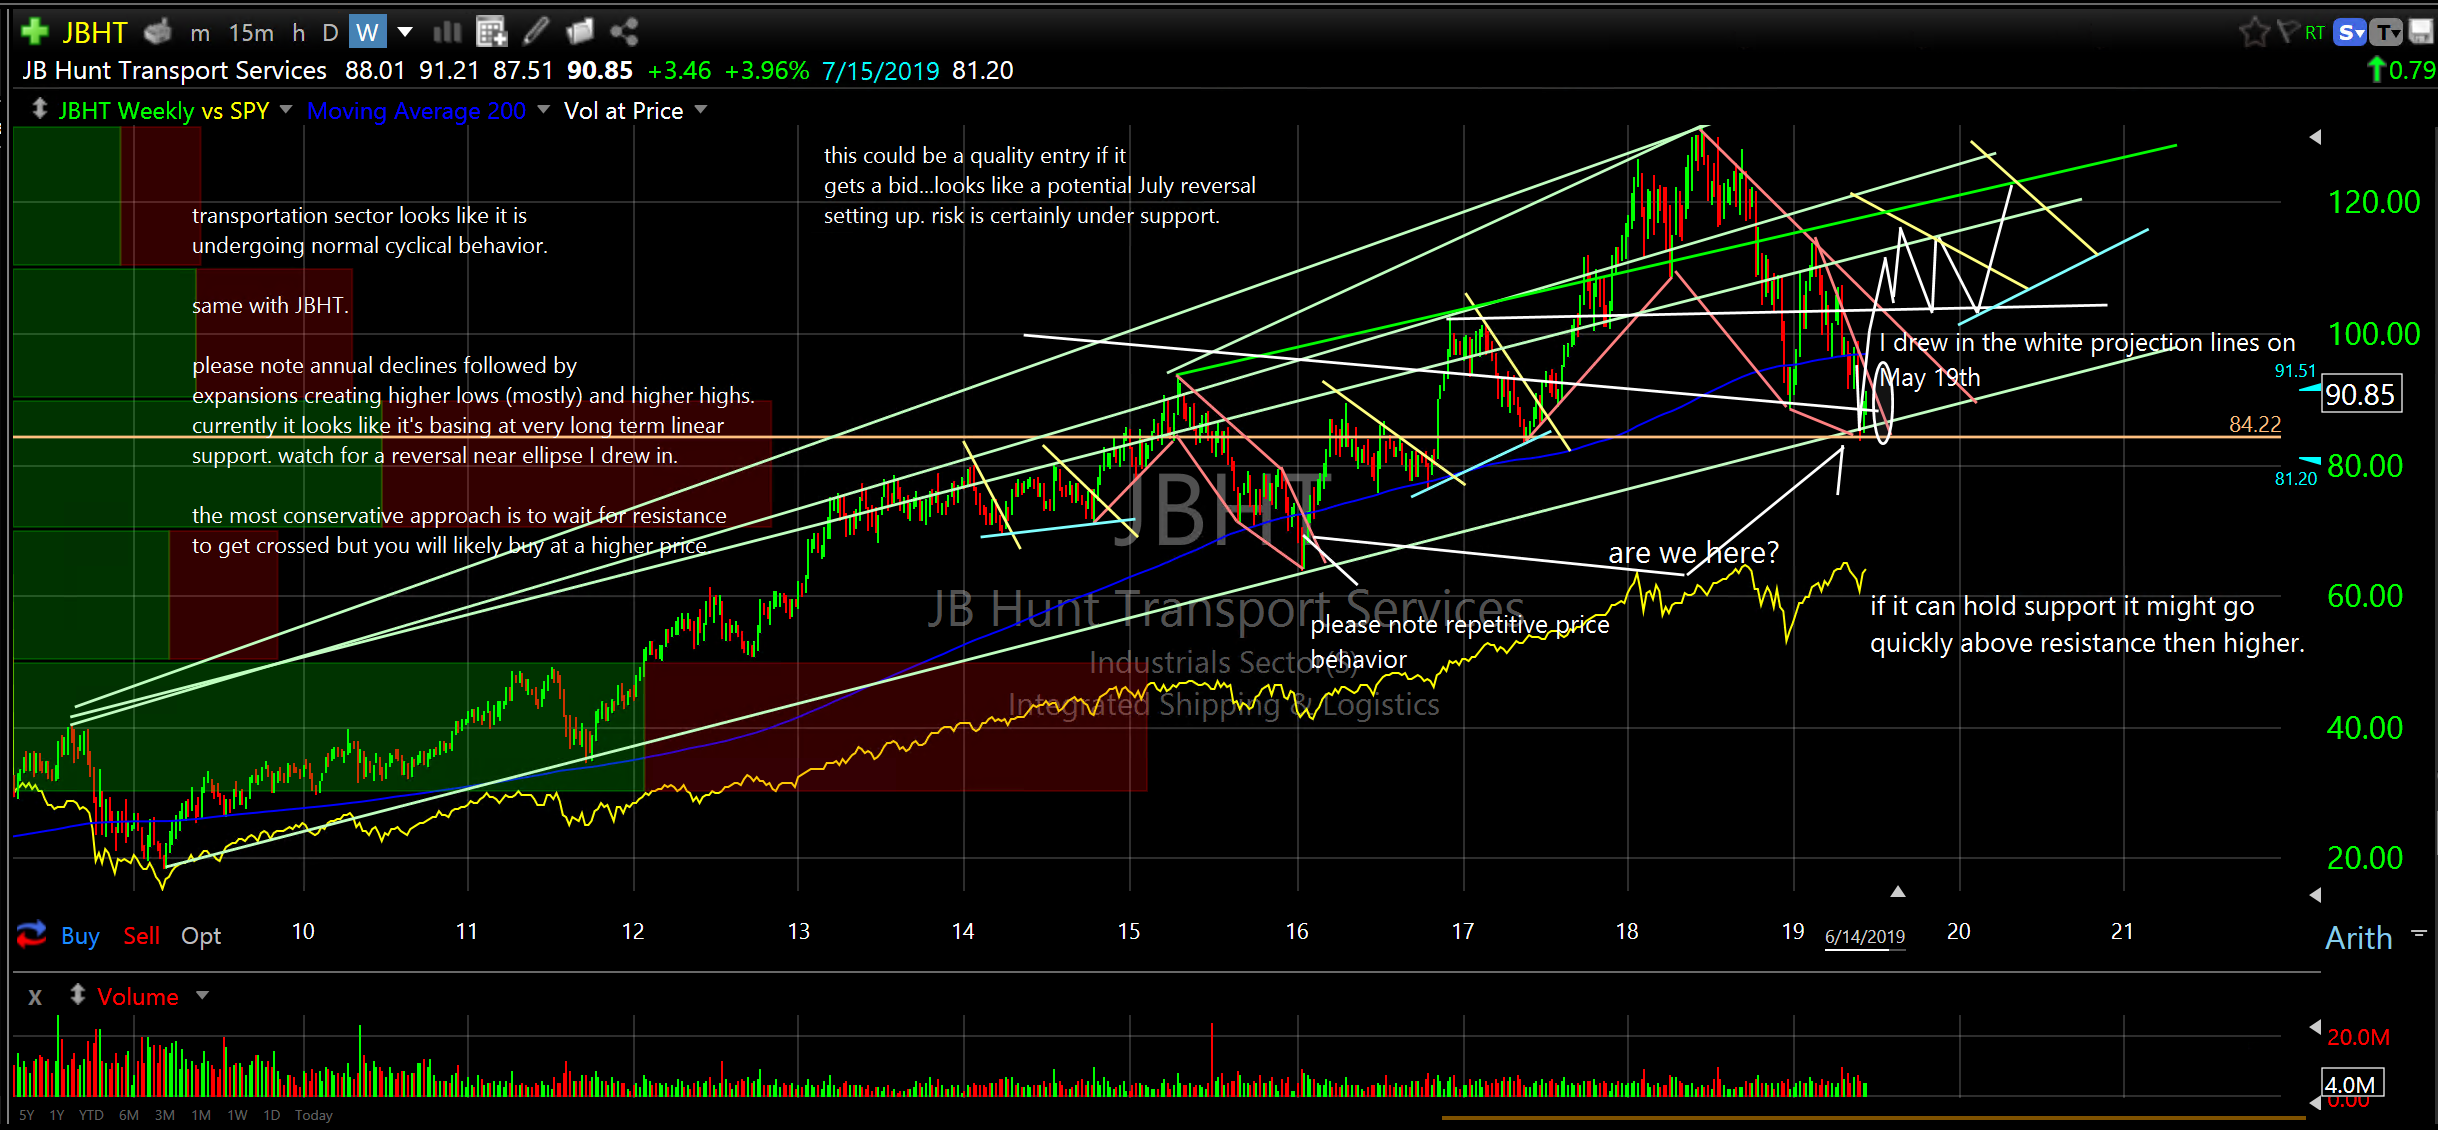
I plan on starting a position.
Please see my notes on the charts. I have also included a chart of XTN, the Transportation Sector ETF.
Transportation Sector ETF (XTN) weekly
Let me know if you have any names you would like me to chart or have any questions on my charting. I would be happy to respond.
By the way, for those of you that didn’t experience (with real money) the Dot.com collapse in 2002/2003 or the Financial Crisis in 2008/2009 you just had a little itty bitty taste during the past 18 months of what it feels like. No, it’s not a good feeling. Learn from it. Reflect on it.
Please do your own due diligence and have a wonderful week.
Hedge fund and PM’s feel free to distribute.
Happy Fathers Day,
Don
PS. All of my research notes for the past seven years are archived here…https:// smartchartinvestor.com/blog/