I just sold SLCA at $12.44 for a 20% gain in three days. No sense in getting too greedy. Now that was a good swing trade.
KaChing.
US Silica Holdings (SLCA) daily
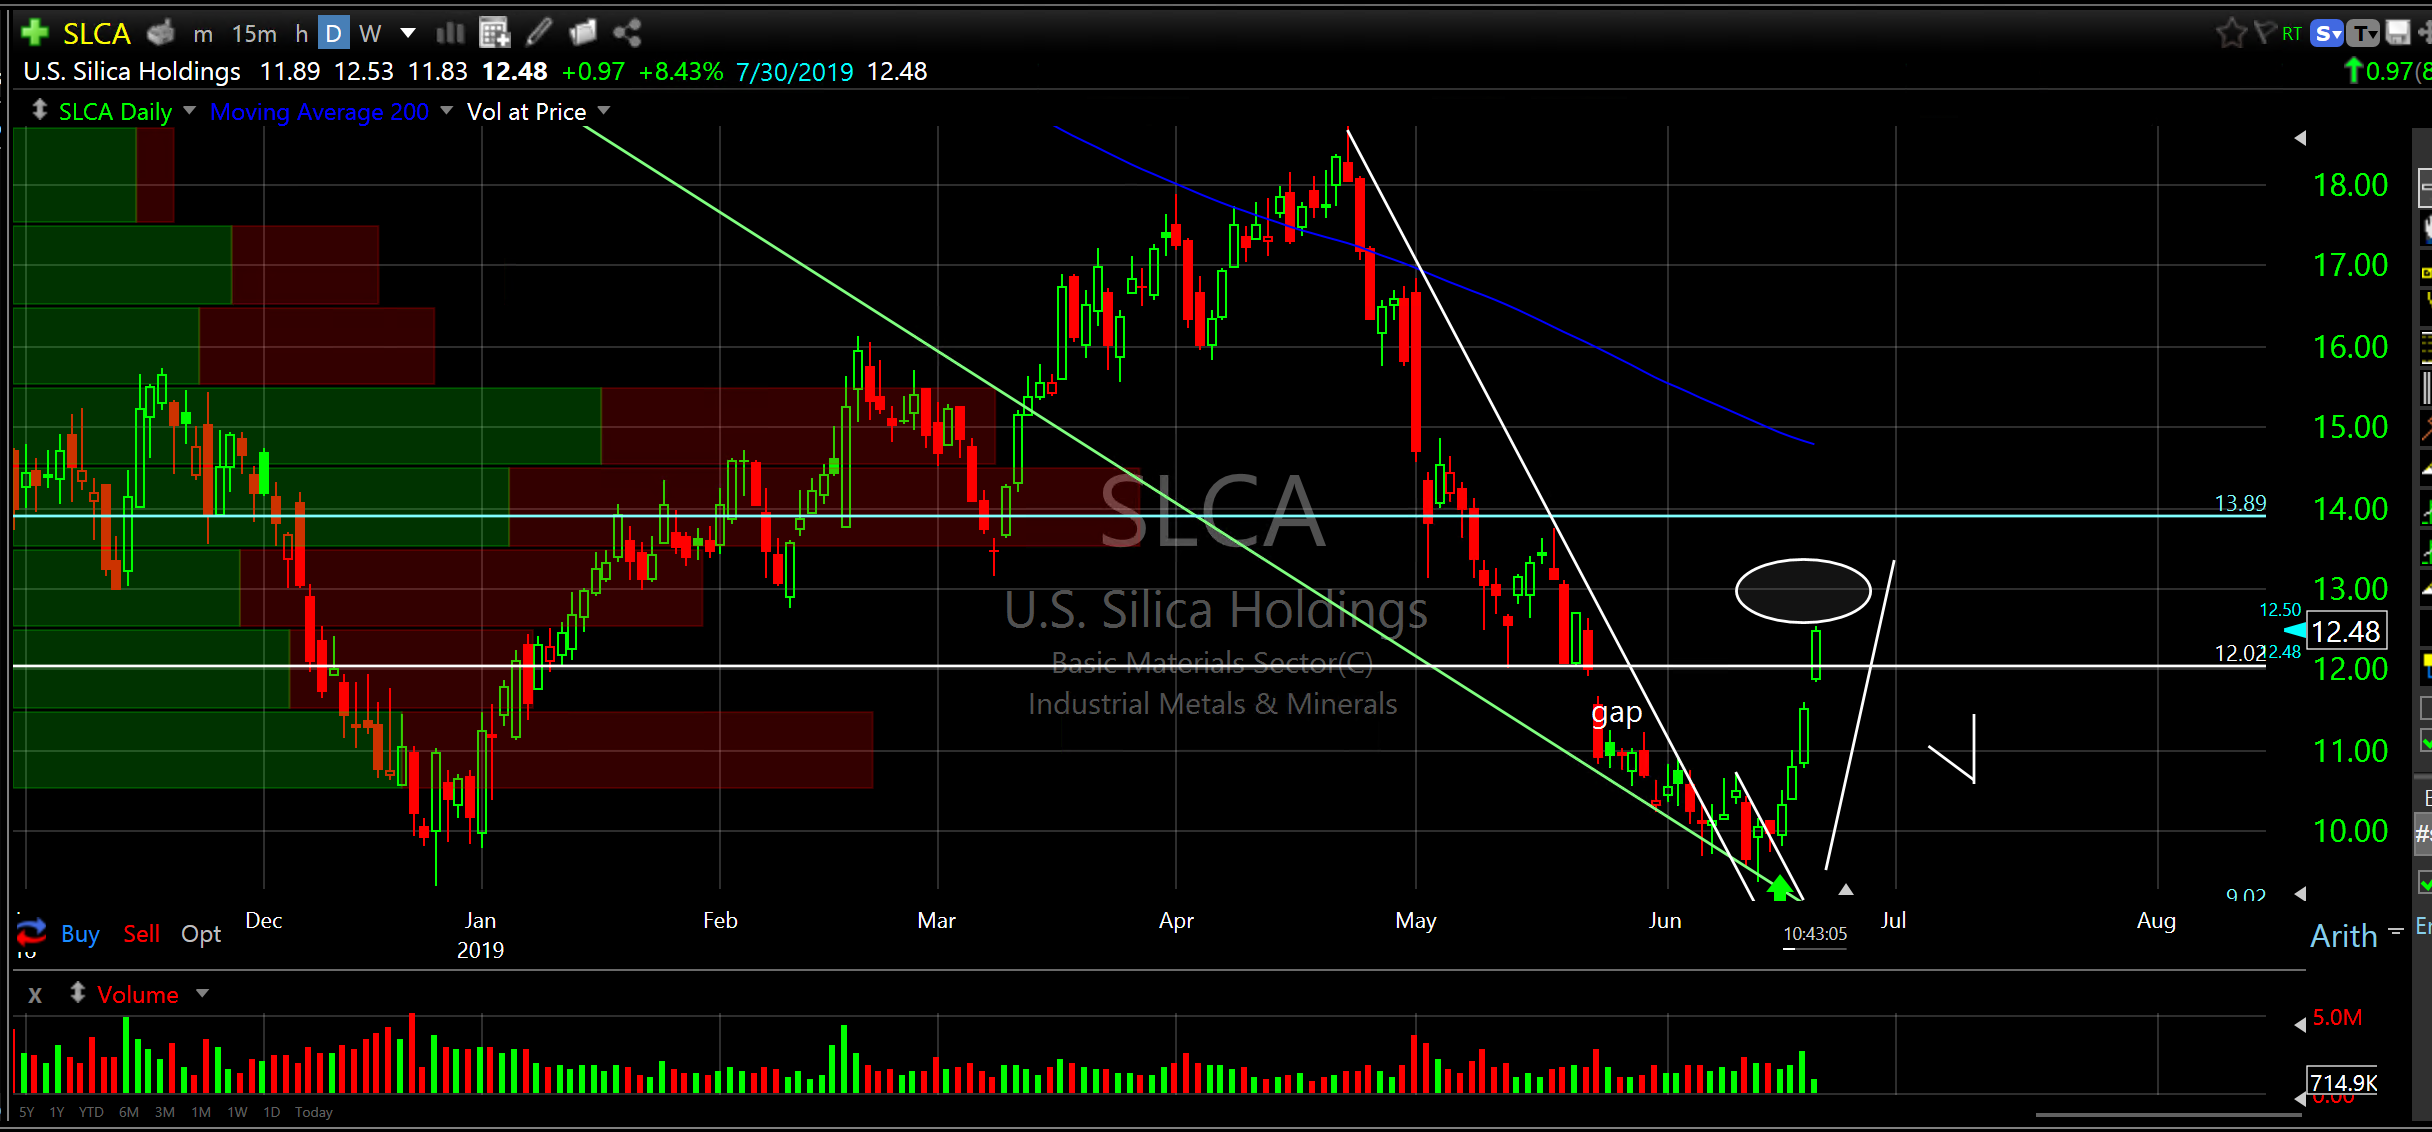
The 15 minute chart shows the power of support coupled with broken resistance on a smaller time frame. Please note the bounce off support at $9 coupled with the break of short term resistance (descending white line).
US Silica Holdings (SLCA) 15-minute
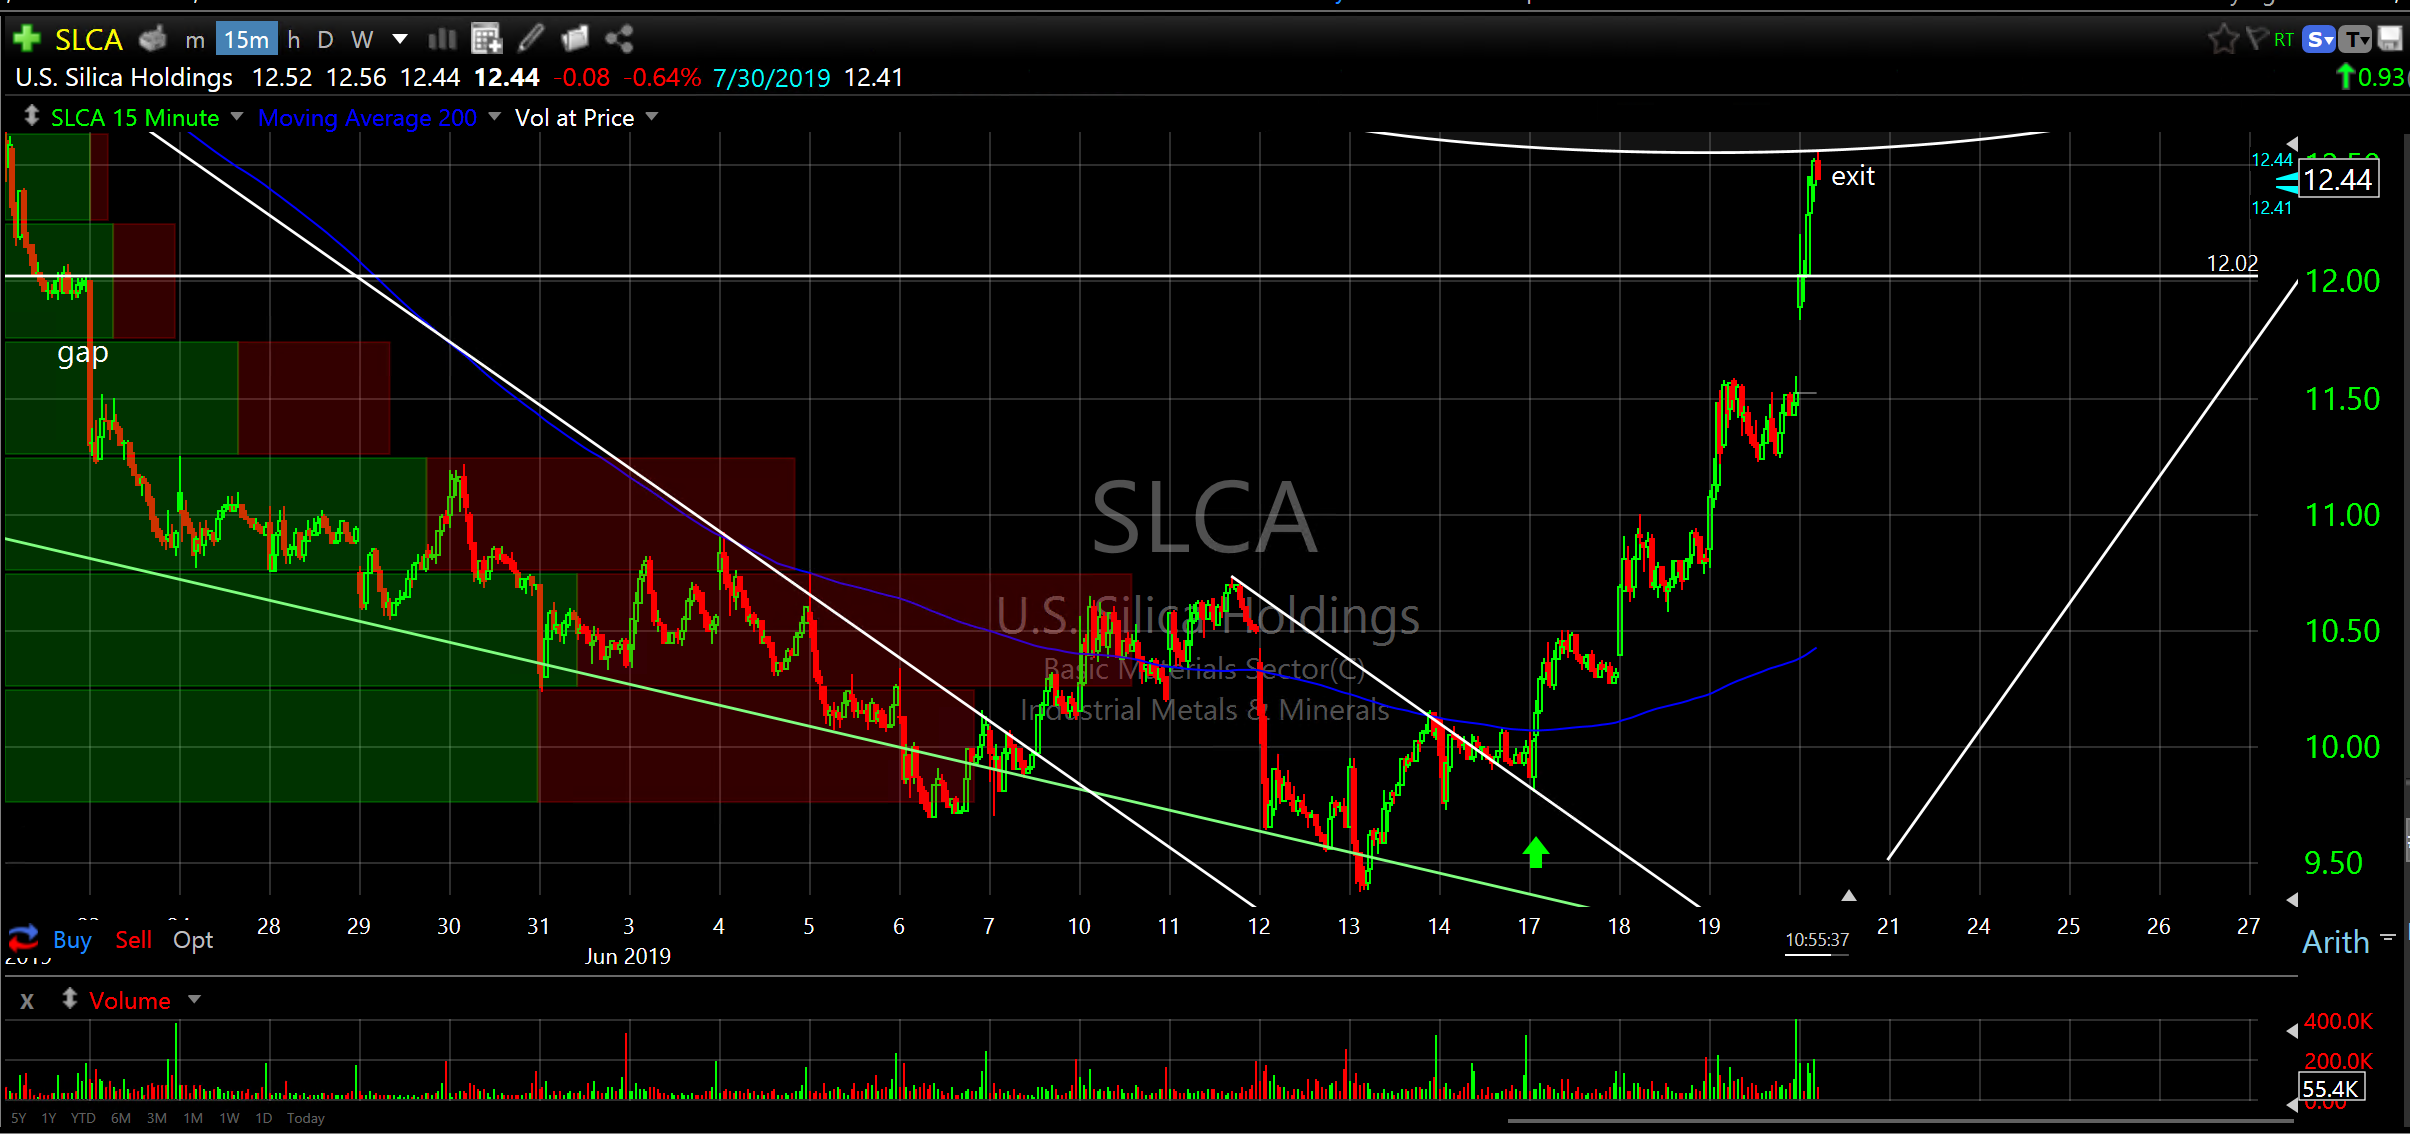
Initially there was about an hour of slide down the top of resistance once broken then the pop. That pop is exactly where I entered the trade (see green arrow). Then it stair stepped higher immediately for two days and this morning we got the rip through resistance to mid $12’s.Thank you very much SLCA…nice doing business with you.
Don