I hope you had an enjoyable 4th of July. This week I have my usual coverage of the broader market, a look at a few “weed” stocks, a speculative Biotechnology set up and some notes on Zoom Zoom (Tesla).
Broader Market Update
Looking back on the first half of 2019 it would appear I have been pretty aggressive. That’s because I have been. In the first six months of the year I have highlighted 76 entries while only 26 in all of last year. Clearly, it’s been a ripper of a year to have ramped up exposure. Well done if you have participated along with me.
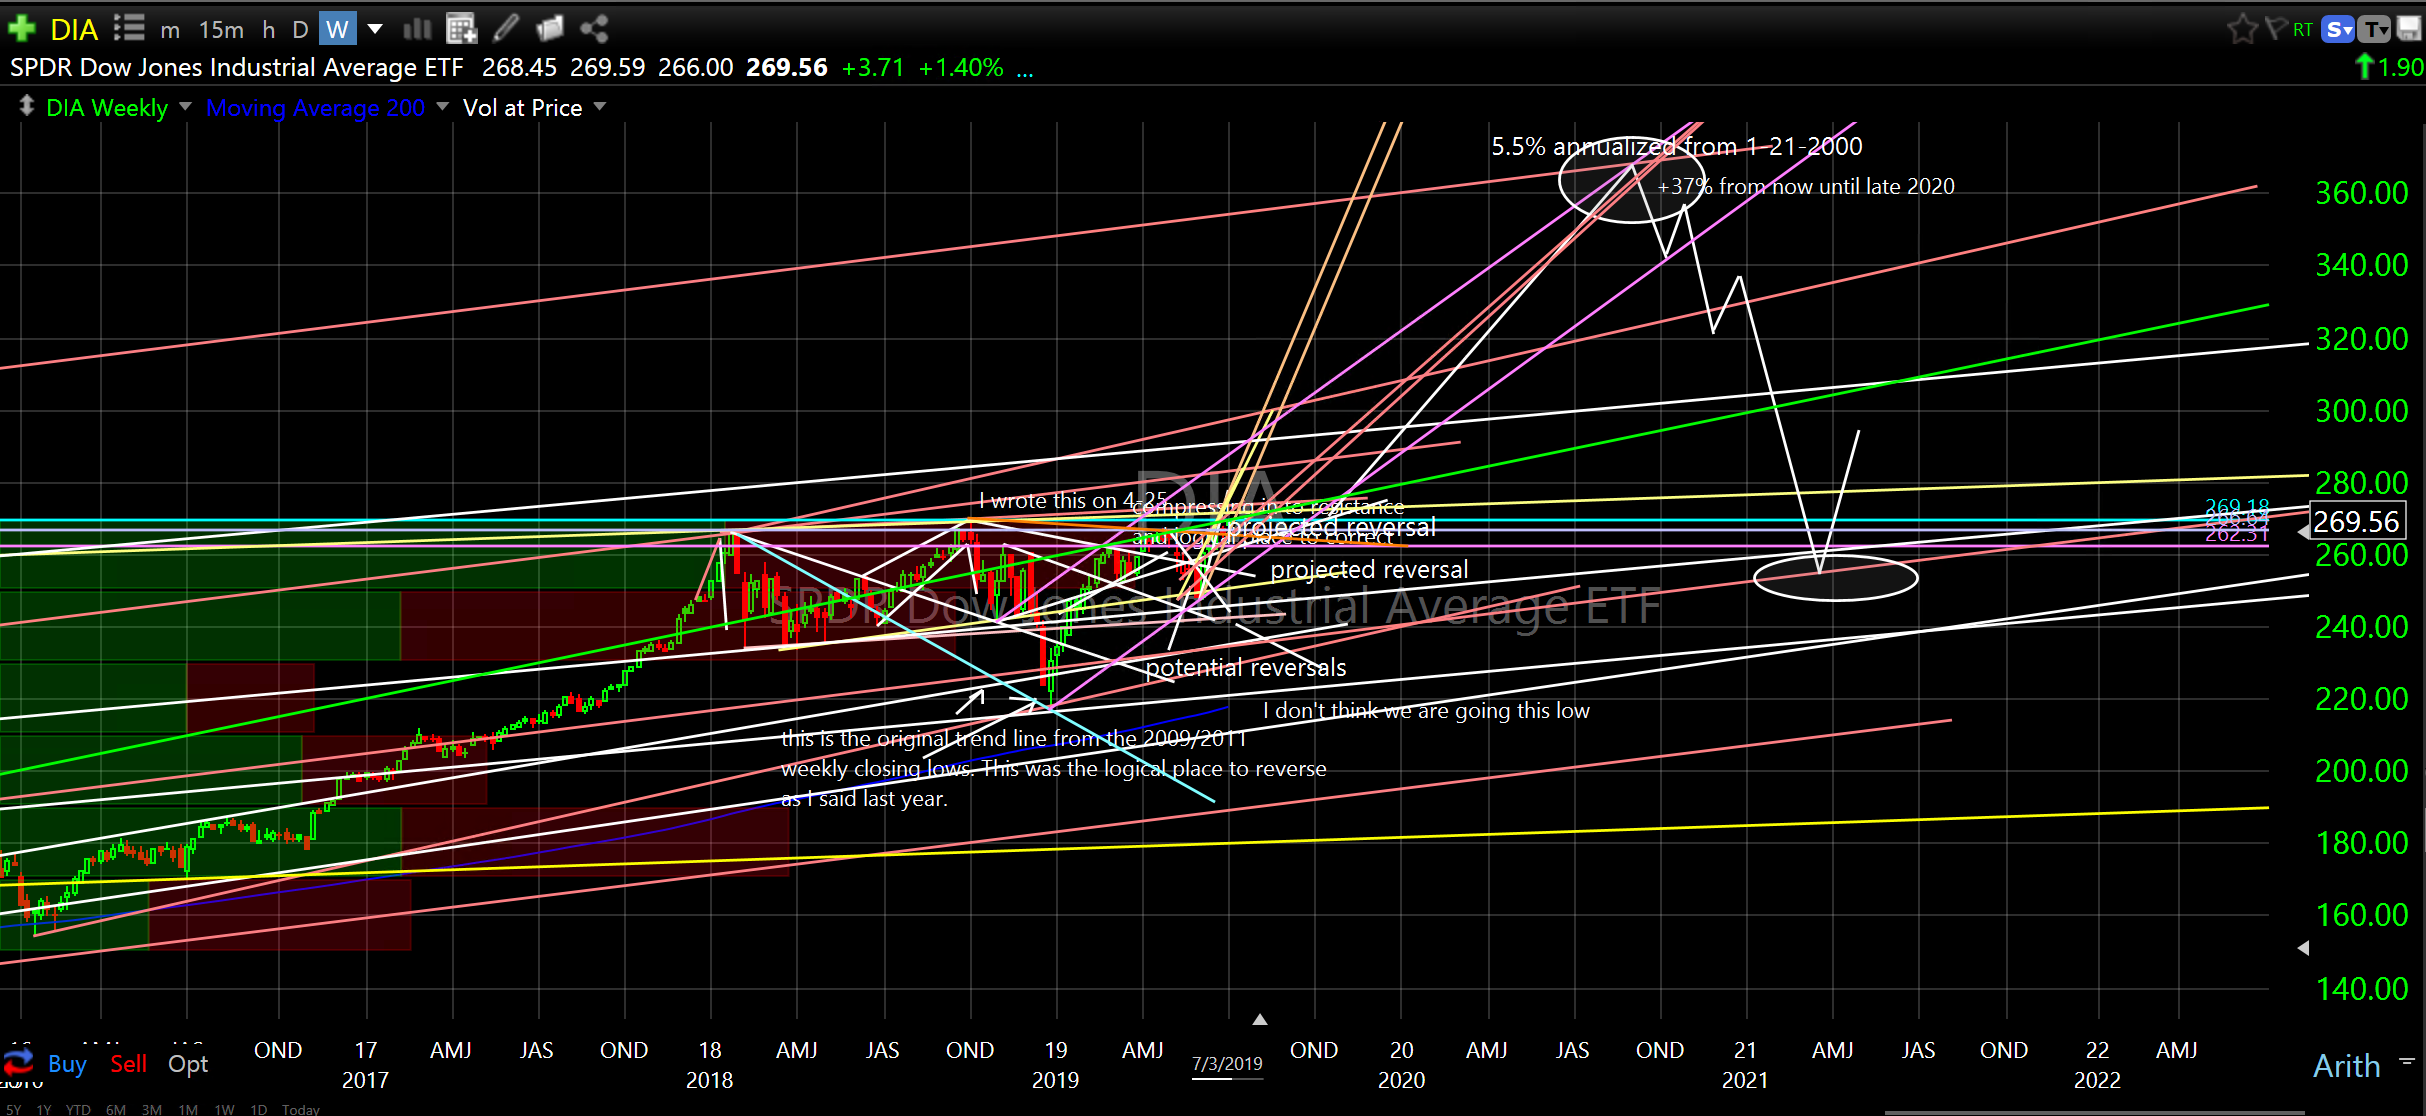
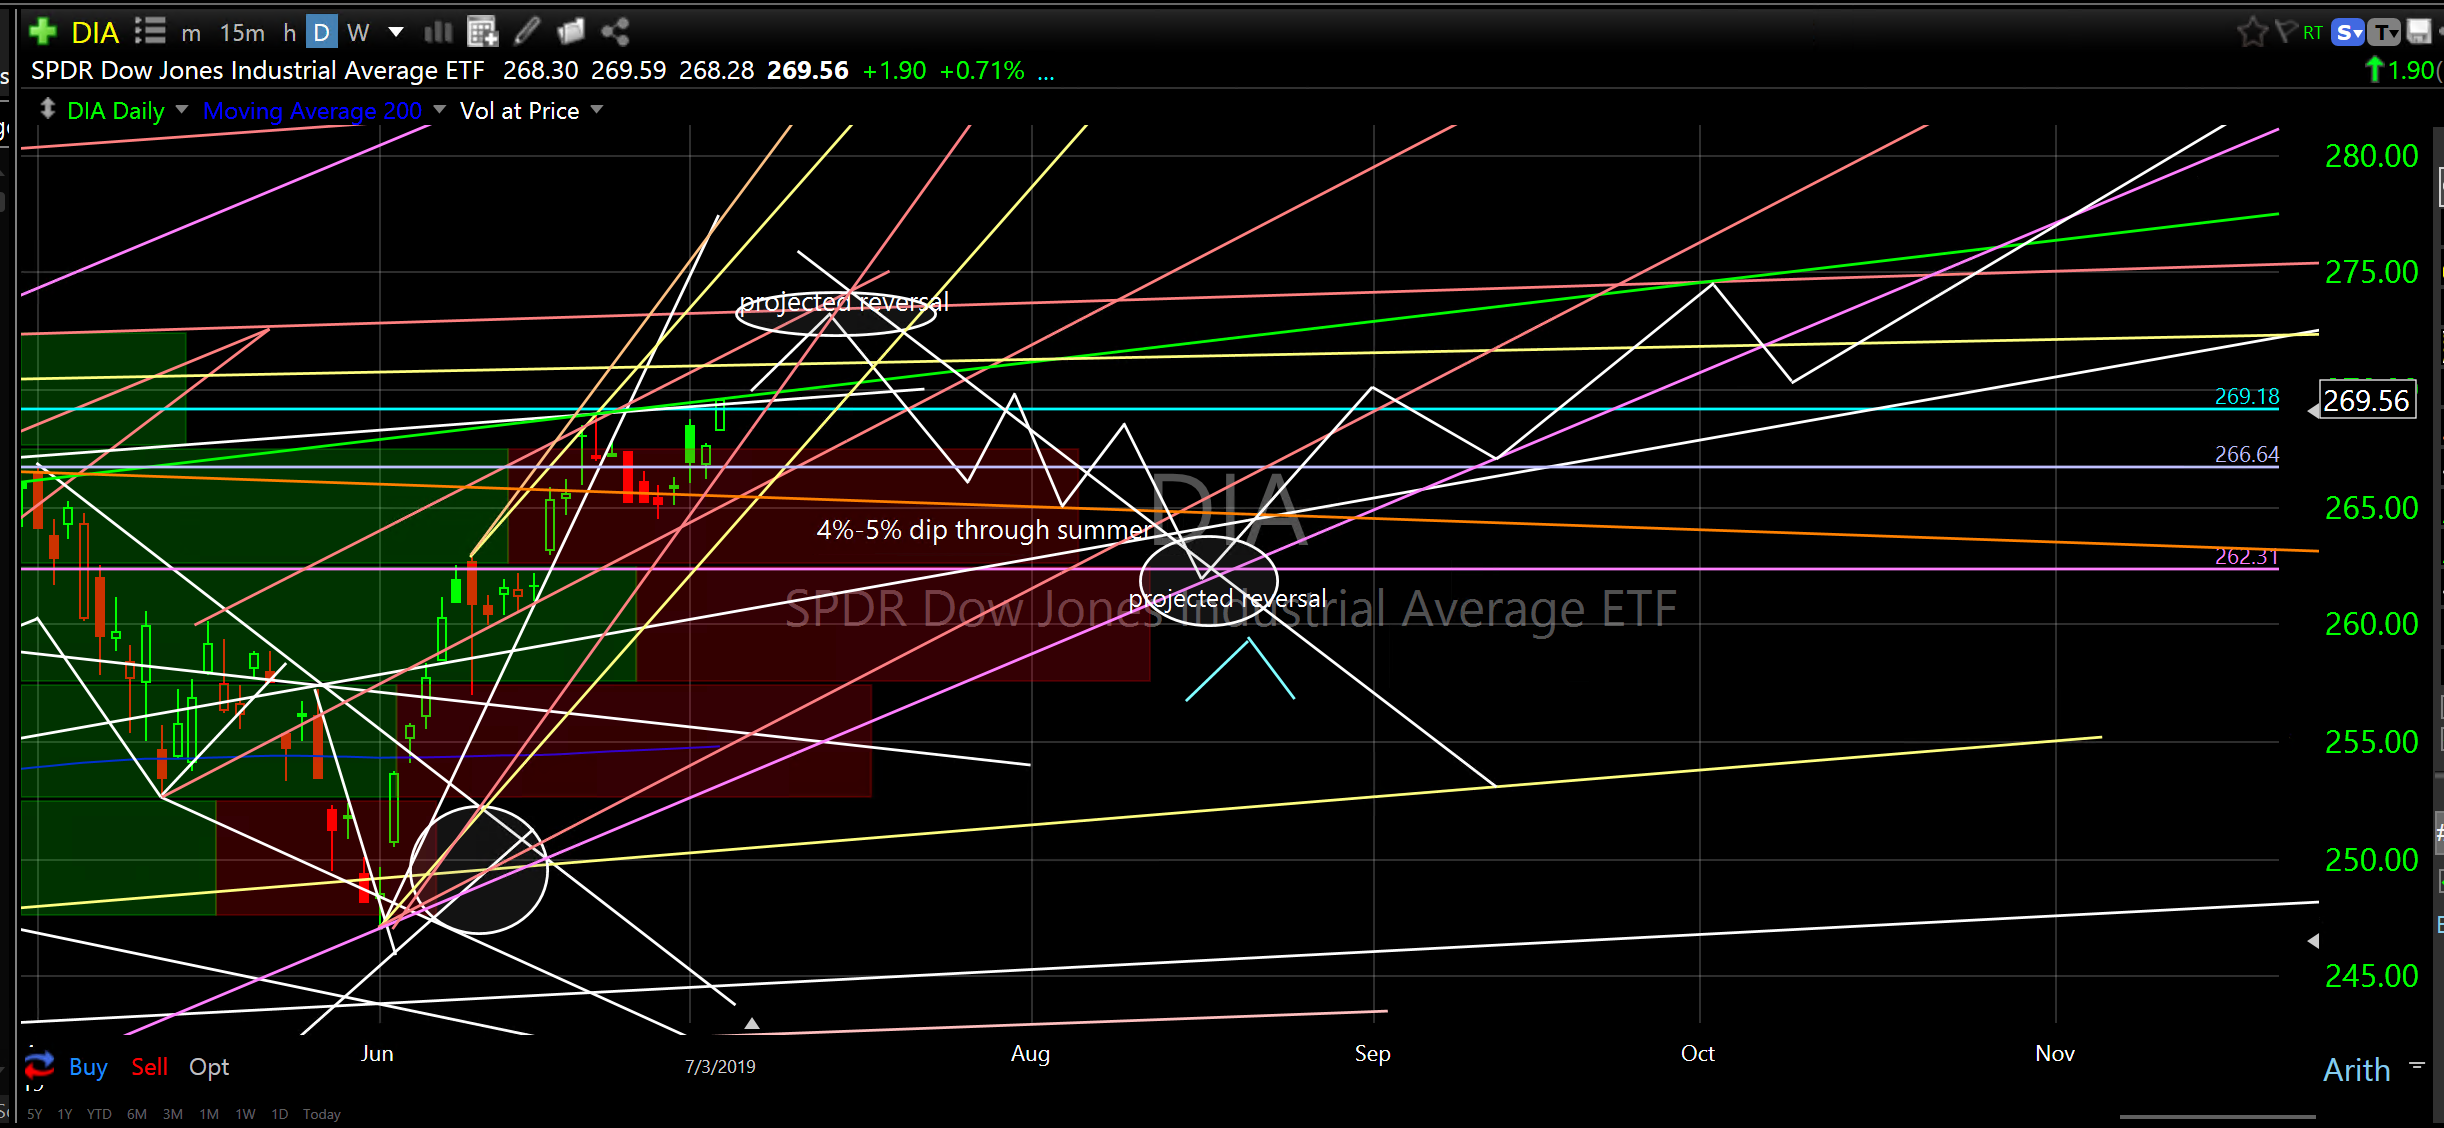
While my price projection is roughly 37,000 for The Dow Jones Industrial Average going into late summer/fall of 2020 I think we are due for a choppy, sloppy couple of months ahead where it might consolidate down towards 26,000 before reversing higher this fall. Summer is seasonally weak and the ramp we have had from the June low needs a period of consolidation. Please note the reversals, price projections and notes I have on the two DIA charts below.
The first chart is a weekly chart with price projection out to 2021 and the second chart is a daily chart out to late this year. Remember, these are just my projections/opinions based on historical price action.
SPDR Dow Jones Industrial Average ETF (DIA) weekly
SPDR Dow Jones Industrial Average ETF (DIA) daily
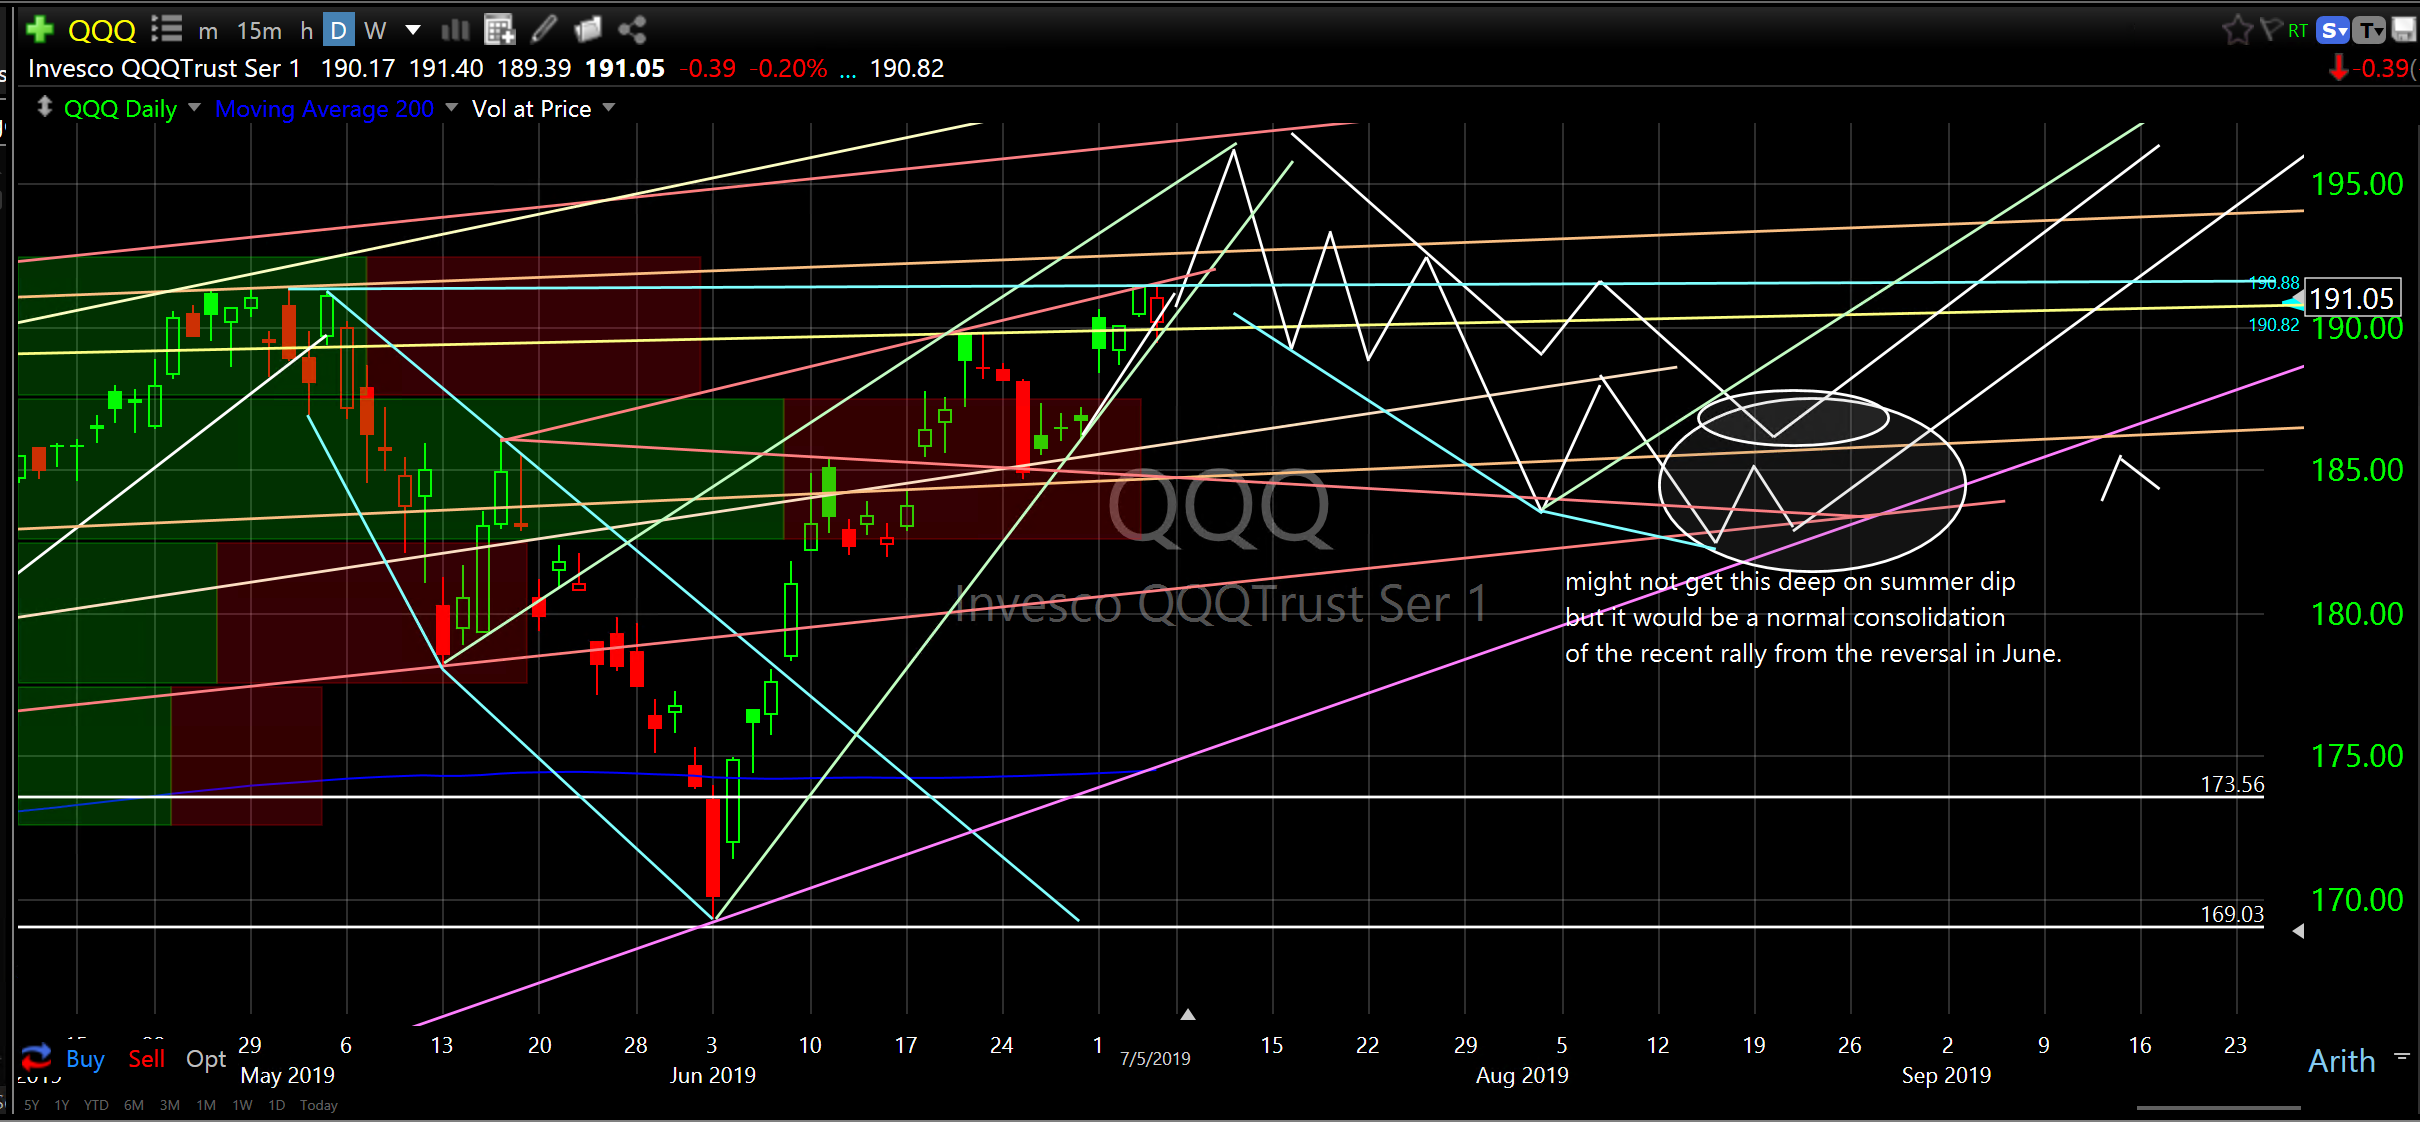
The ETF that tracks the Nasdaq 100 Index (QQQ) is also due for a consolidation. Please see daily chart below with my price projections out to November.
Invesco QQQTrust Ser 1 (QQQ) daily
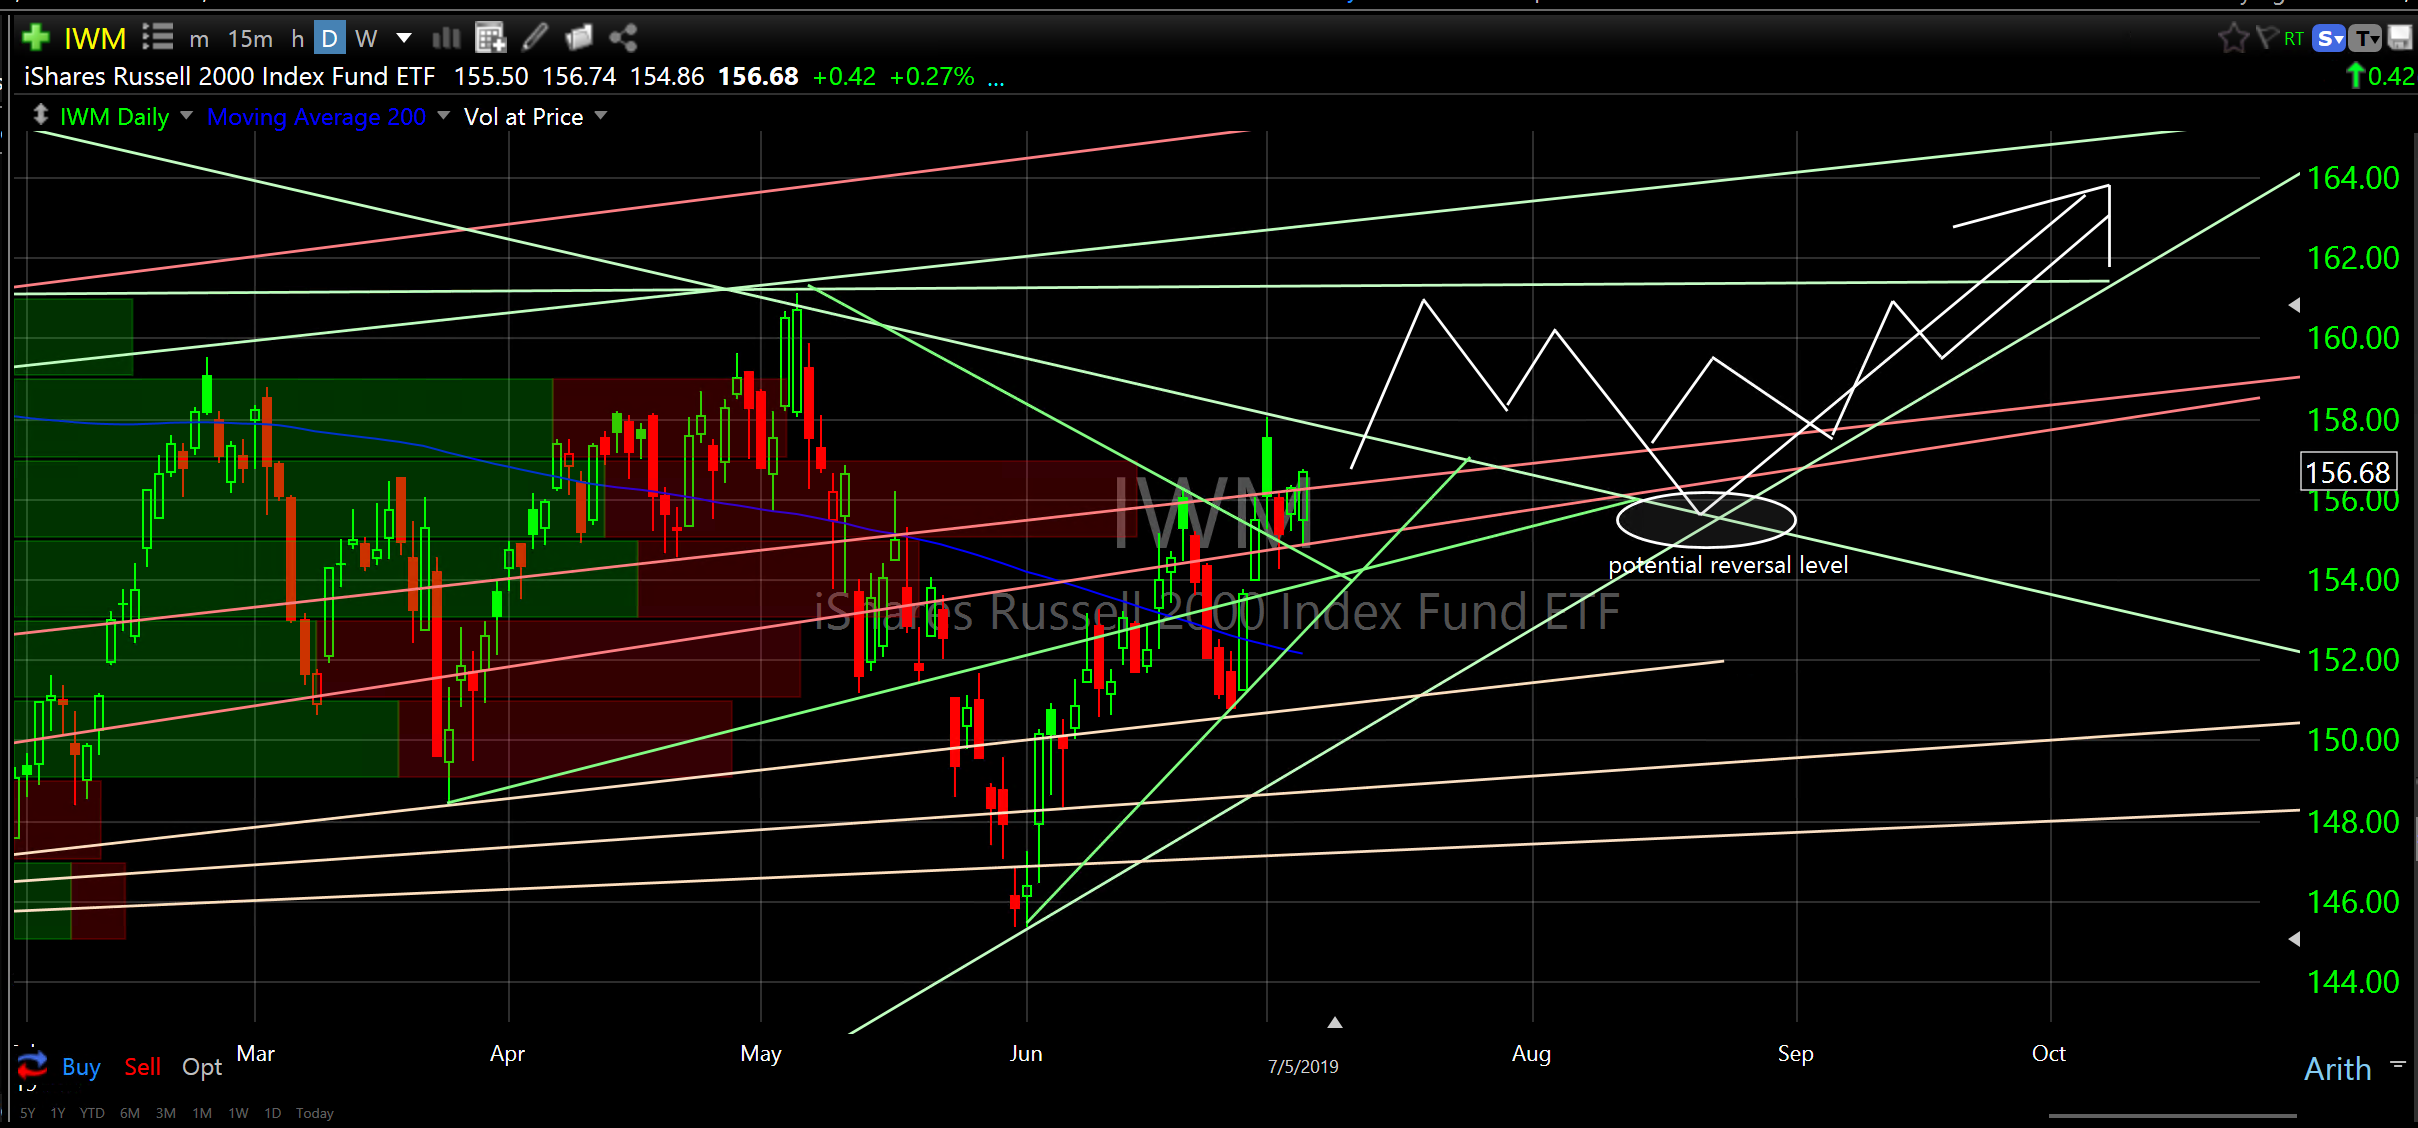
The Small Cap ETF (IWM) might chop through summer as well. The fact that they have not made a new high, as the broader market has, is perfectly normal. See price projections on daily chart below.
iShares Russell 2000 Index Fund ETF (IWM) daily
Weed Stocks
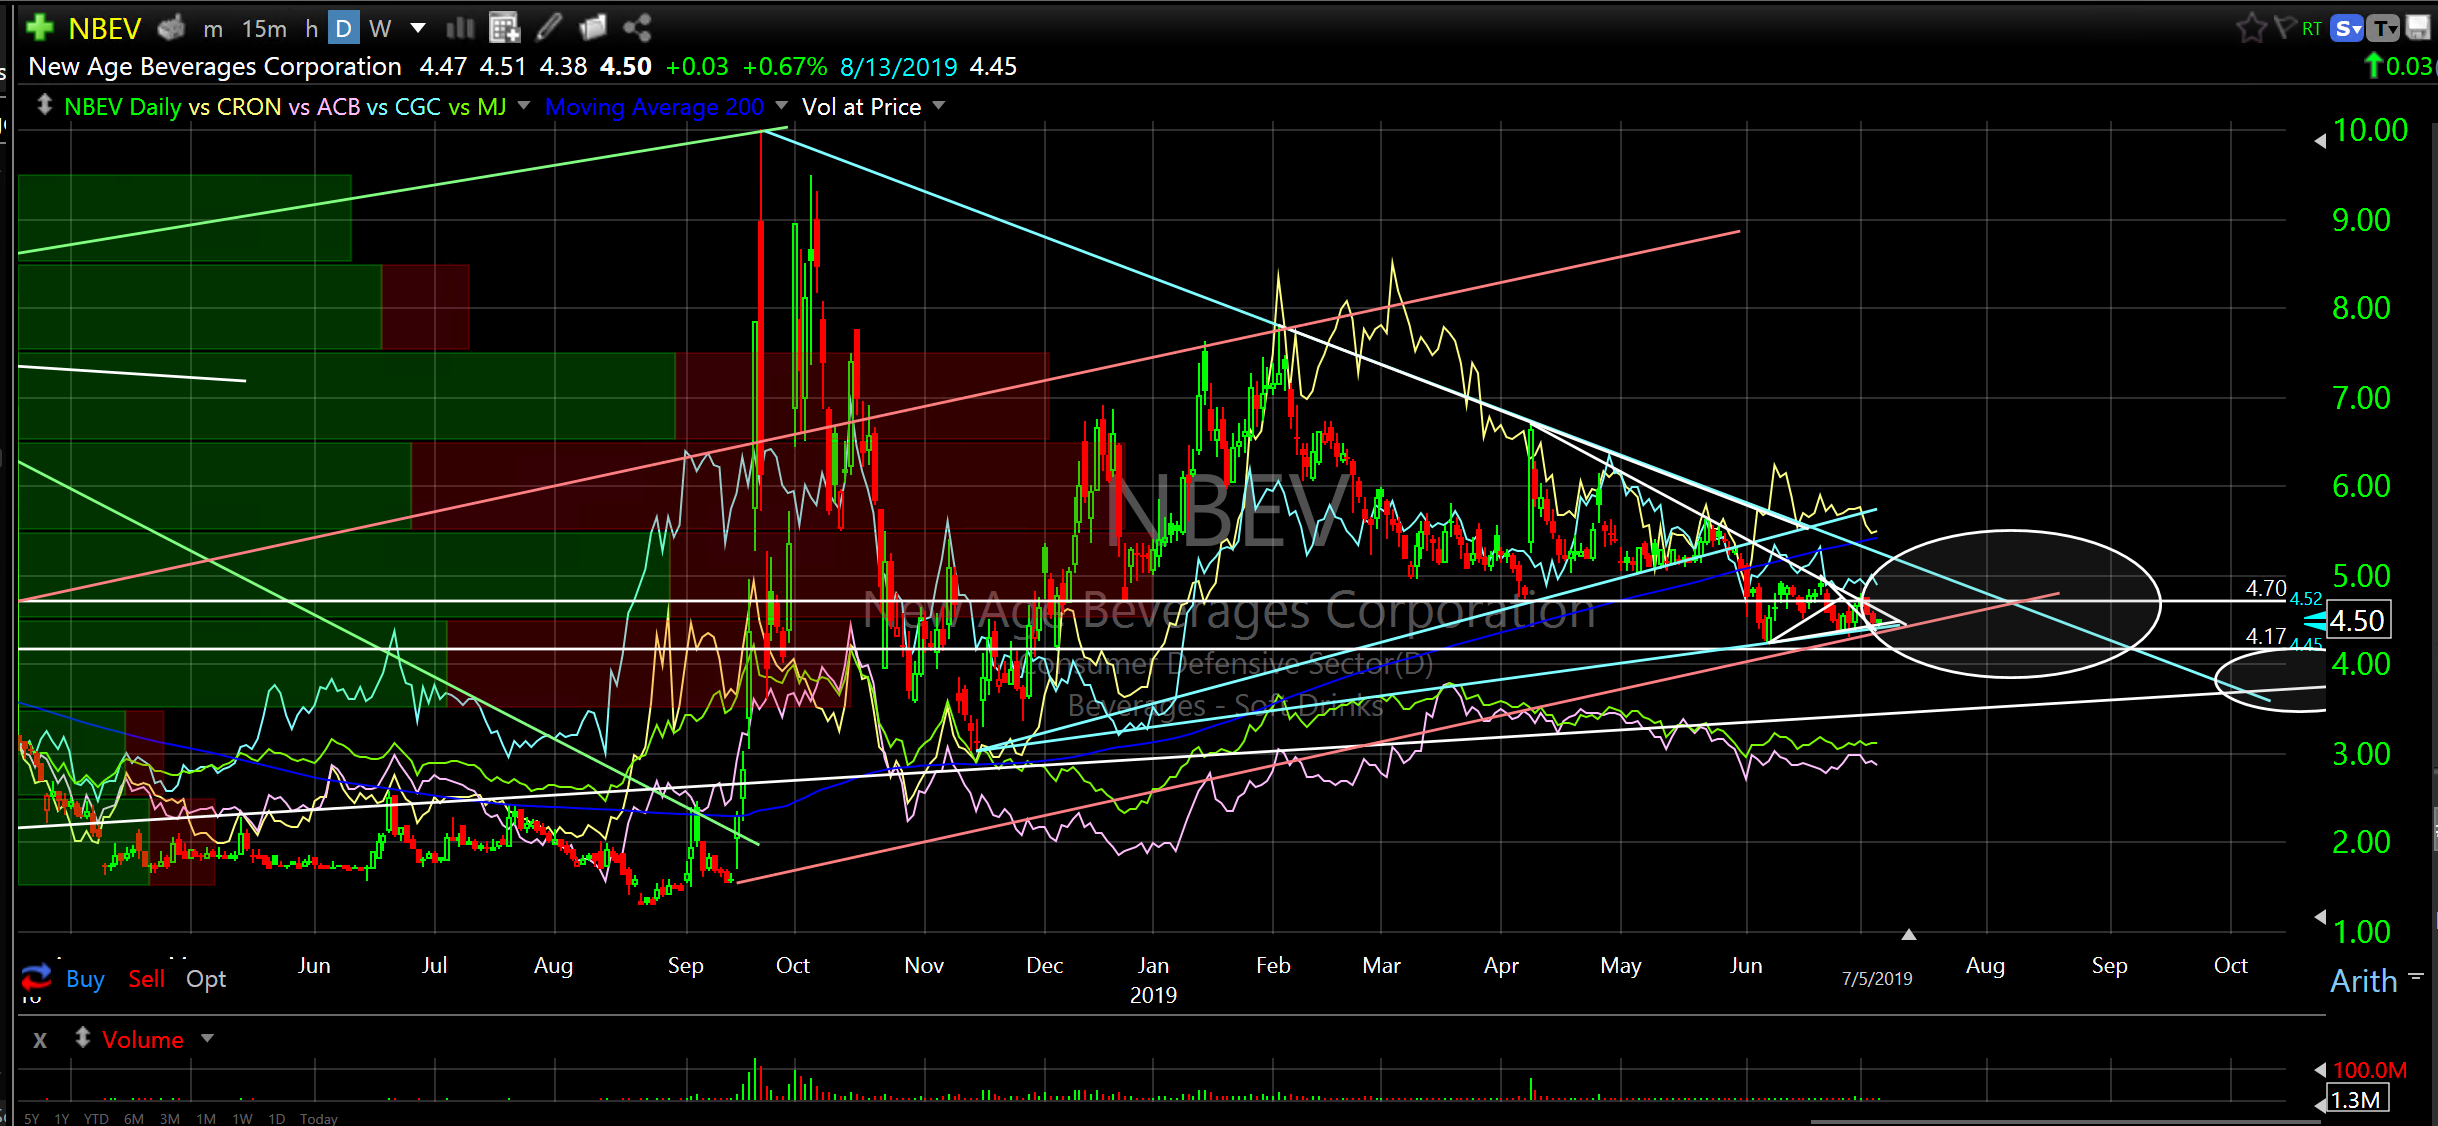
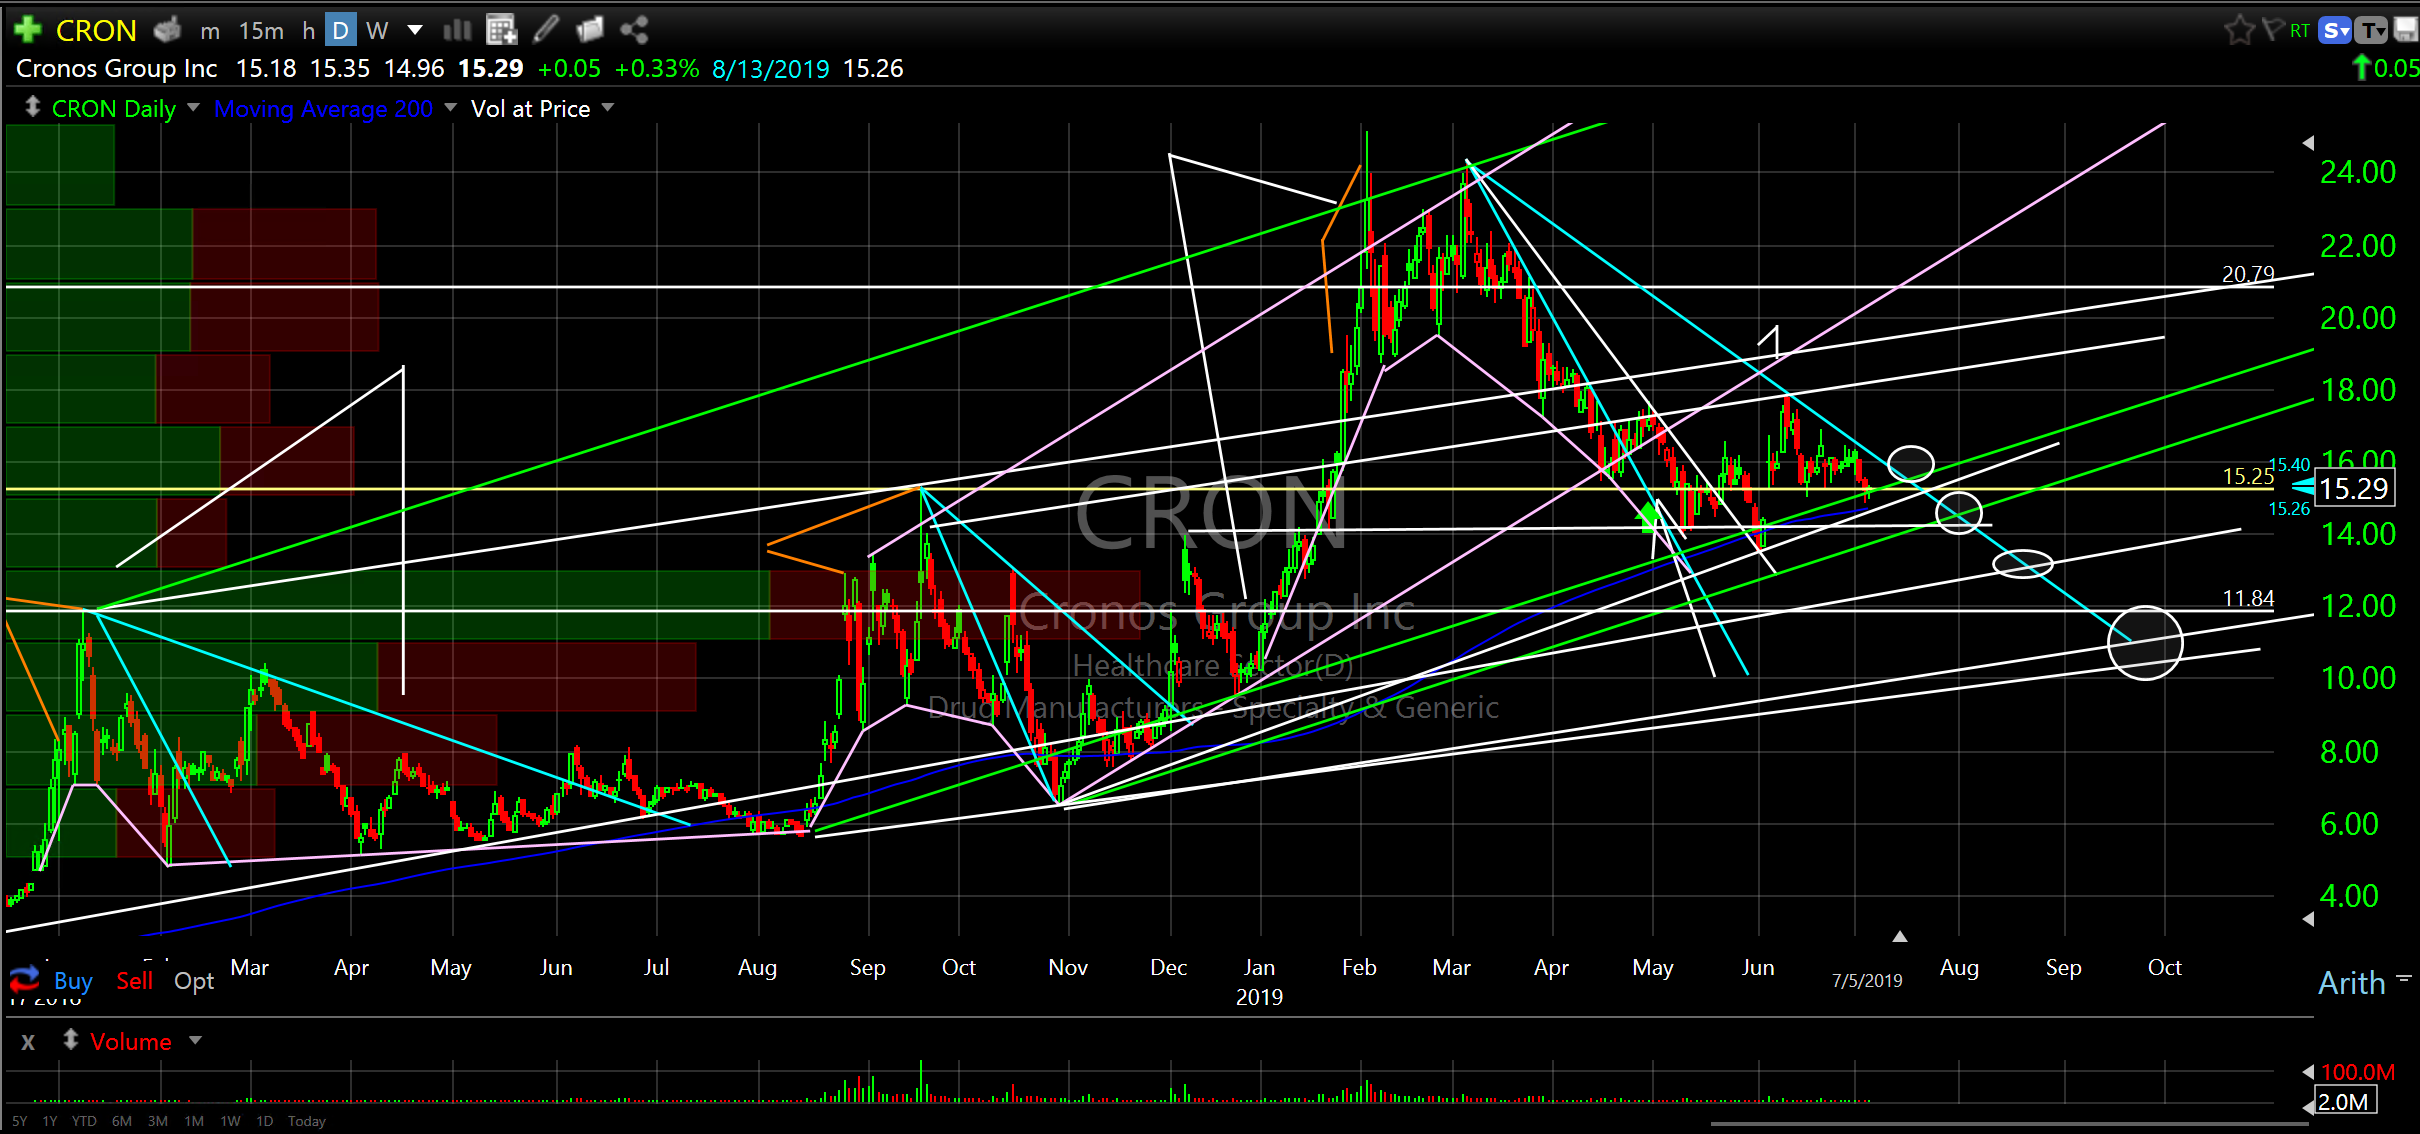
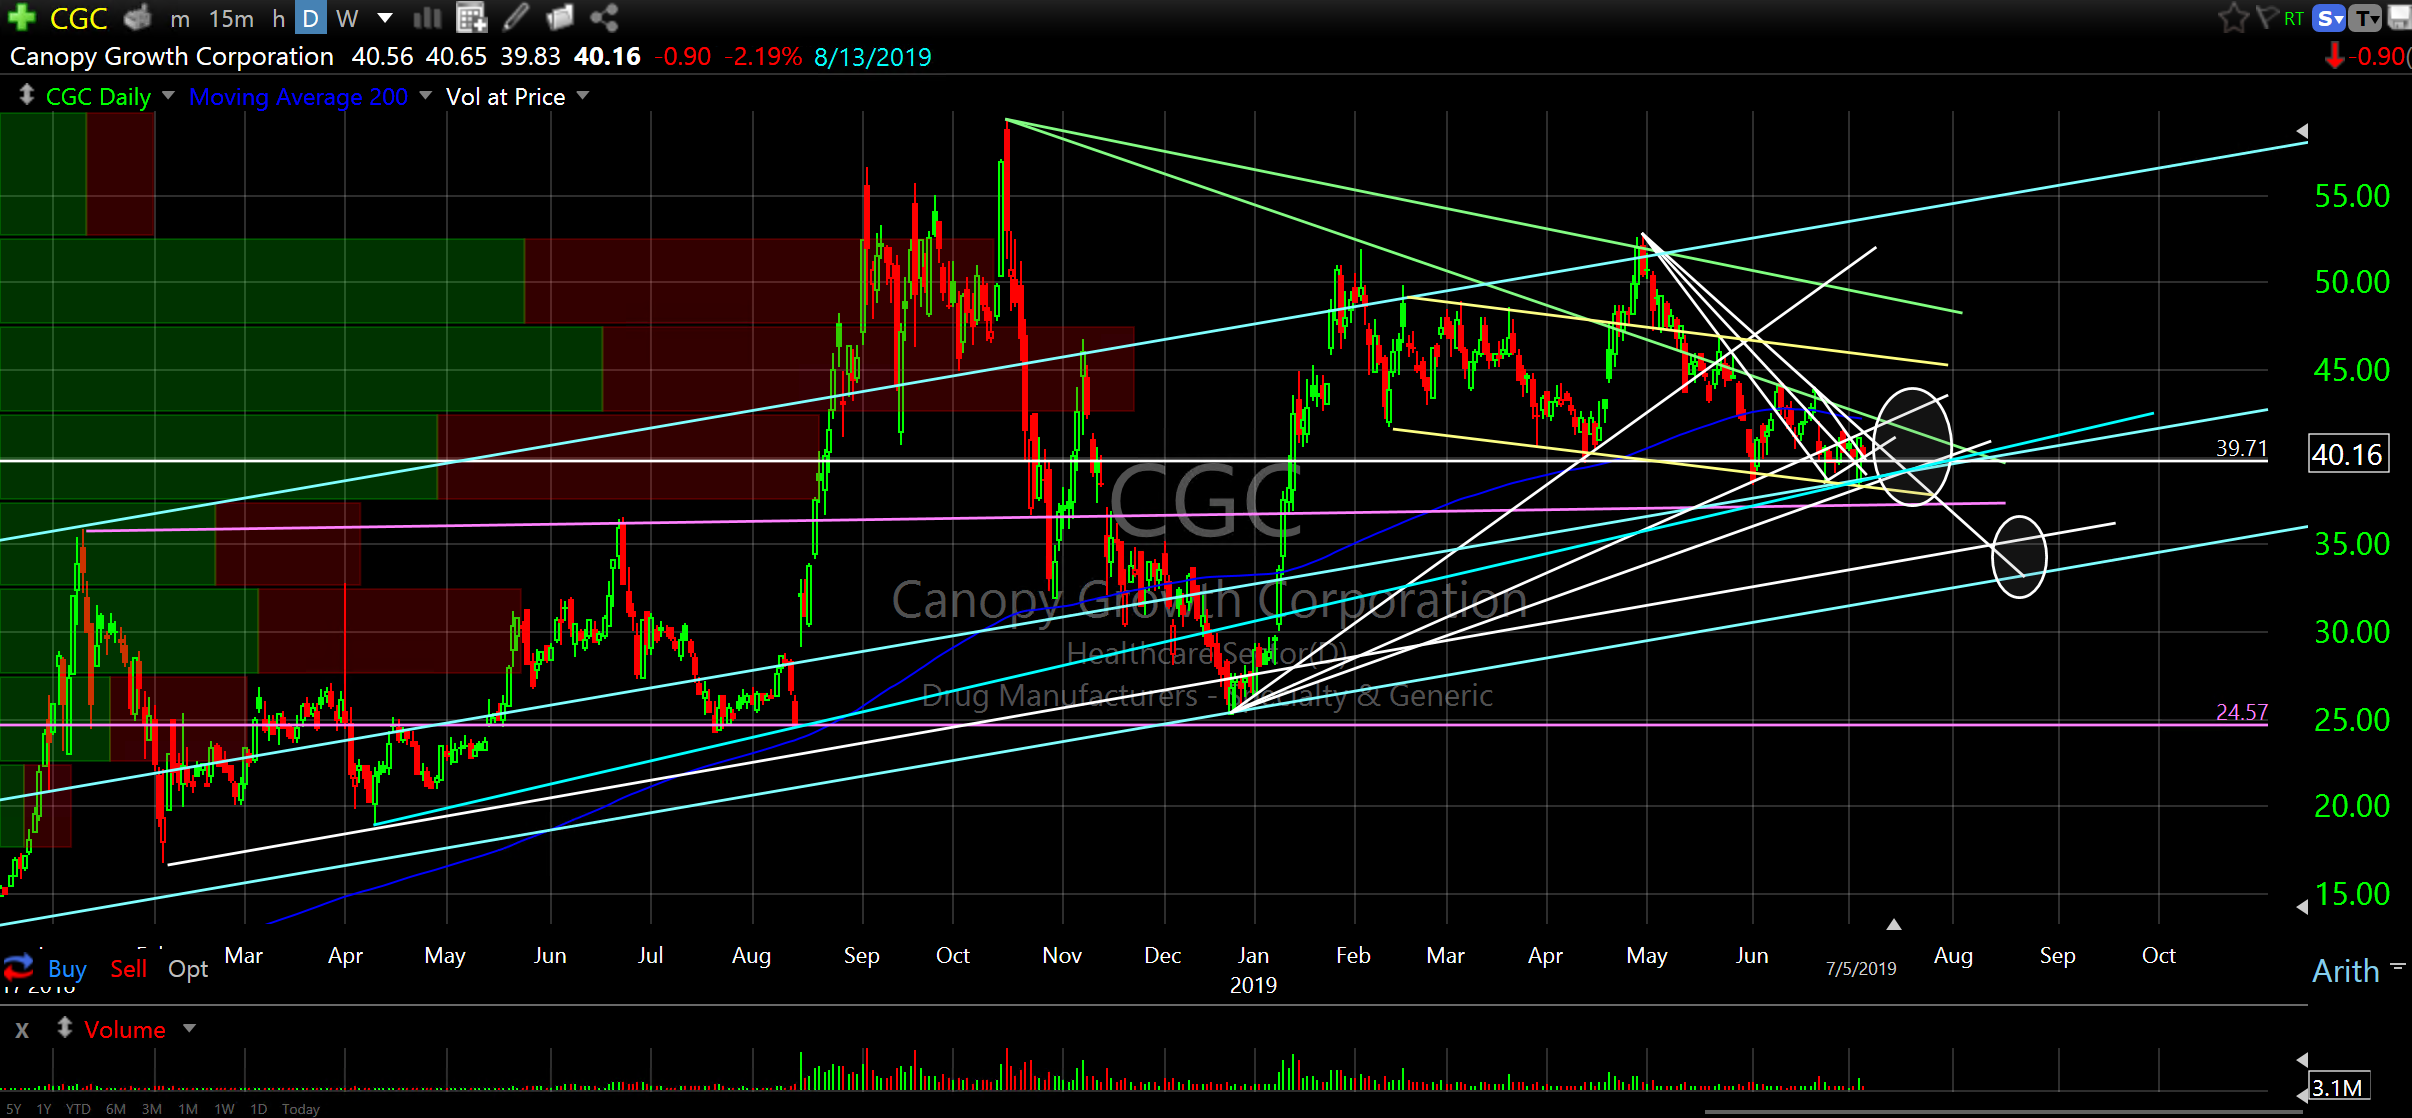
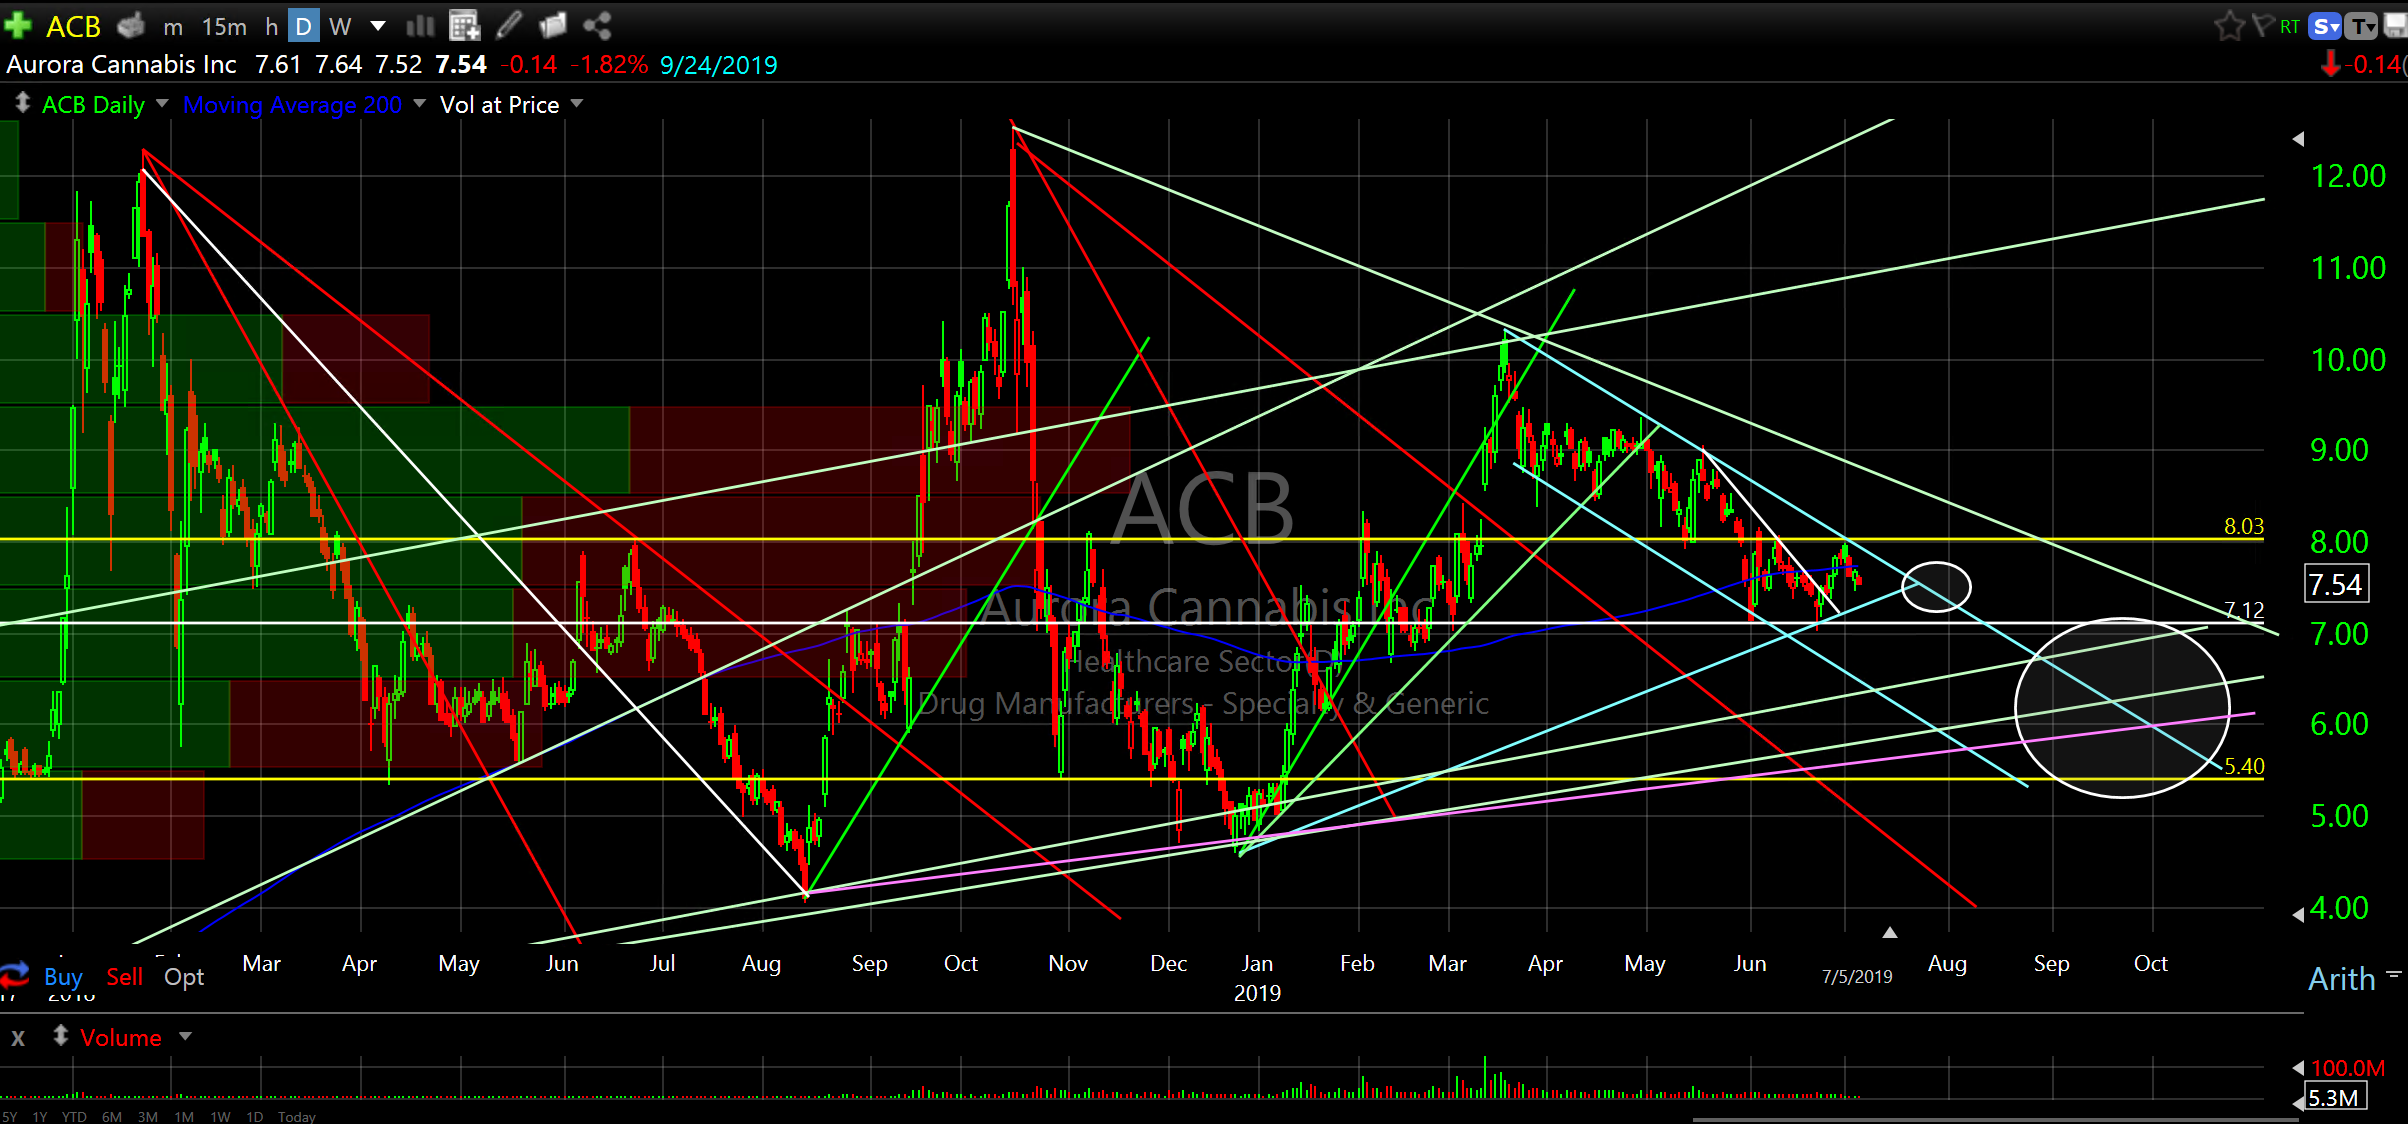
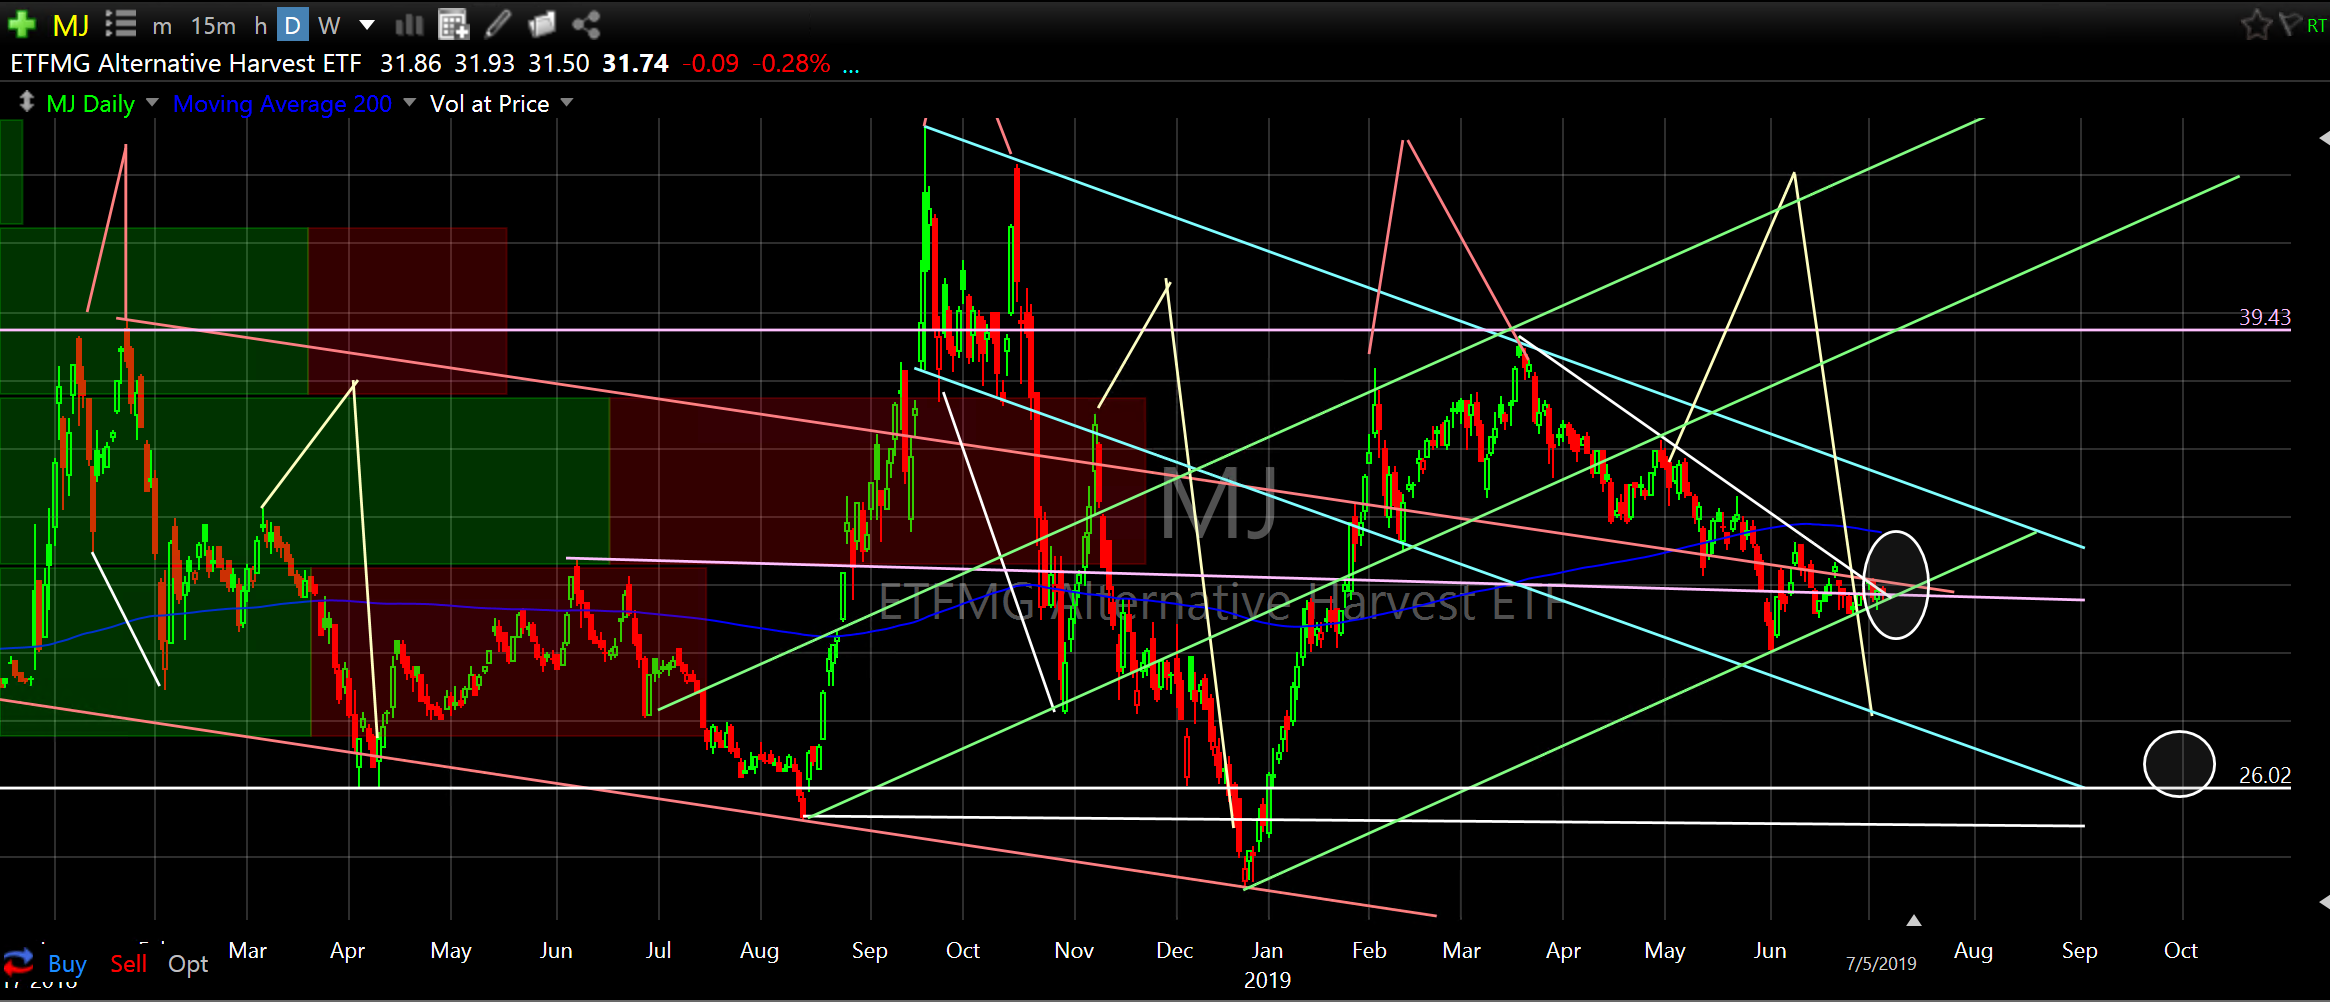
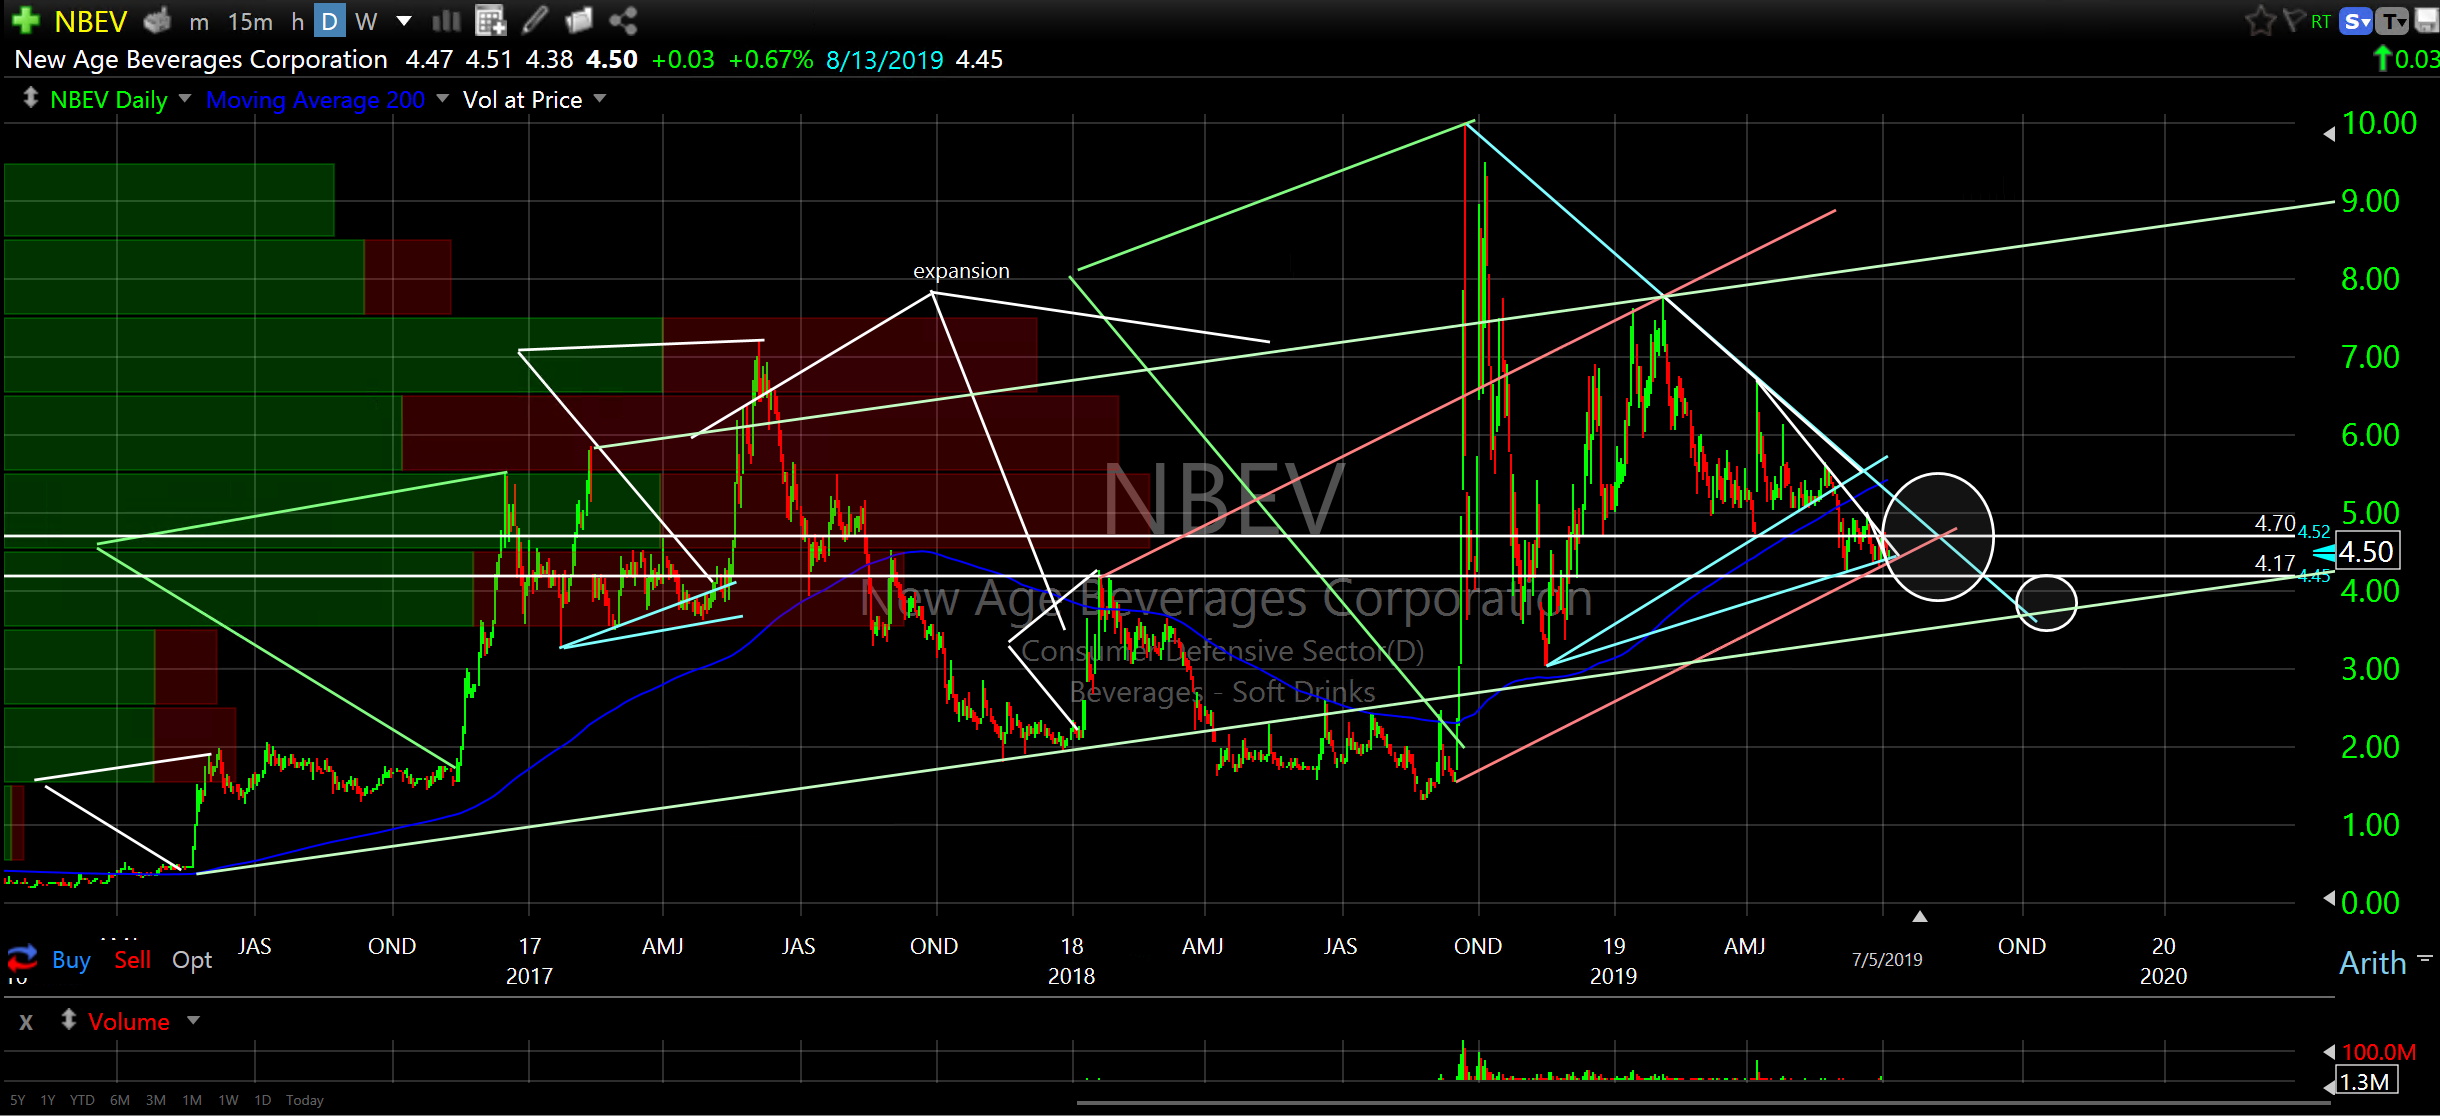
Check out the following weed stock/ETF charts. They are all looking like a reversal higher is getting close. I have circled potential entries/reversals with convergence of support and resistance whereby if resistance is crossed they are likely to spike quickly and if support is crossed they are likely to collapse quickly into the next support level. These are obviously volatile and pretty high risk but for those of you that are interested you might want to keep an eye out for the reversal. They may need to come down into a lower level if the broader market dips but it sure looks like they want to turn fairly soon for another cycle higher. See charts below. I am long CRON and NBEV. As usual, waiting for cross of resistance provides some confirmation of the move but usually results in a higher entry price. (see TSLA chart below for a good example of this).
The first chart is a comparison chart of the five stocks below so you can see how they trade relative to each other.
I have included New Age Beverages Corporation (NBEV) as I highlighted it several months ago, they do make a CBD infused drink and price action follows a similar path (see comparison chart).
Comparison chart (daily)
Cronos Group Inc (CRON) daily
Canopy Growth Corporation (CGC) daily
Aurora Cannabis Inc (ACB) daily
ETFMG Alternative Harvest ETF (MJ) daily
New Age Beverages Corporation (NBEV) daily
Biotechnology Set Up
The next chart I want to share is Lexicon Pharmaceuticals Inc (LXRX), a biotechnology company. It is highly volatile and risky. But…please study the chart. Look at the repeating cycle rotation of expansions and collapses. It appears to be at the threshold of another expansion that could occur over the next year.
Lexicon Pharmaceuticals Inc (LXRX) weekly
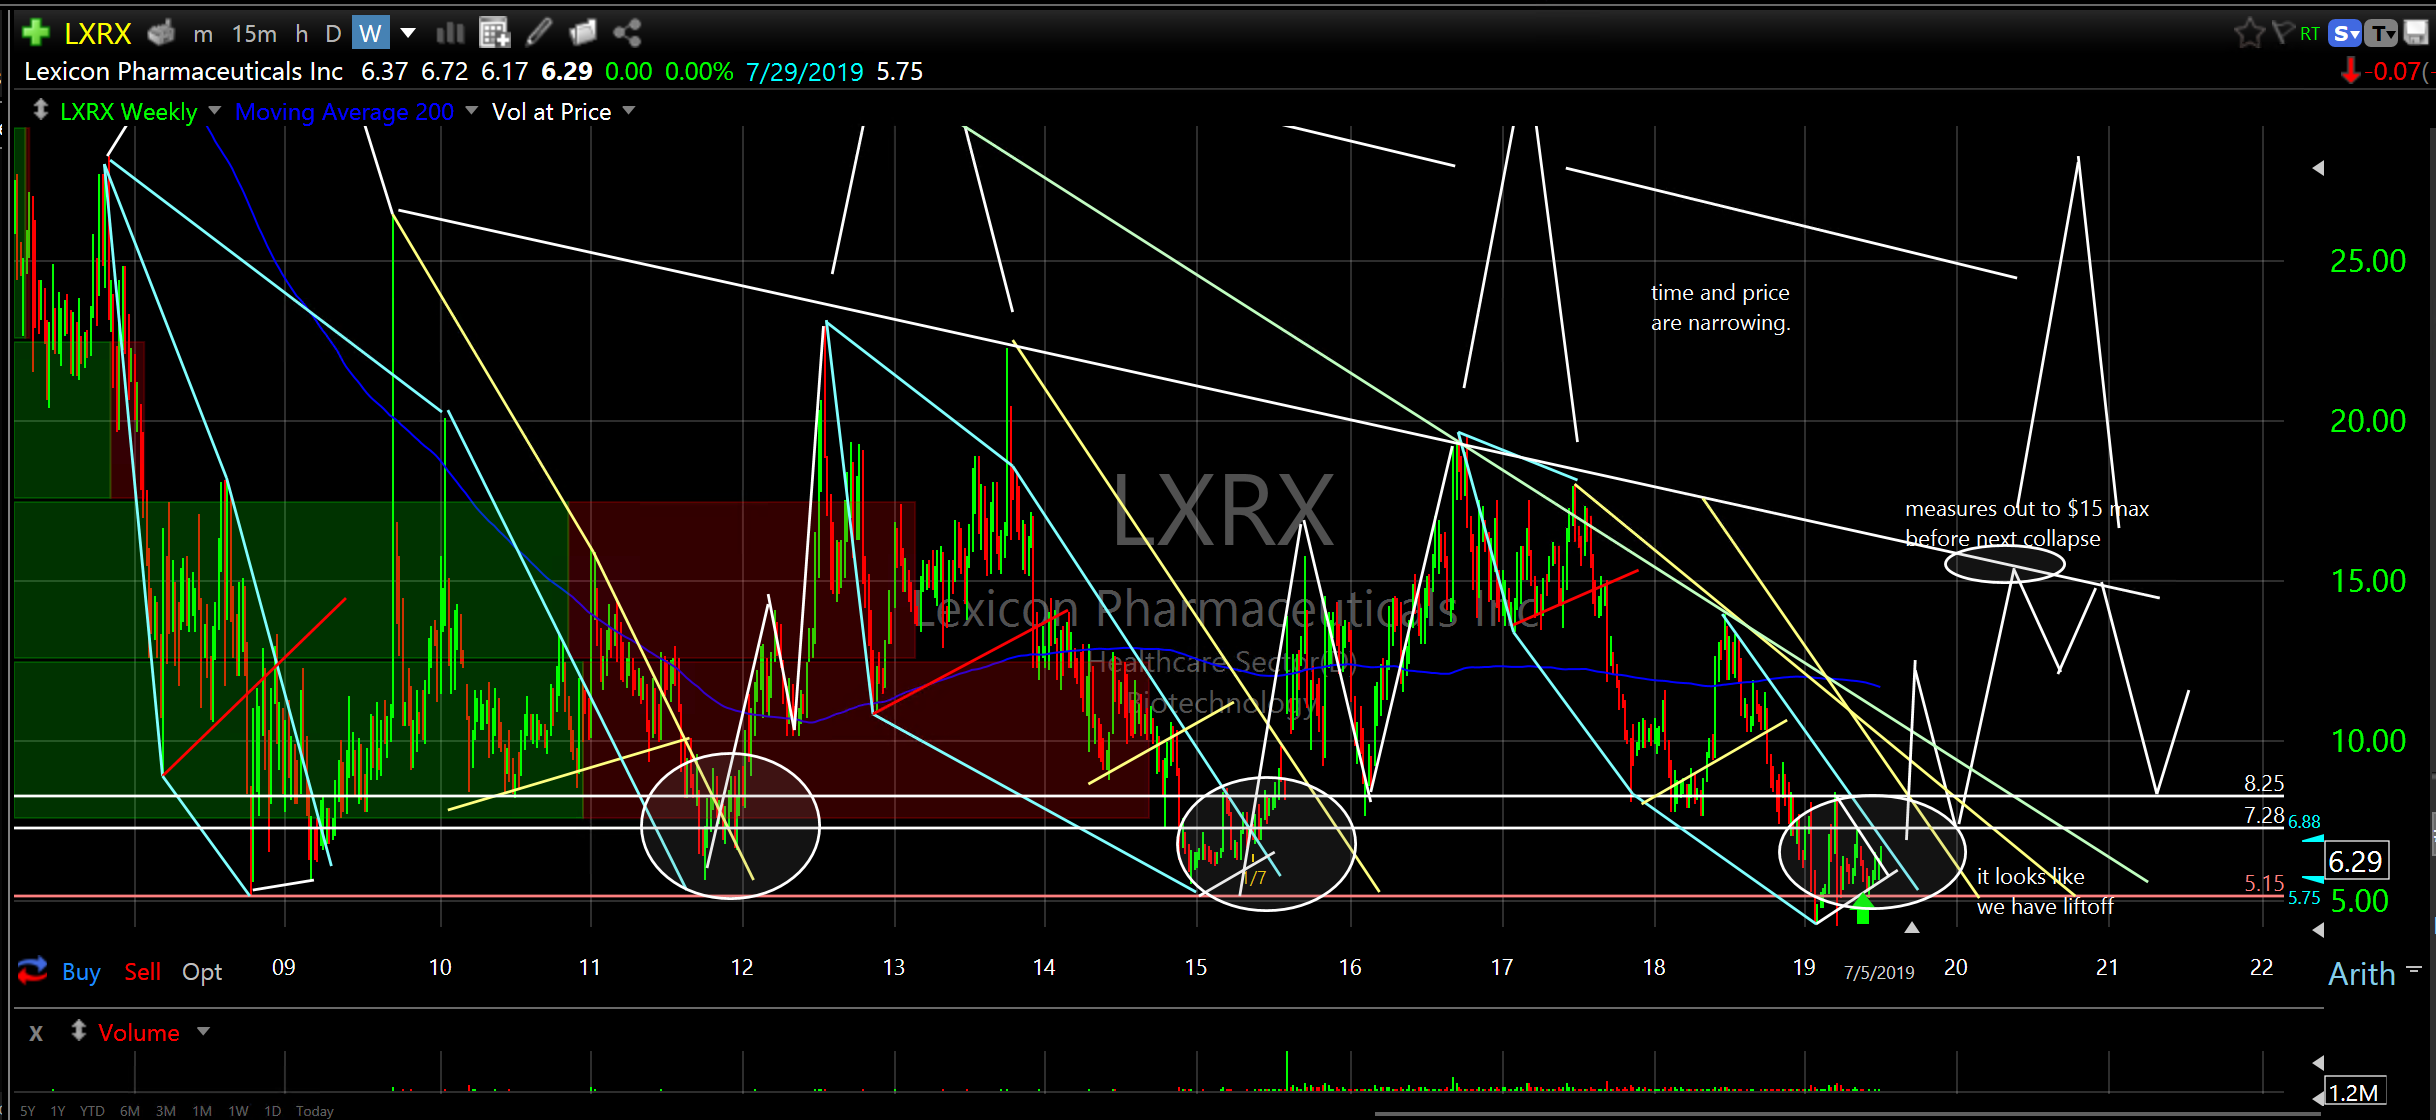
I’m showing this as more of an exercise to follow price action over the next year to see how close it can hold to the repeating pattern. I own a little from $6.90. I will put it on the “Entry” list so we can follow it together to see how it plays out. I am not “recommending” it as it is highly speculative but it should prove interesting to follow. This does not mean you shouldn’t buy it but know that it is risky. The repeating price action itself is just amazing to me. Let’s see if it repeats again.
Zoom Zoom
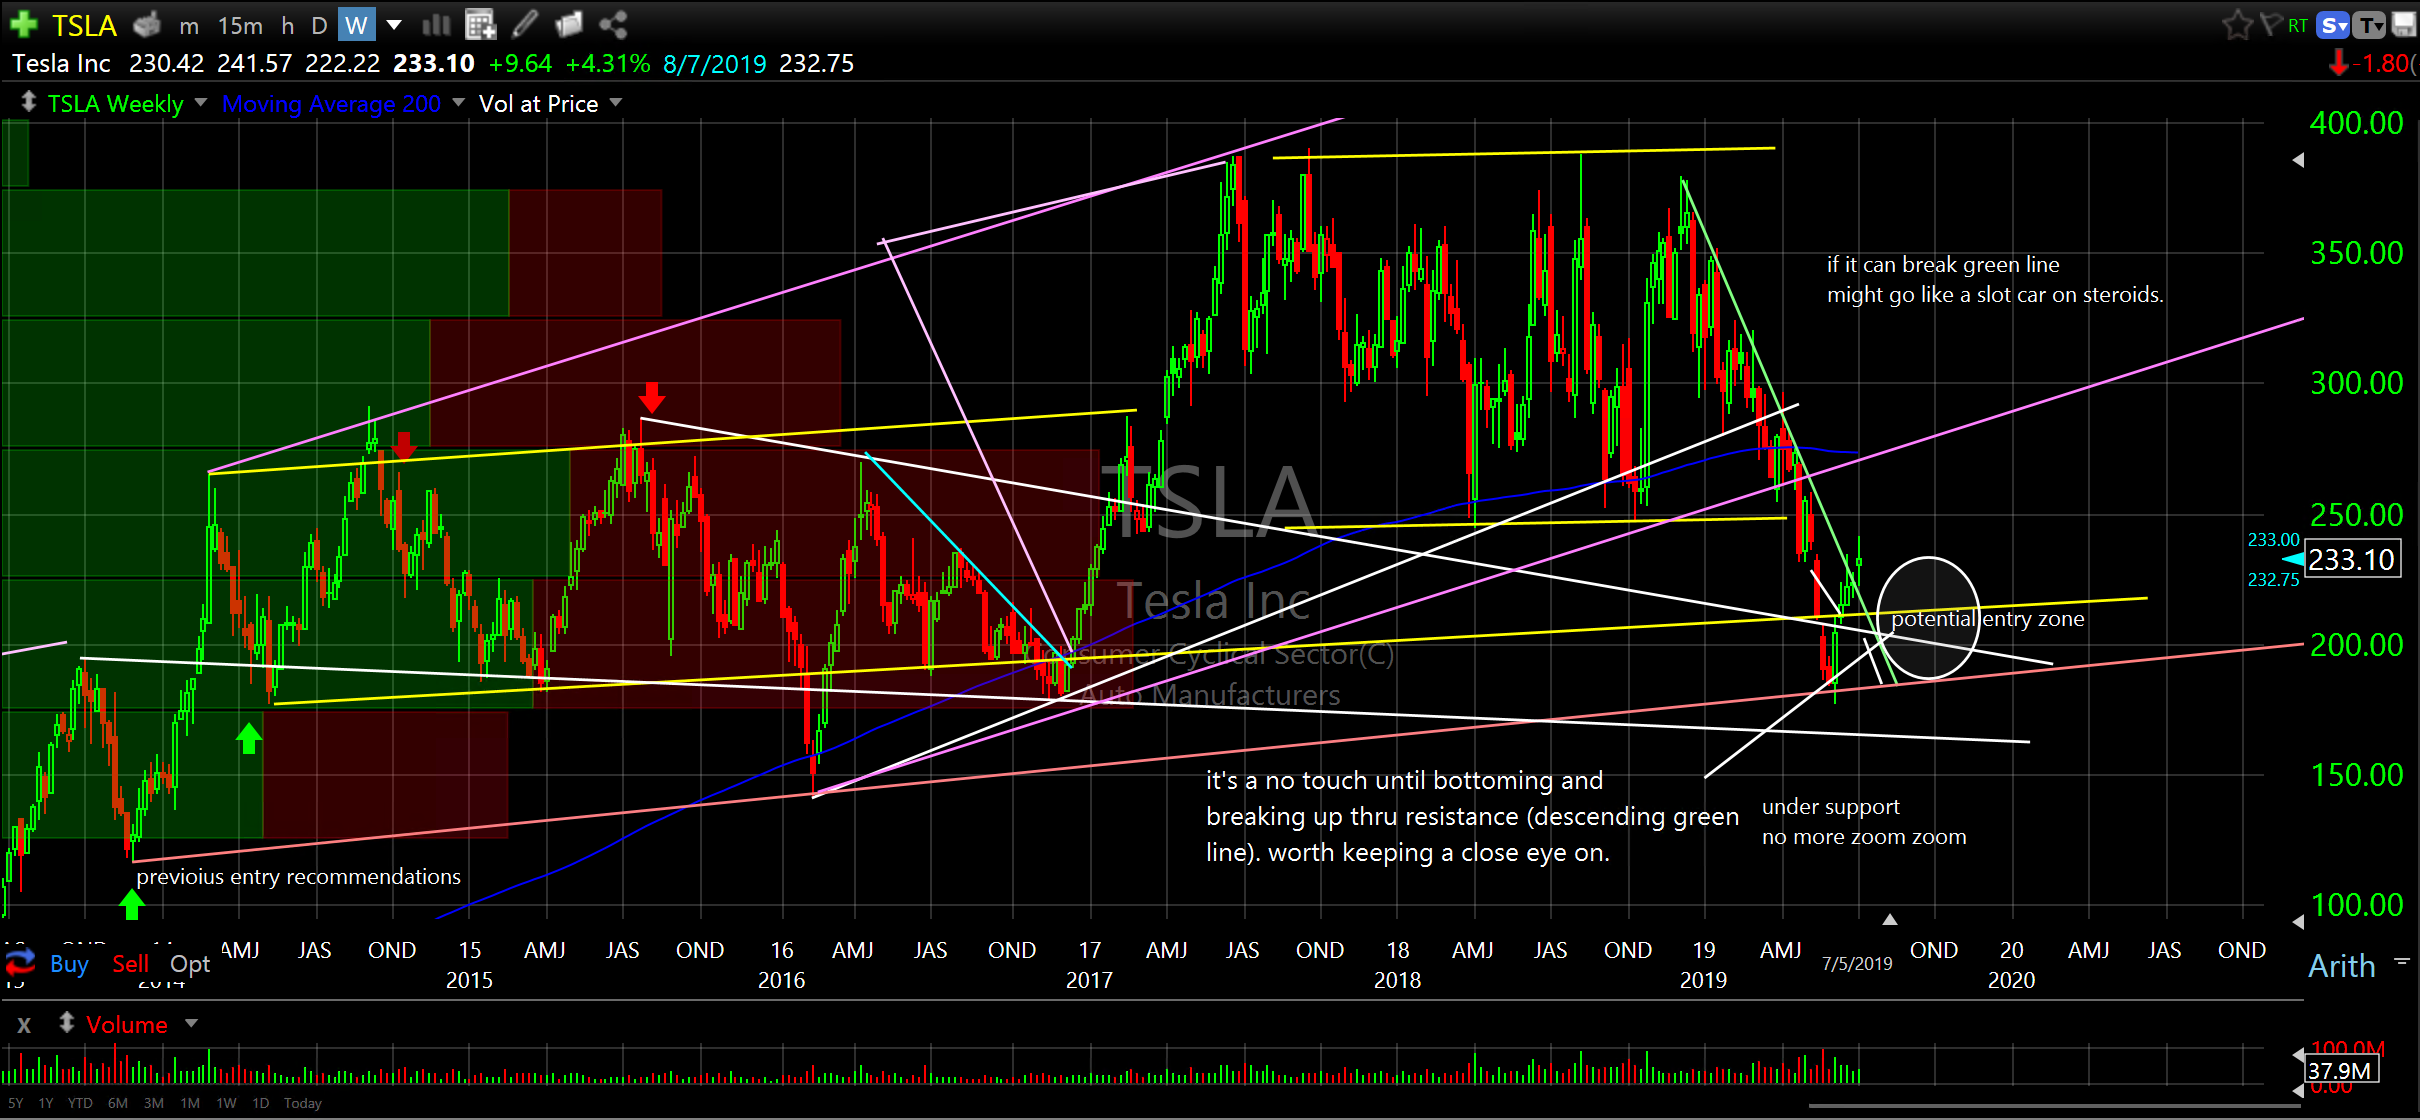
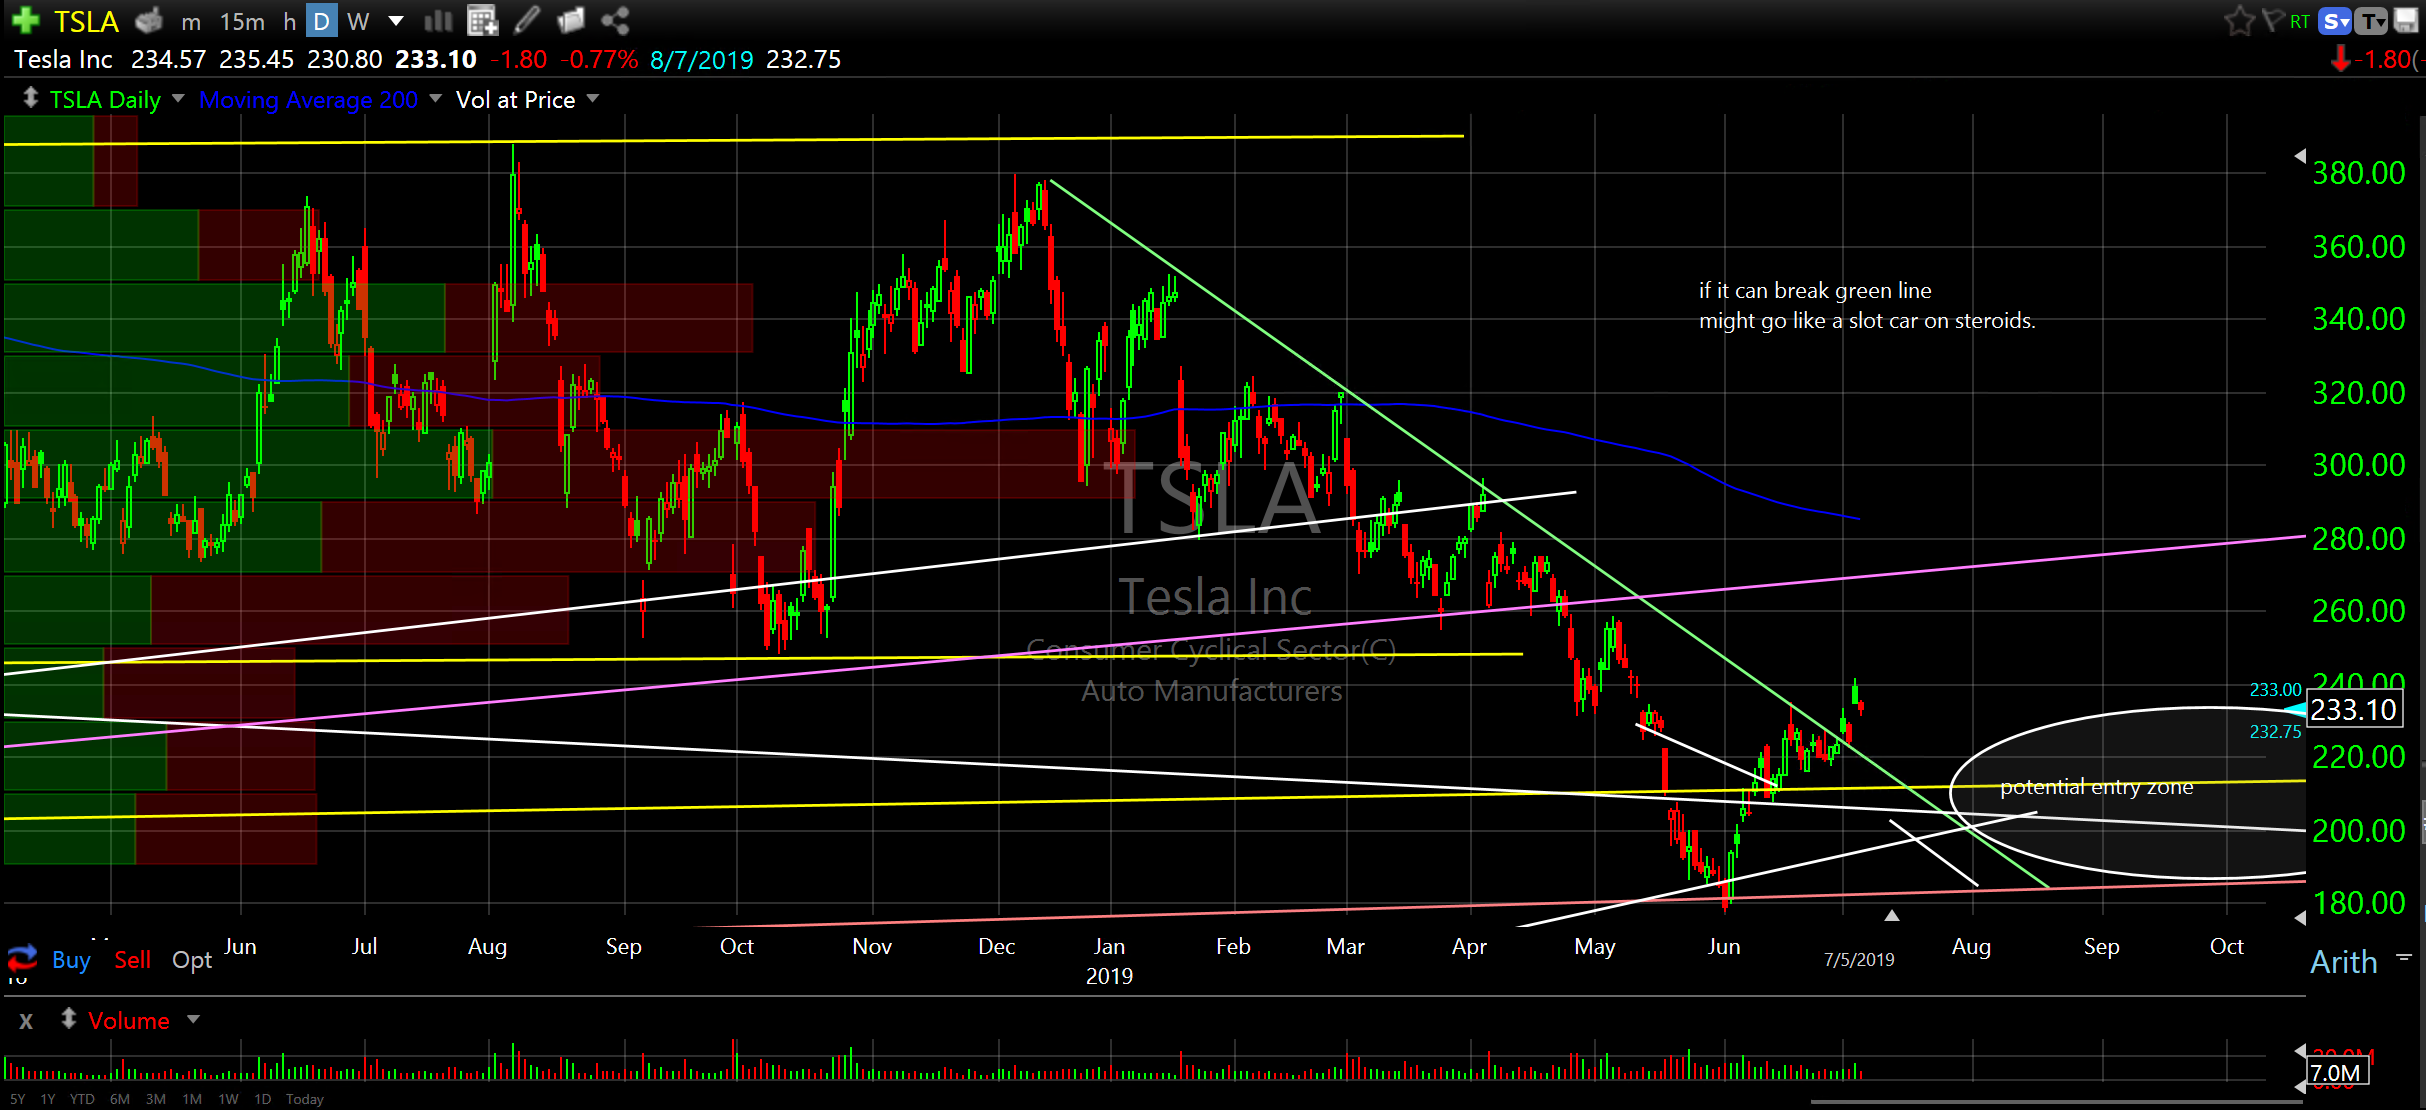
Tesla Inc (TSLA) recently broke out. I had it charted and was anticipating a bottom around $185 after collapsing over 50% in the past six months. It ended up bottoming at $177 and has run up 31% since. I didn’t miss it. I saw it. I watched it happen. I was just too scared to take the trade. I just couldn’t pull the trigger. Fear had me. It happens. Now, it has run up so much it is likely to pull back soon even though it has just crossed resistance. I have traded this successfully multiple times, as many of you know. You can see the buy and sell arrows on the chart. I love TSLA but this time I just couldn’t do it. There will be other opportunities. Another lesson learned again…sometimes the best trades are the most difficult. Live and learn.That’s what it’s all about…right?
Tesla Inc (TSLA) weekly
Tesla Inc (TSLA) daily
I hope this gives you some ideas and contributes value to your investing/trading experience. Let me know if you have any questions.
Lots of people in Carlsbad but nice to be at the beach,
Don