Lots of good looking charts out there in Chartland. I’m trying to keep up. While a summer dip is on my radar, the next 12-18 months are looking good.
Notes and annotations on each chart. Green notes are current. Sorry about leaving all notes on charts if they are confusing to you. I just think it’s important to leave them for reference as they contribute to transparency and help all of us along our learning curve.
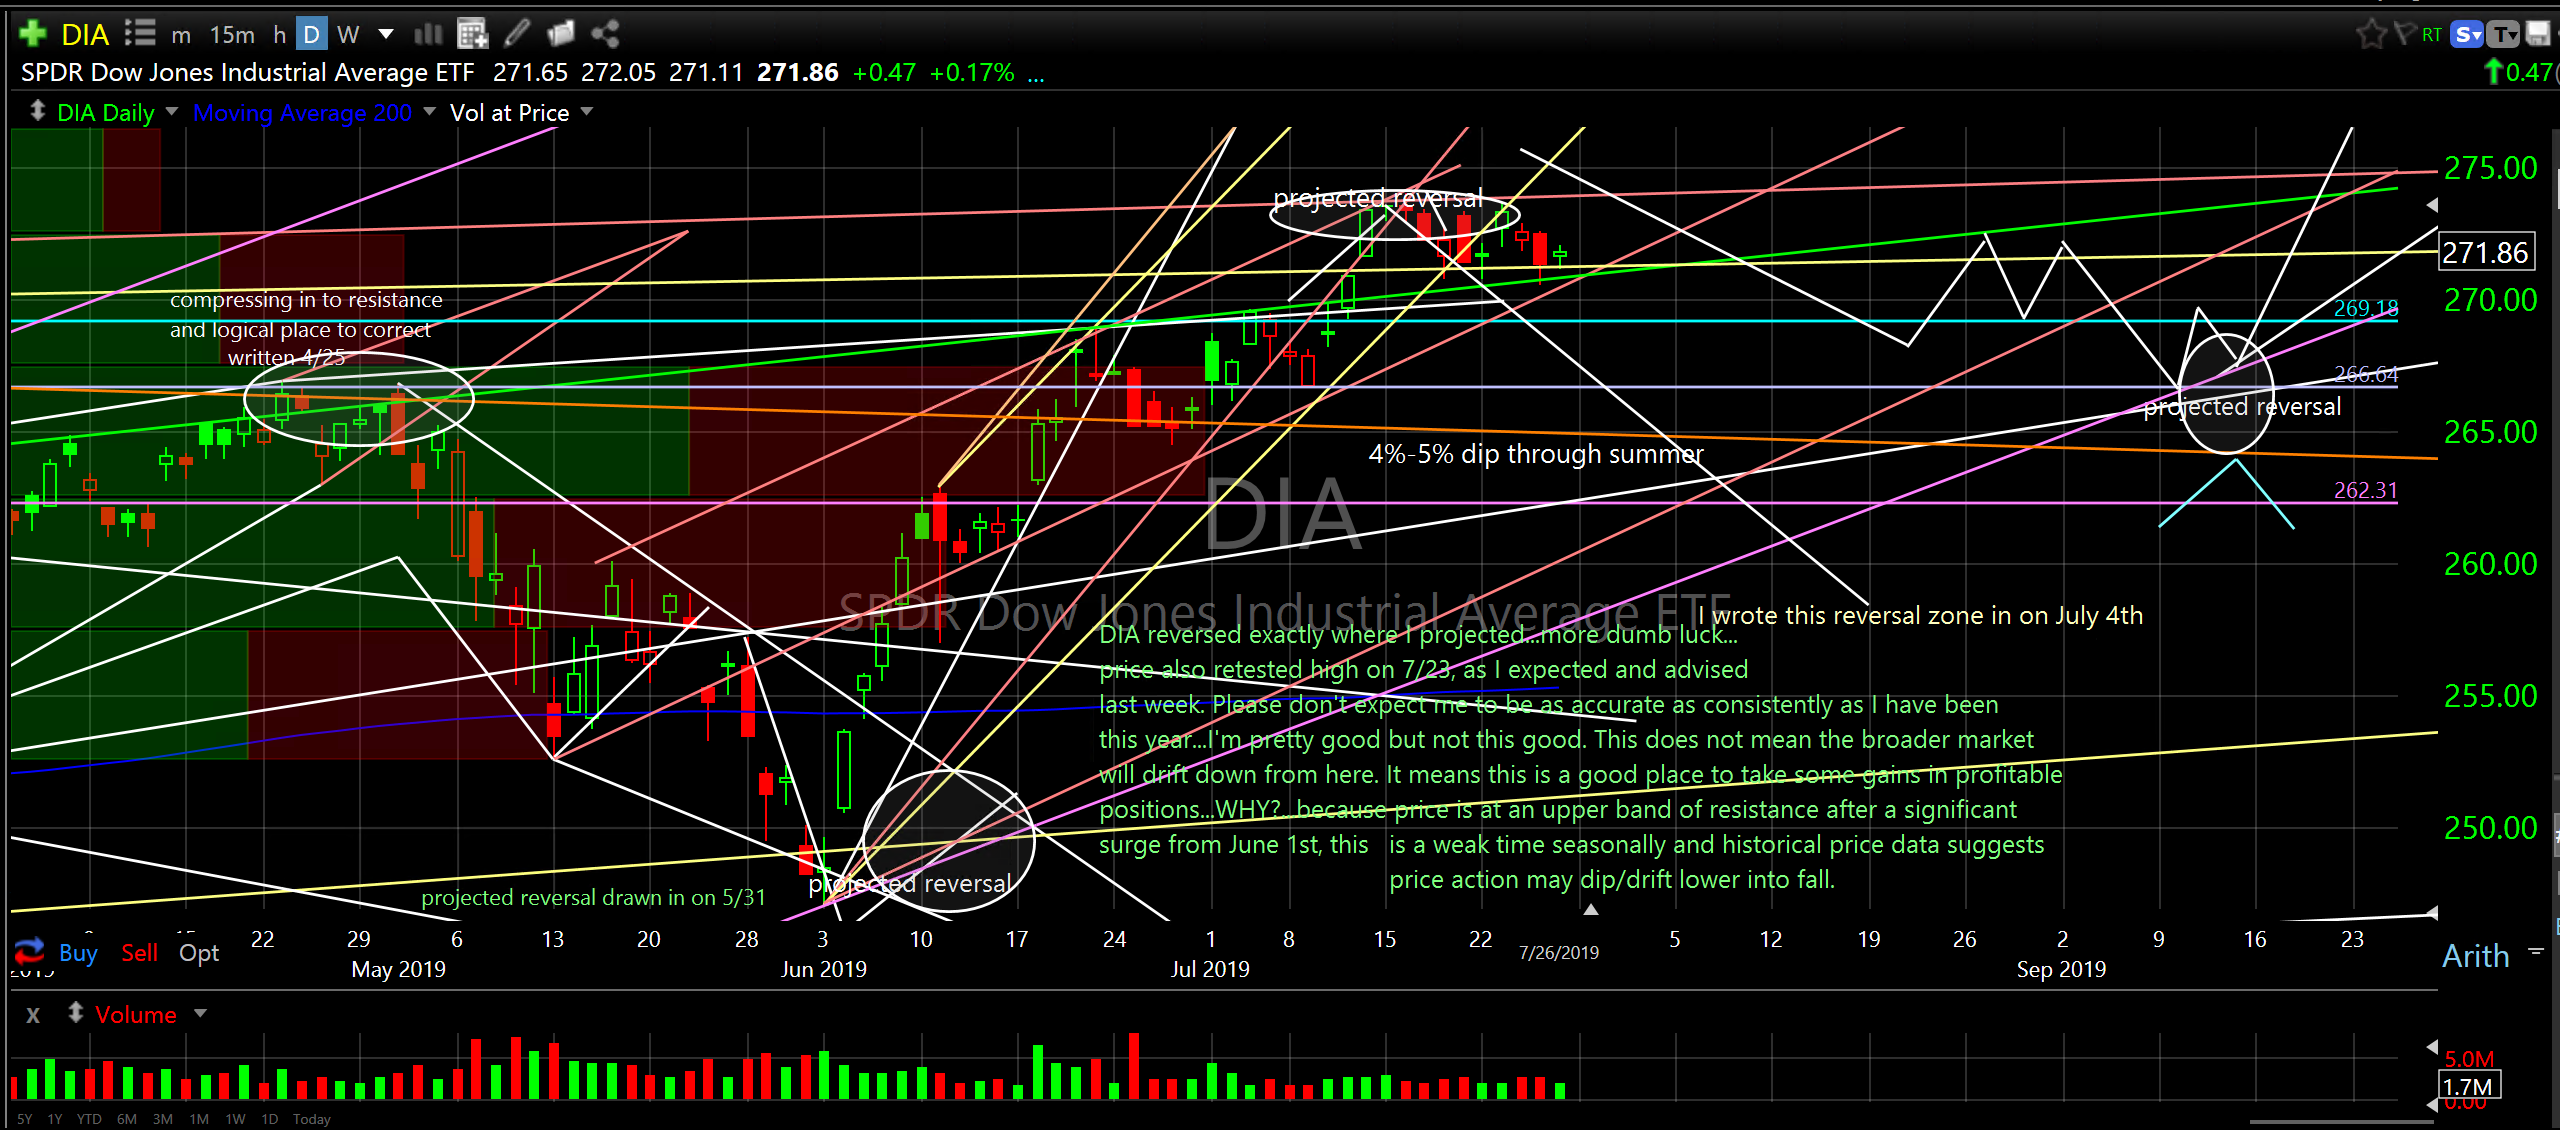
As usual, I start with an overview of the broader market as it has so much influence over individual securities. I follow up with a few charts that I have highlighted recently and a few that caught my eye this week.
SPDR Dow Jones Industrial Average ETF (DIA) daily
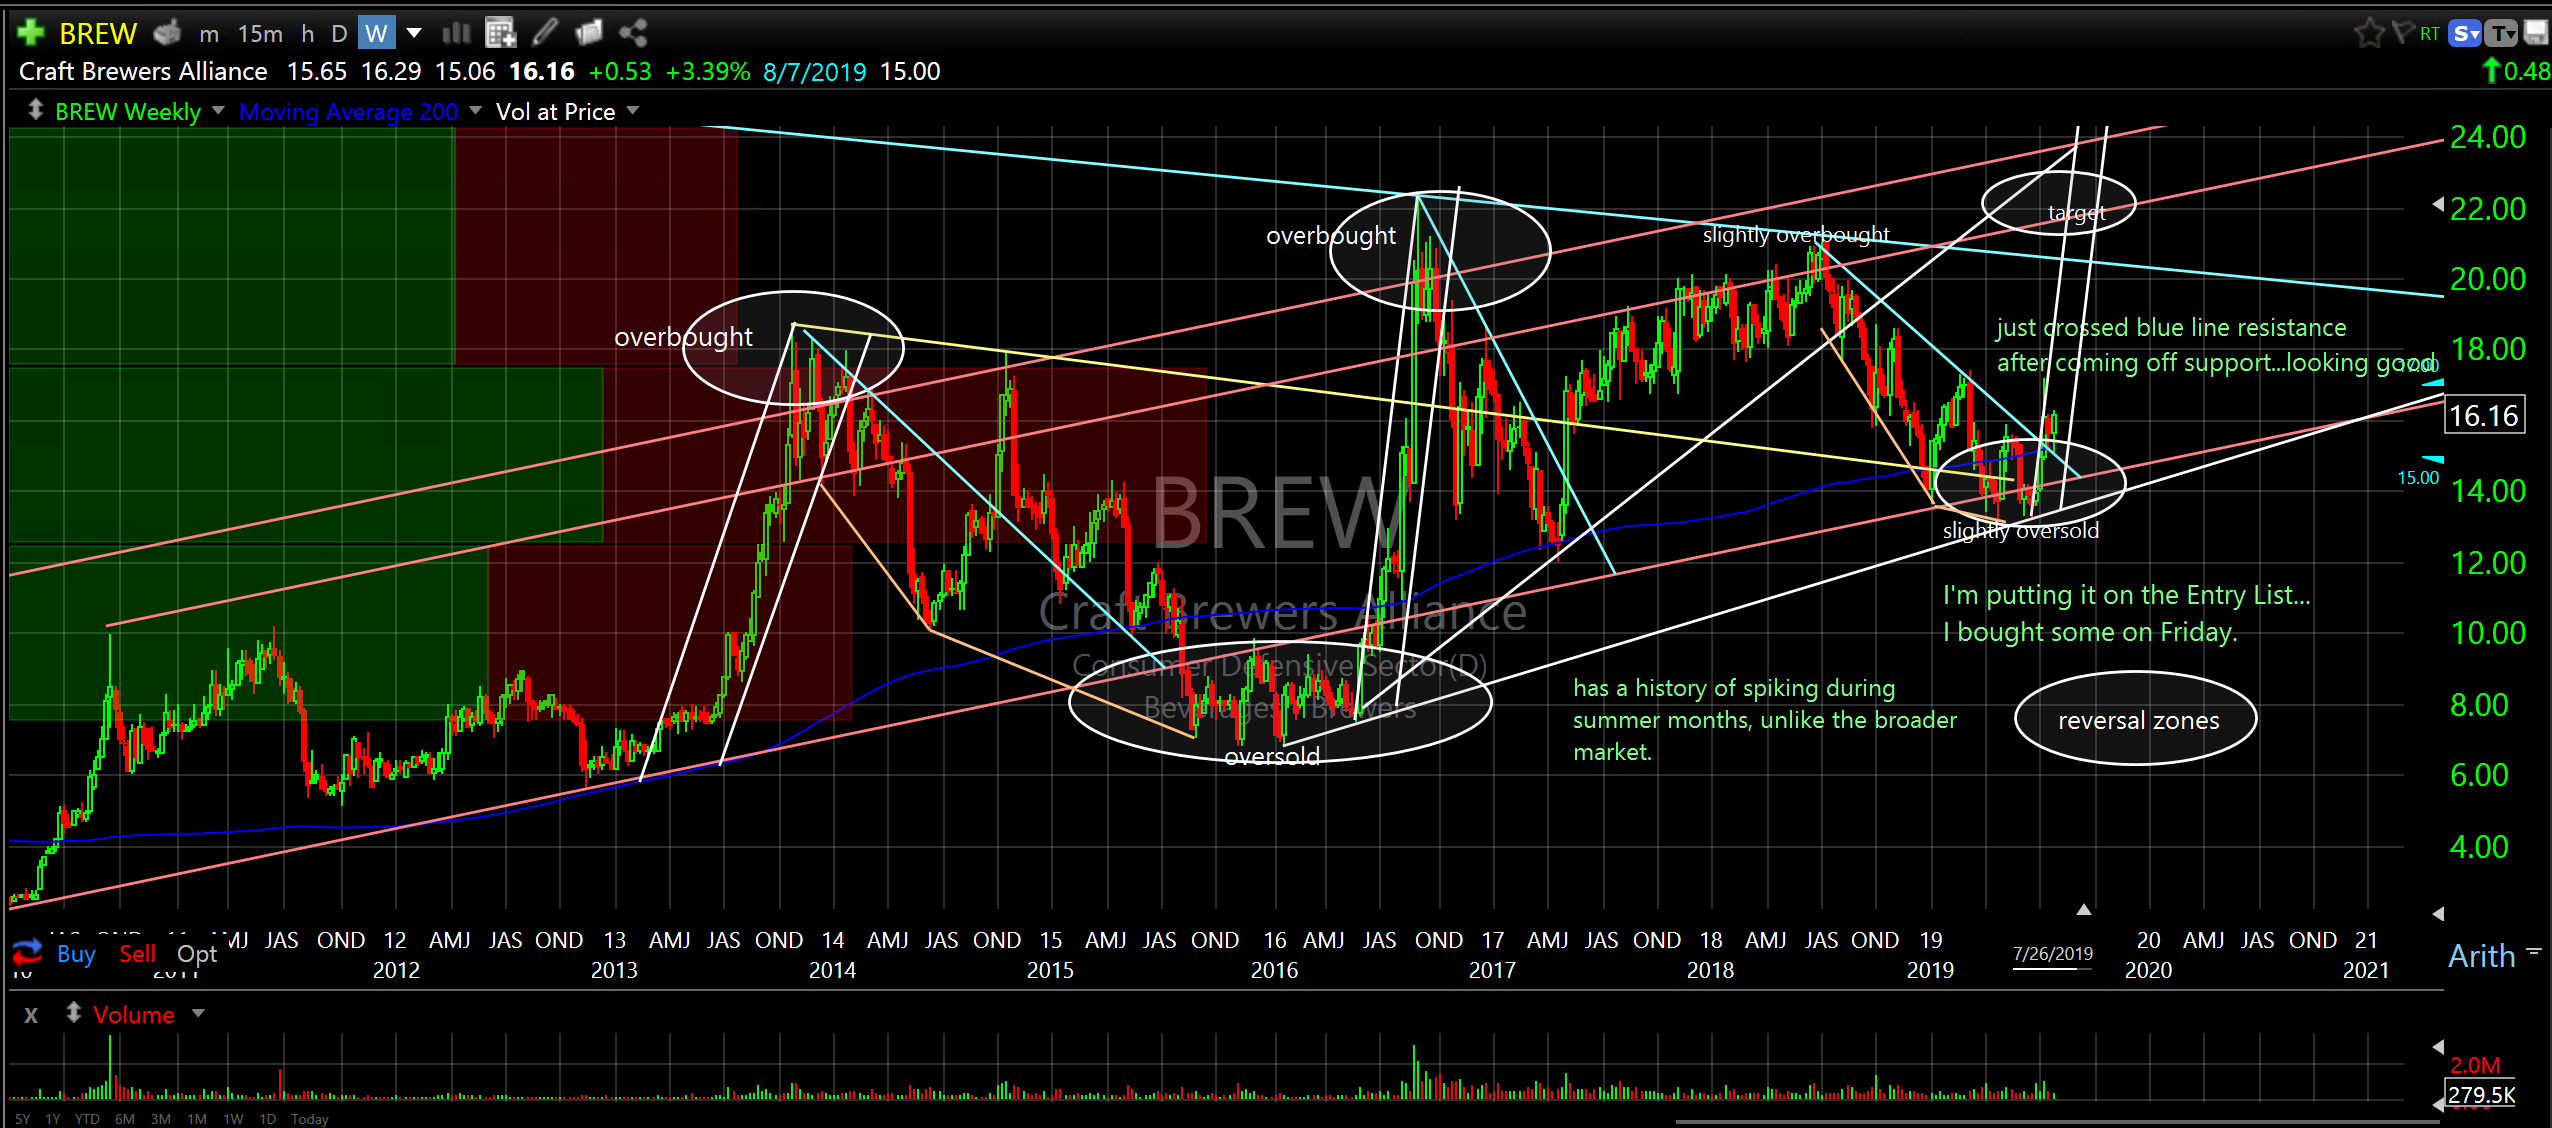
Craft Brewers Alliance (BREW) weekly
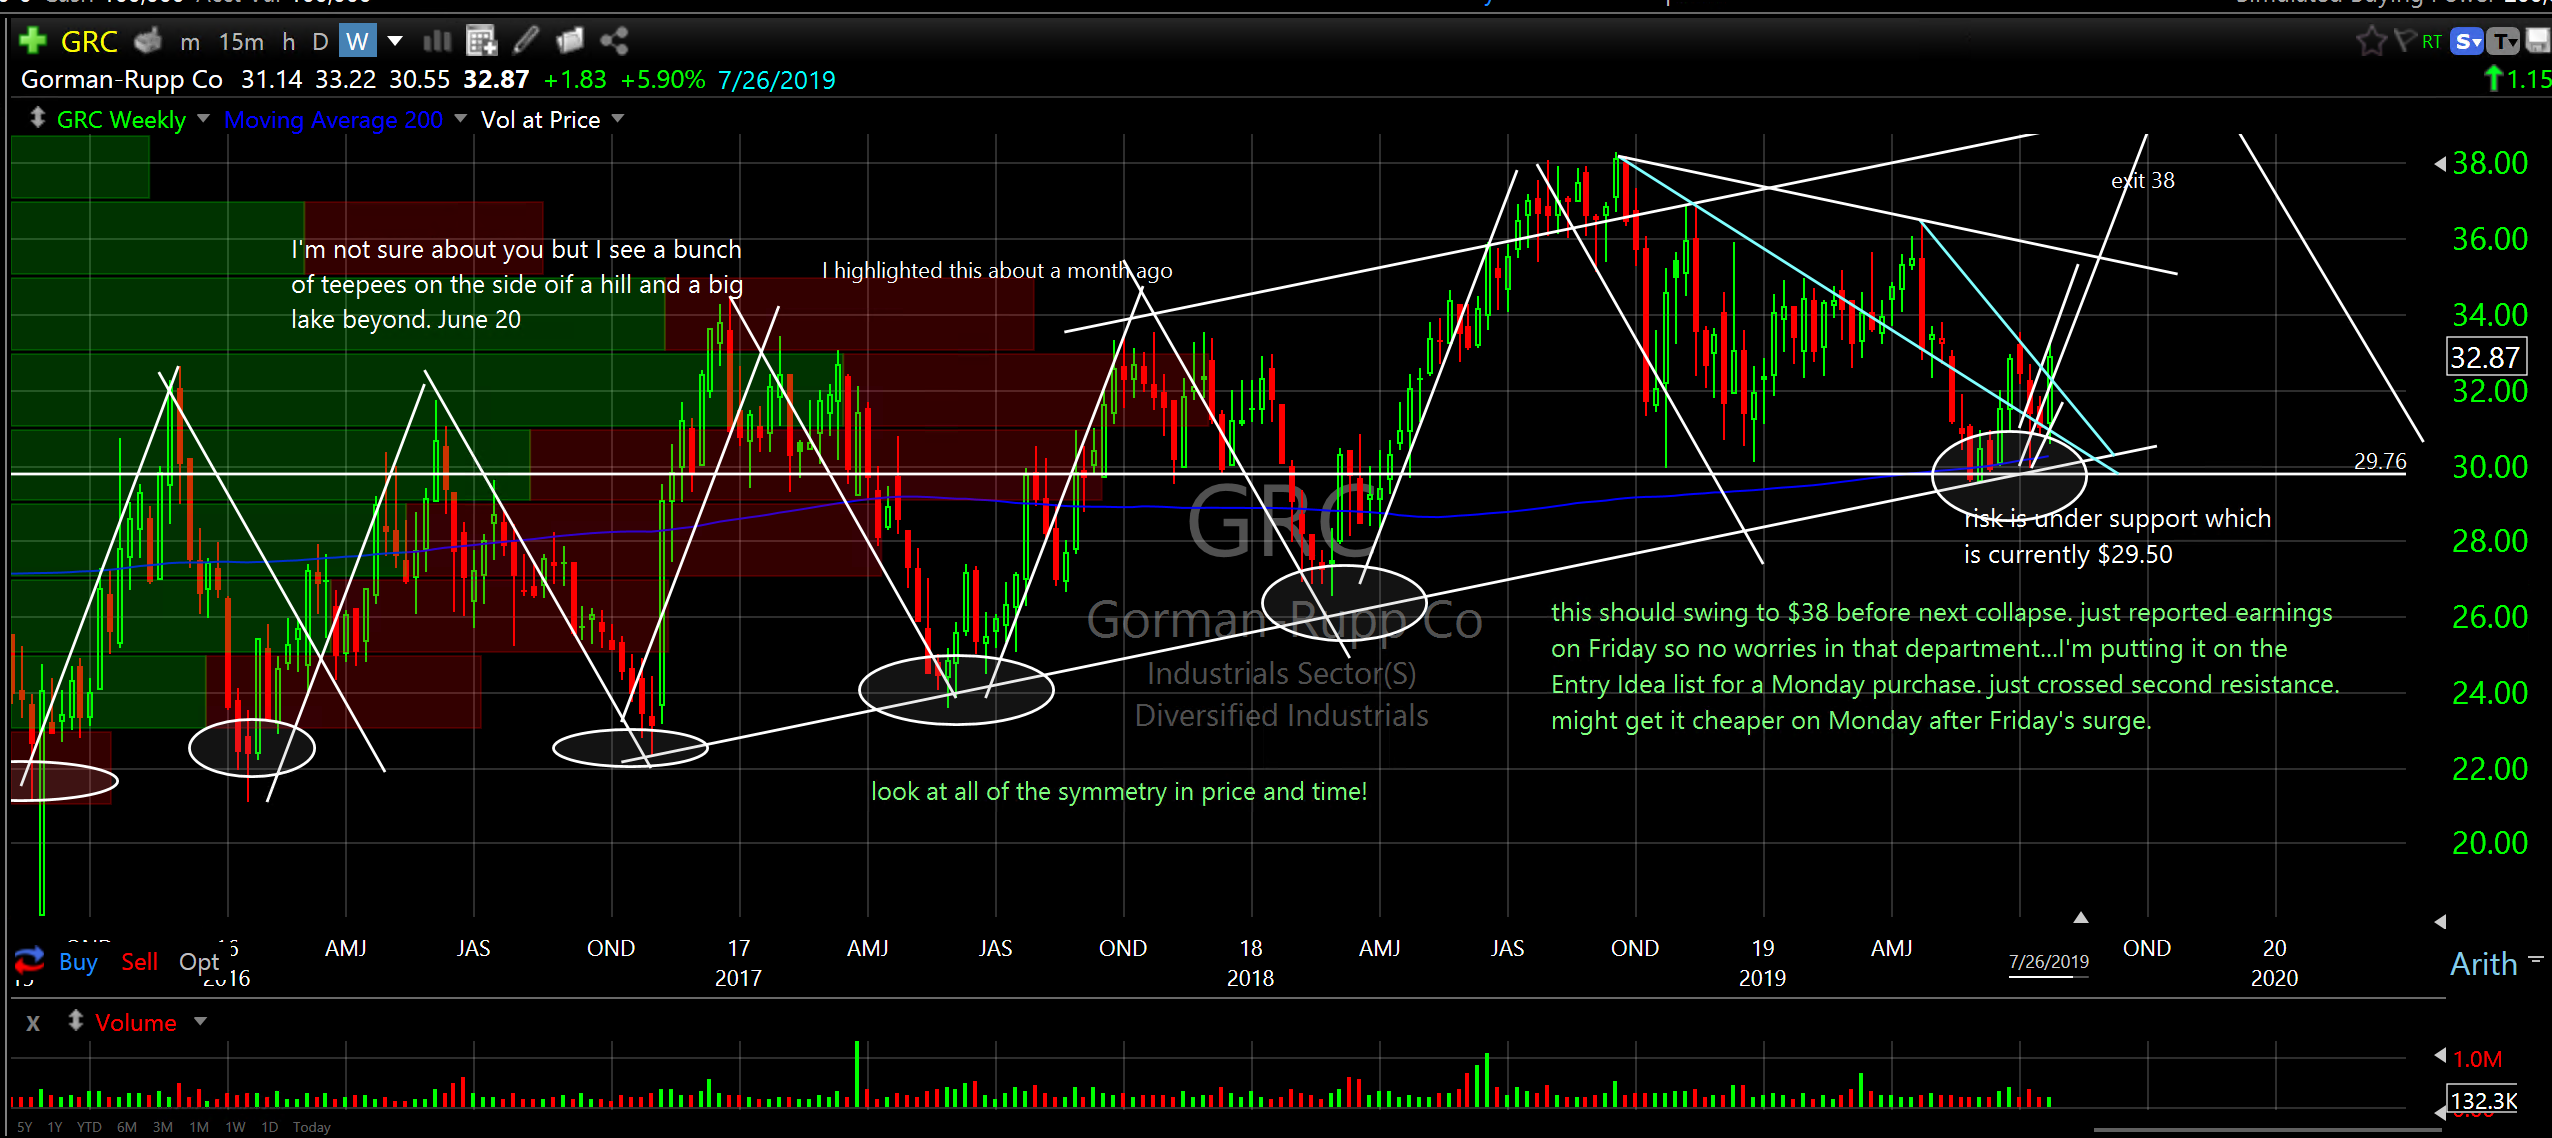
Gorman-Rupp Co (GRC) weekly
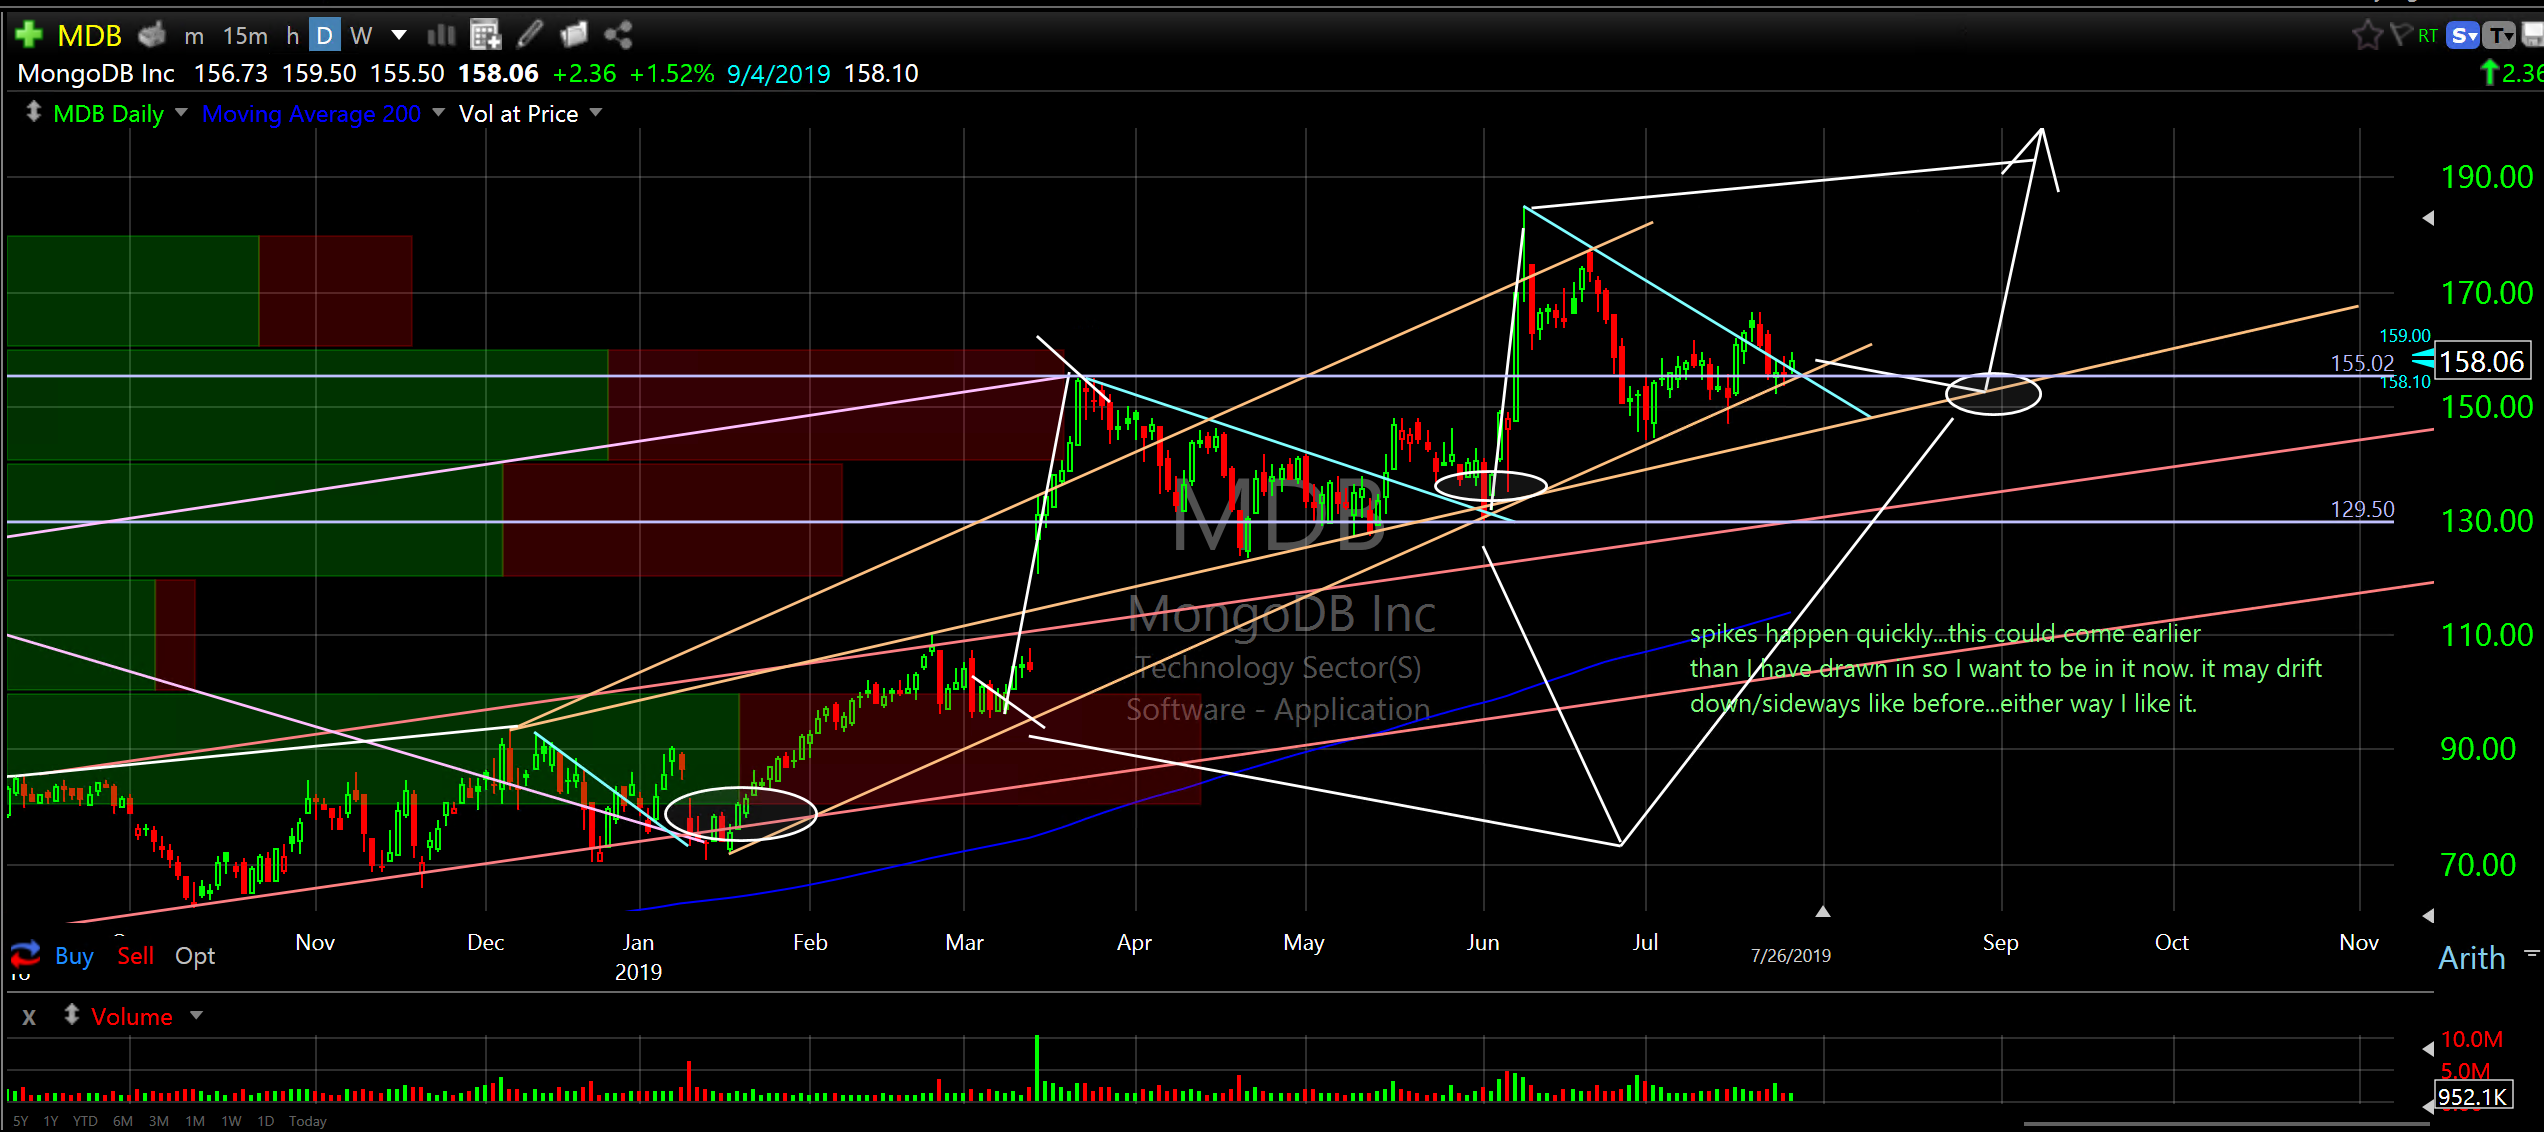
MongoDB Inc (MDB) daily
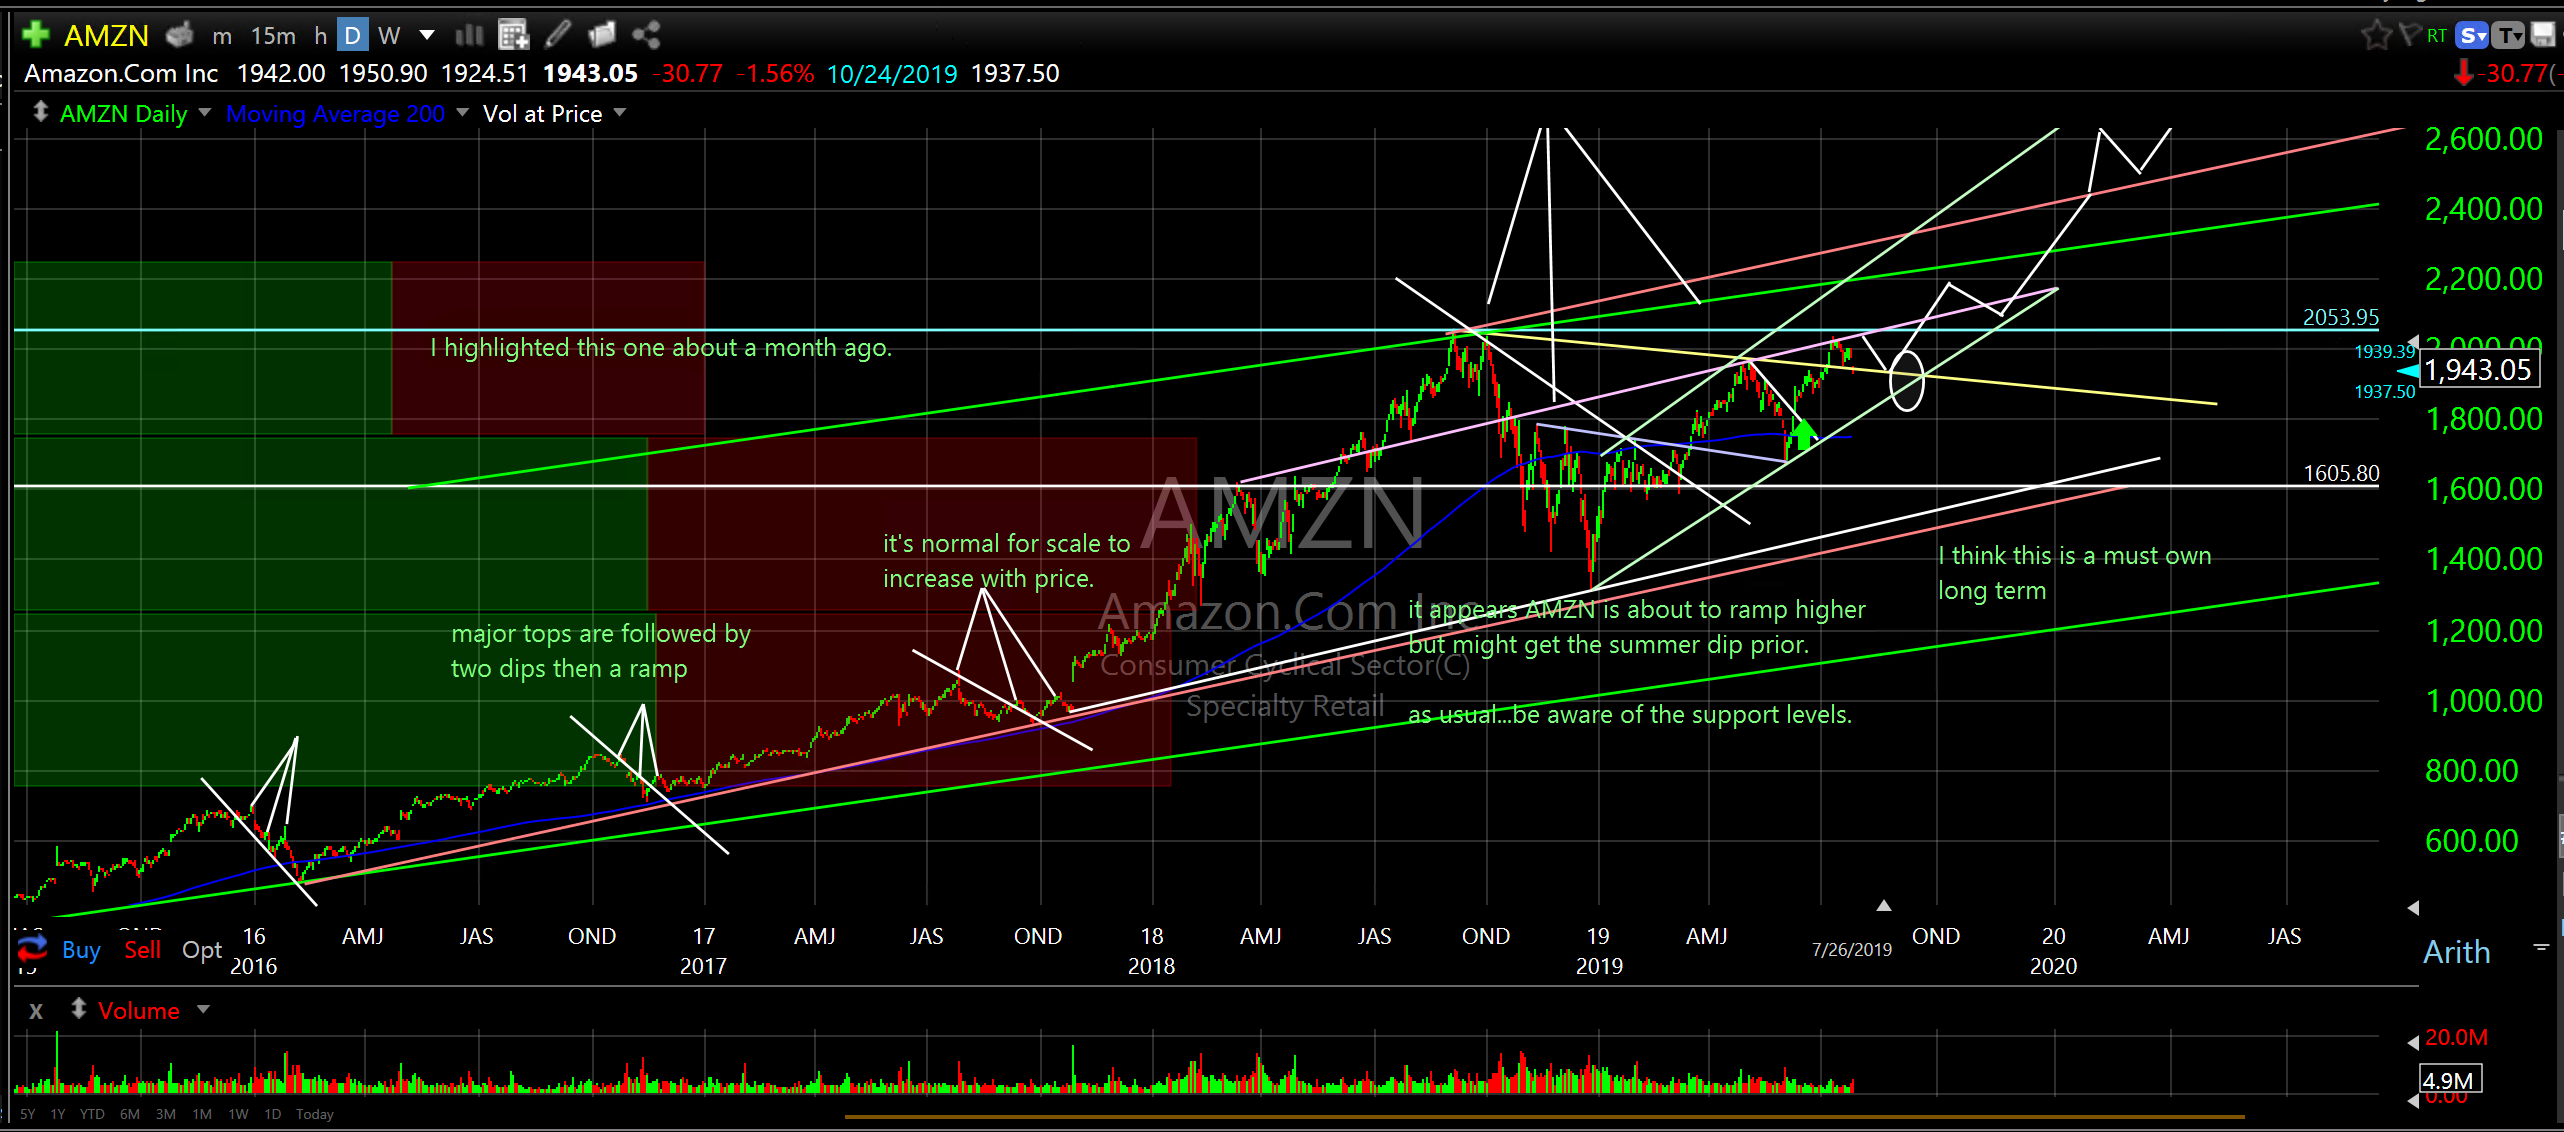
Amazon.Com Inc (AMZN) daily
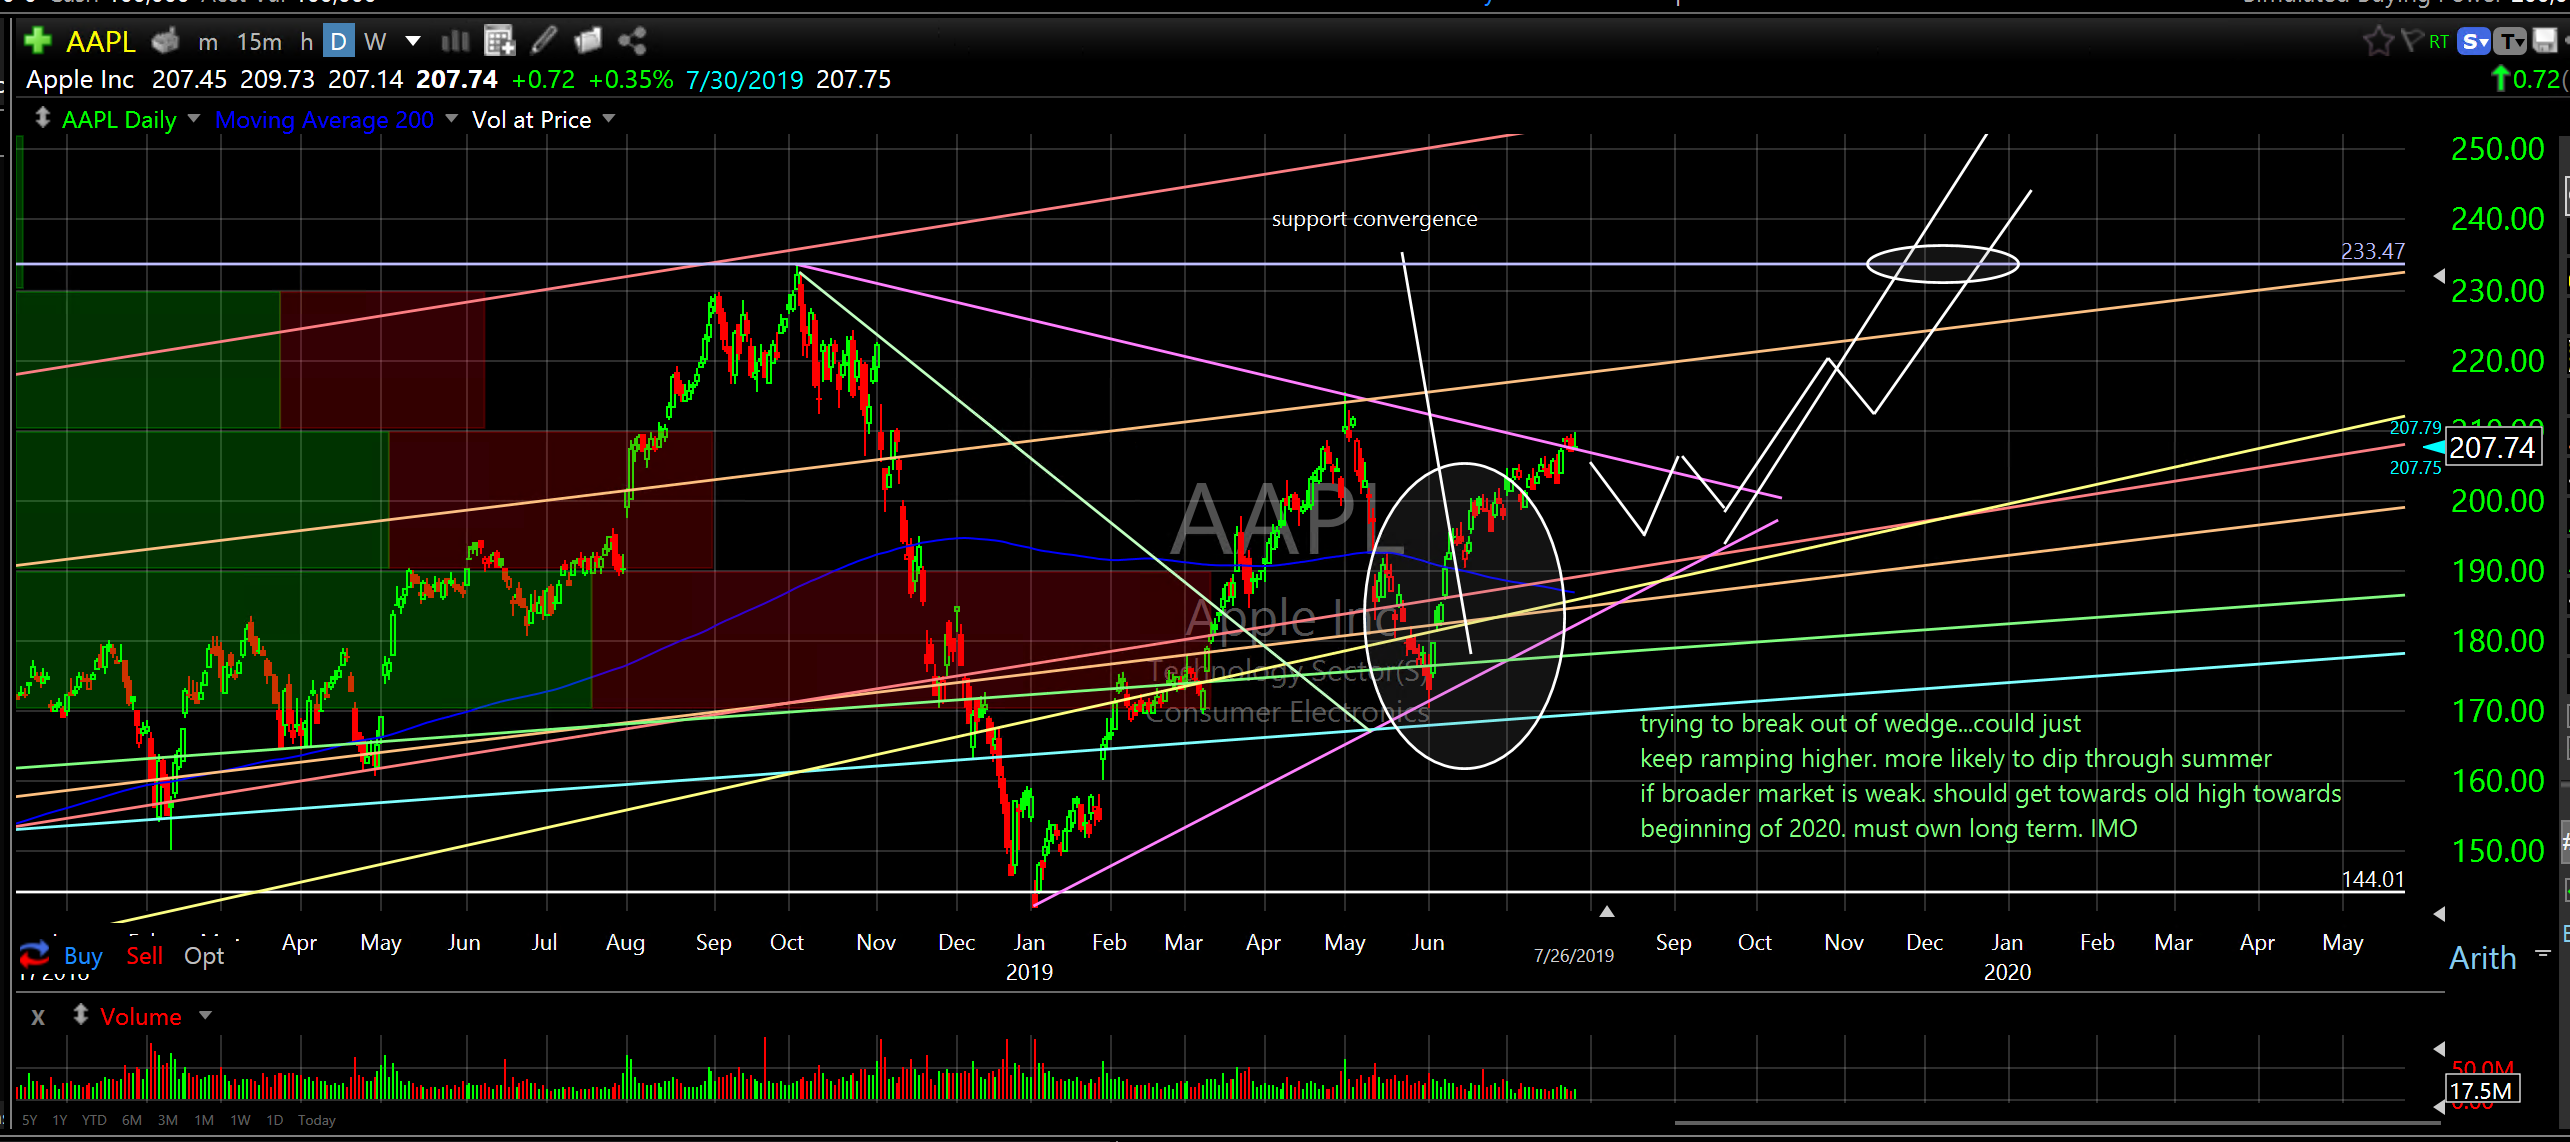
Apple Inc (AAPL) daily
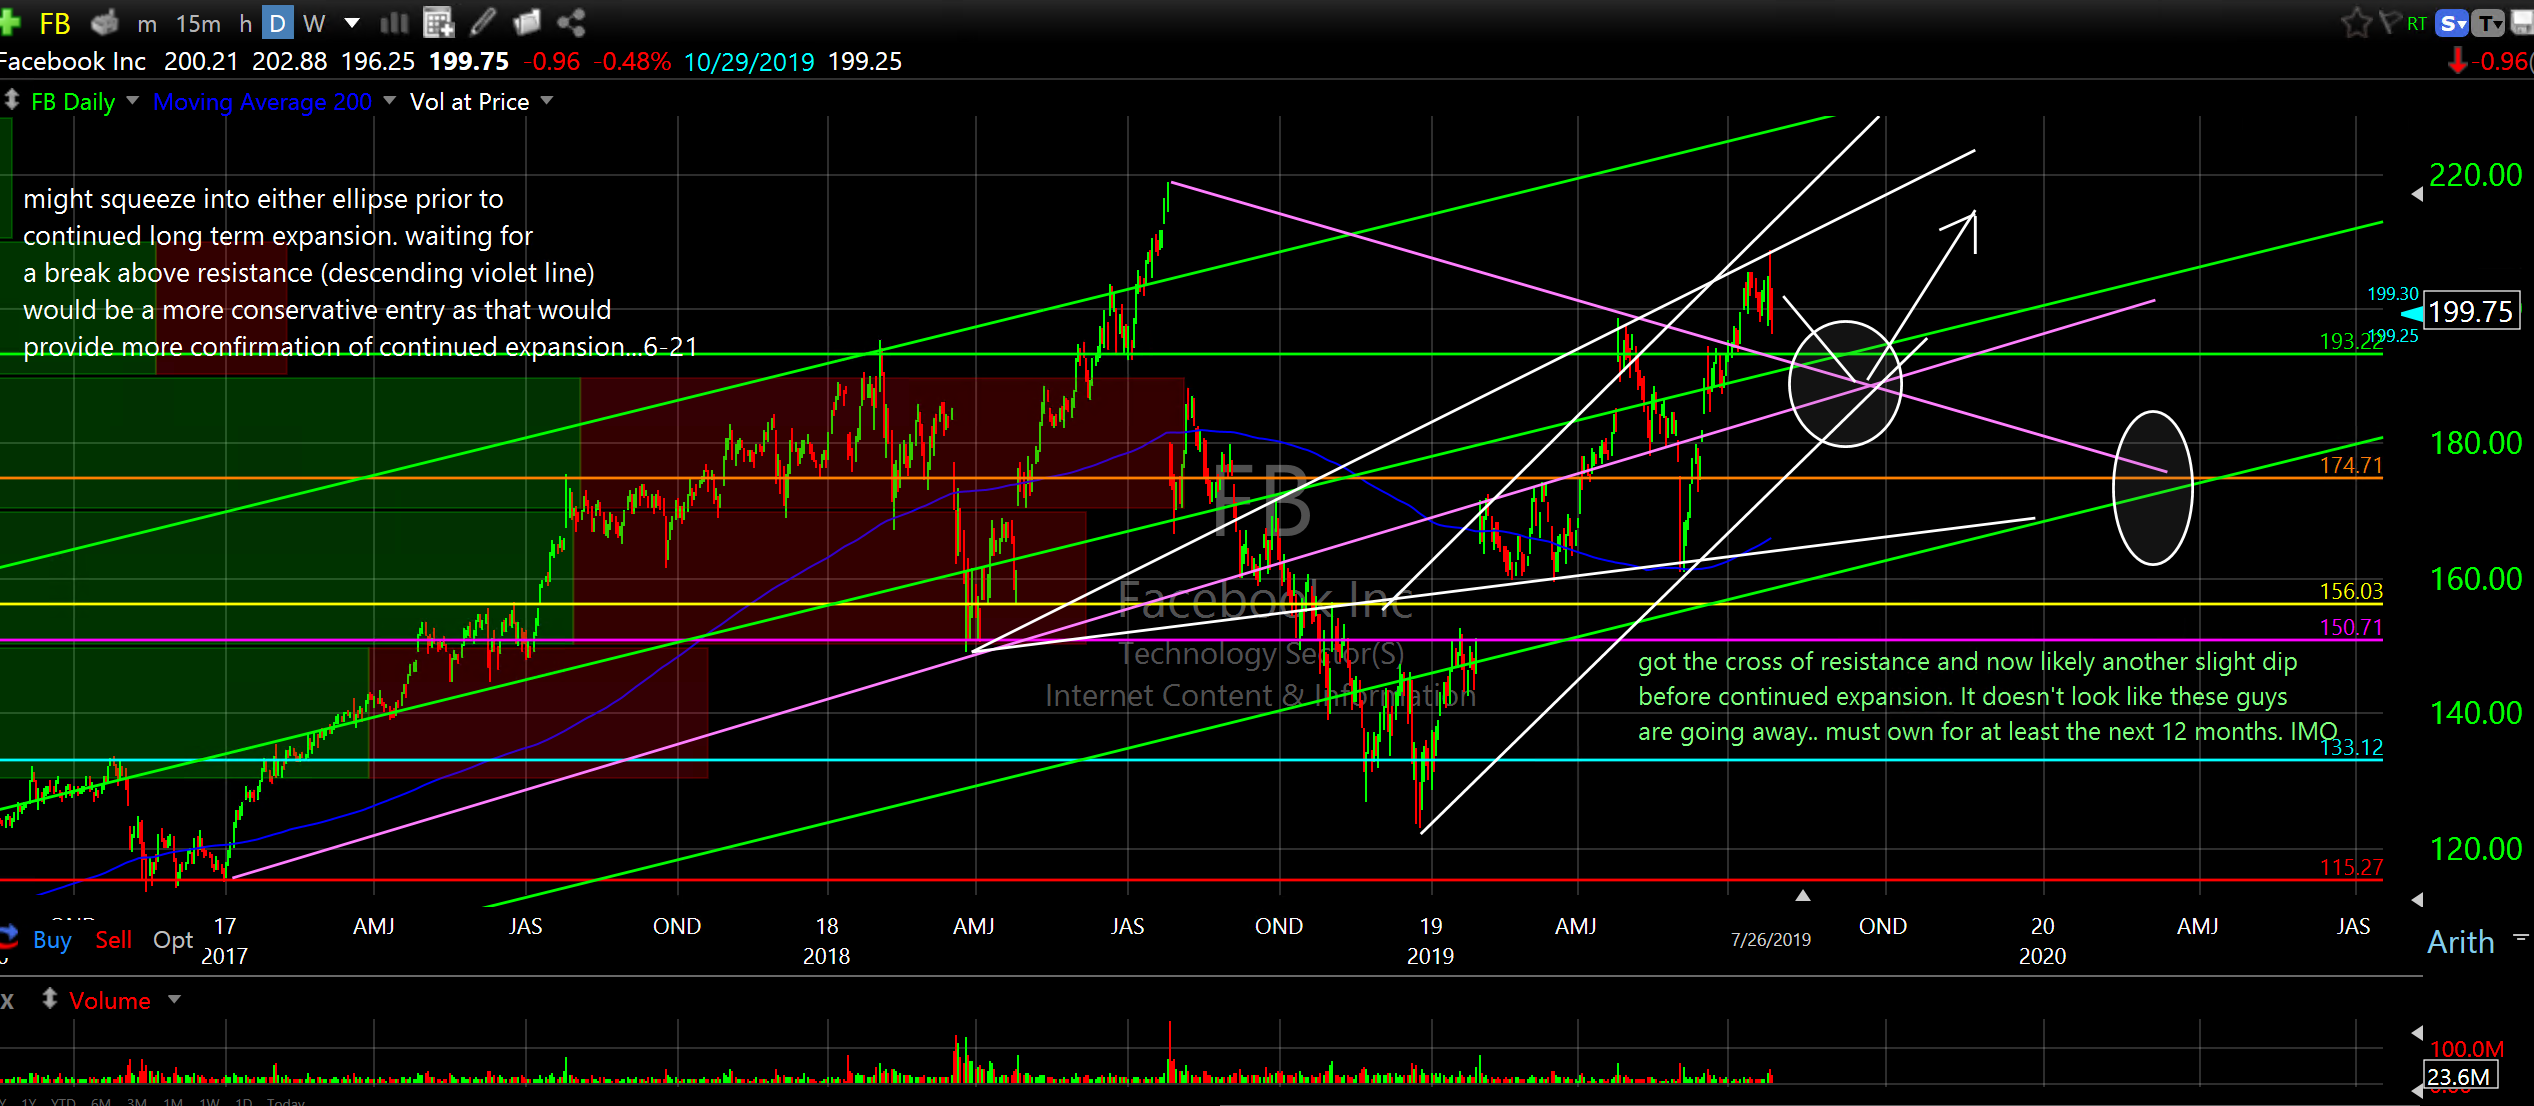
Facebook Inc (FB) daily
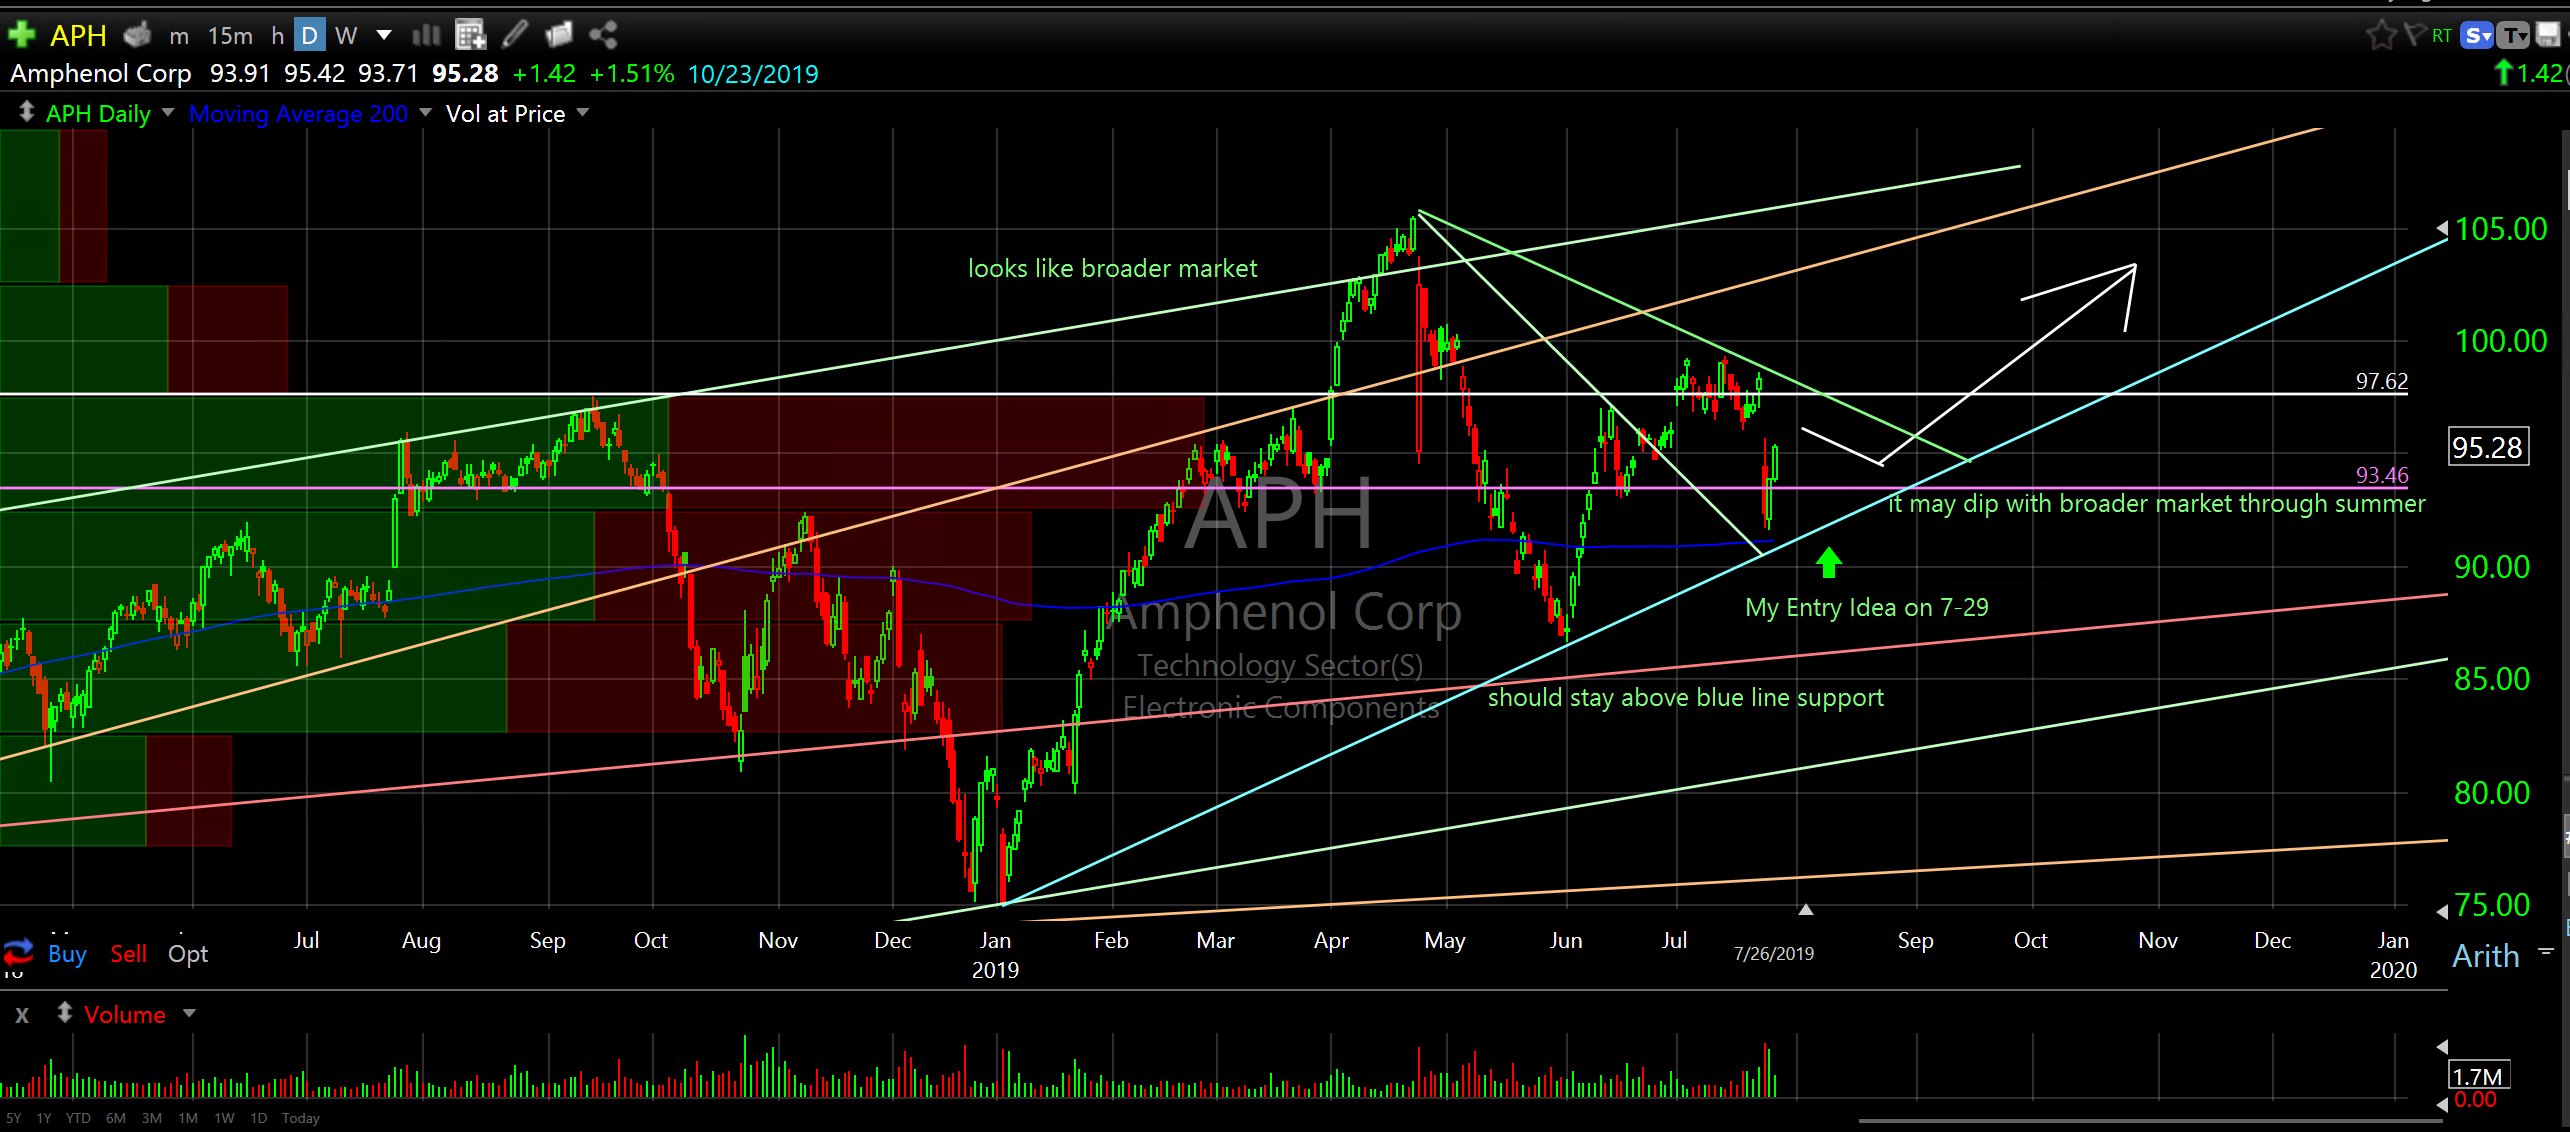
Aphenol Corp (APH) daily
As usual, I’m happy to answer any questions. Please do your own due diligence. These are just my opinions/methodology for finding what I consider lower risk entries and timely exits. My charting helps me. I hope it helps you.
Stay cool out there,
Don