I’m attending a workshop in beautiful La Jolla this weekend hosted by TC2000, the charting platform I use. I’m here to learn more about the new features and functions offered in Version 19. Thank goodness the coffee is hot because it’s absolutely freezing in this conference room. By the way, I highly recommend TC2000. And yes, I’m writing during the workshop while I listen for usable information.
This weeks update will be slightly abbreviated (maybe) due to the Saturday and Sunday workshop and my travel schedule.
Broader Market Review
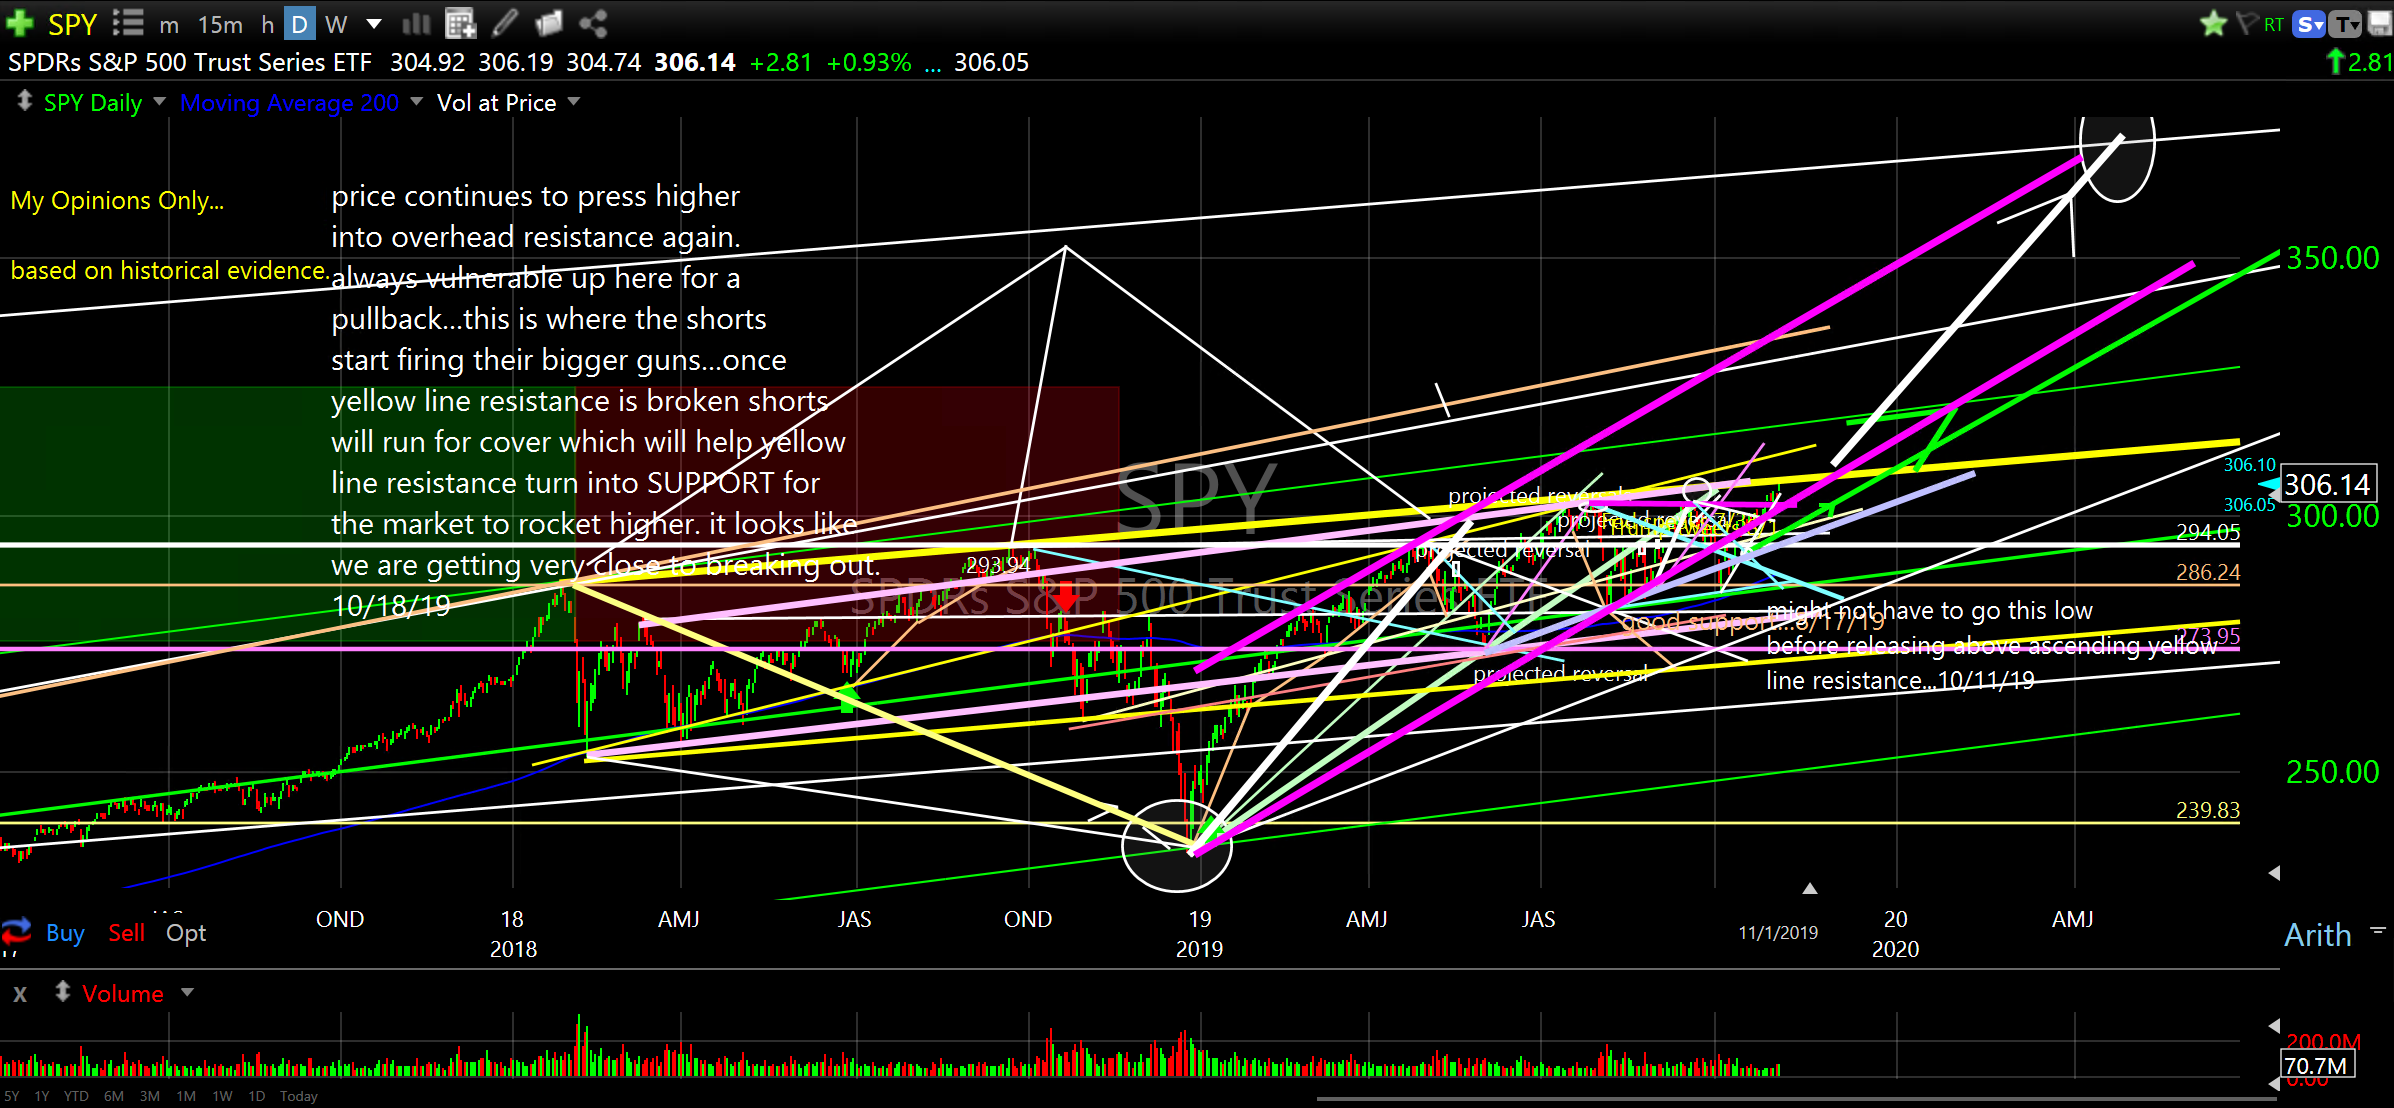
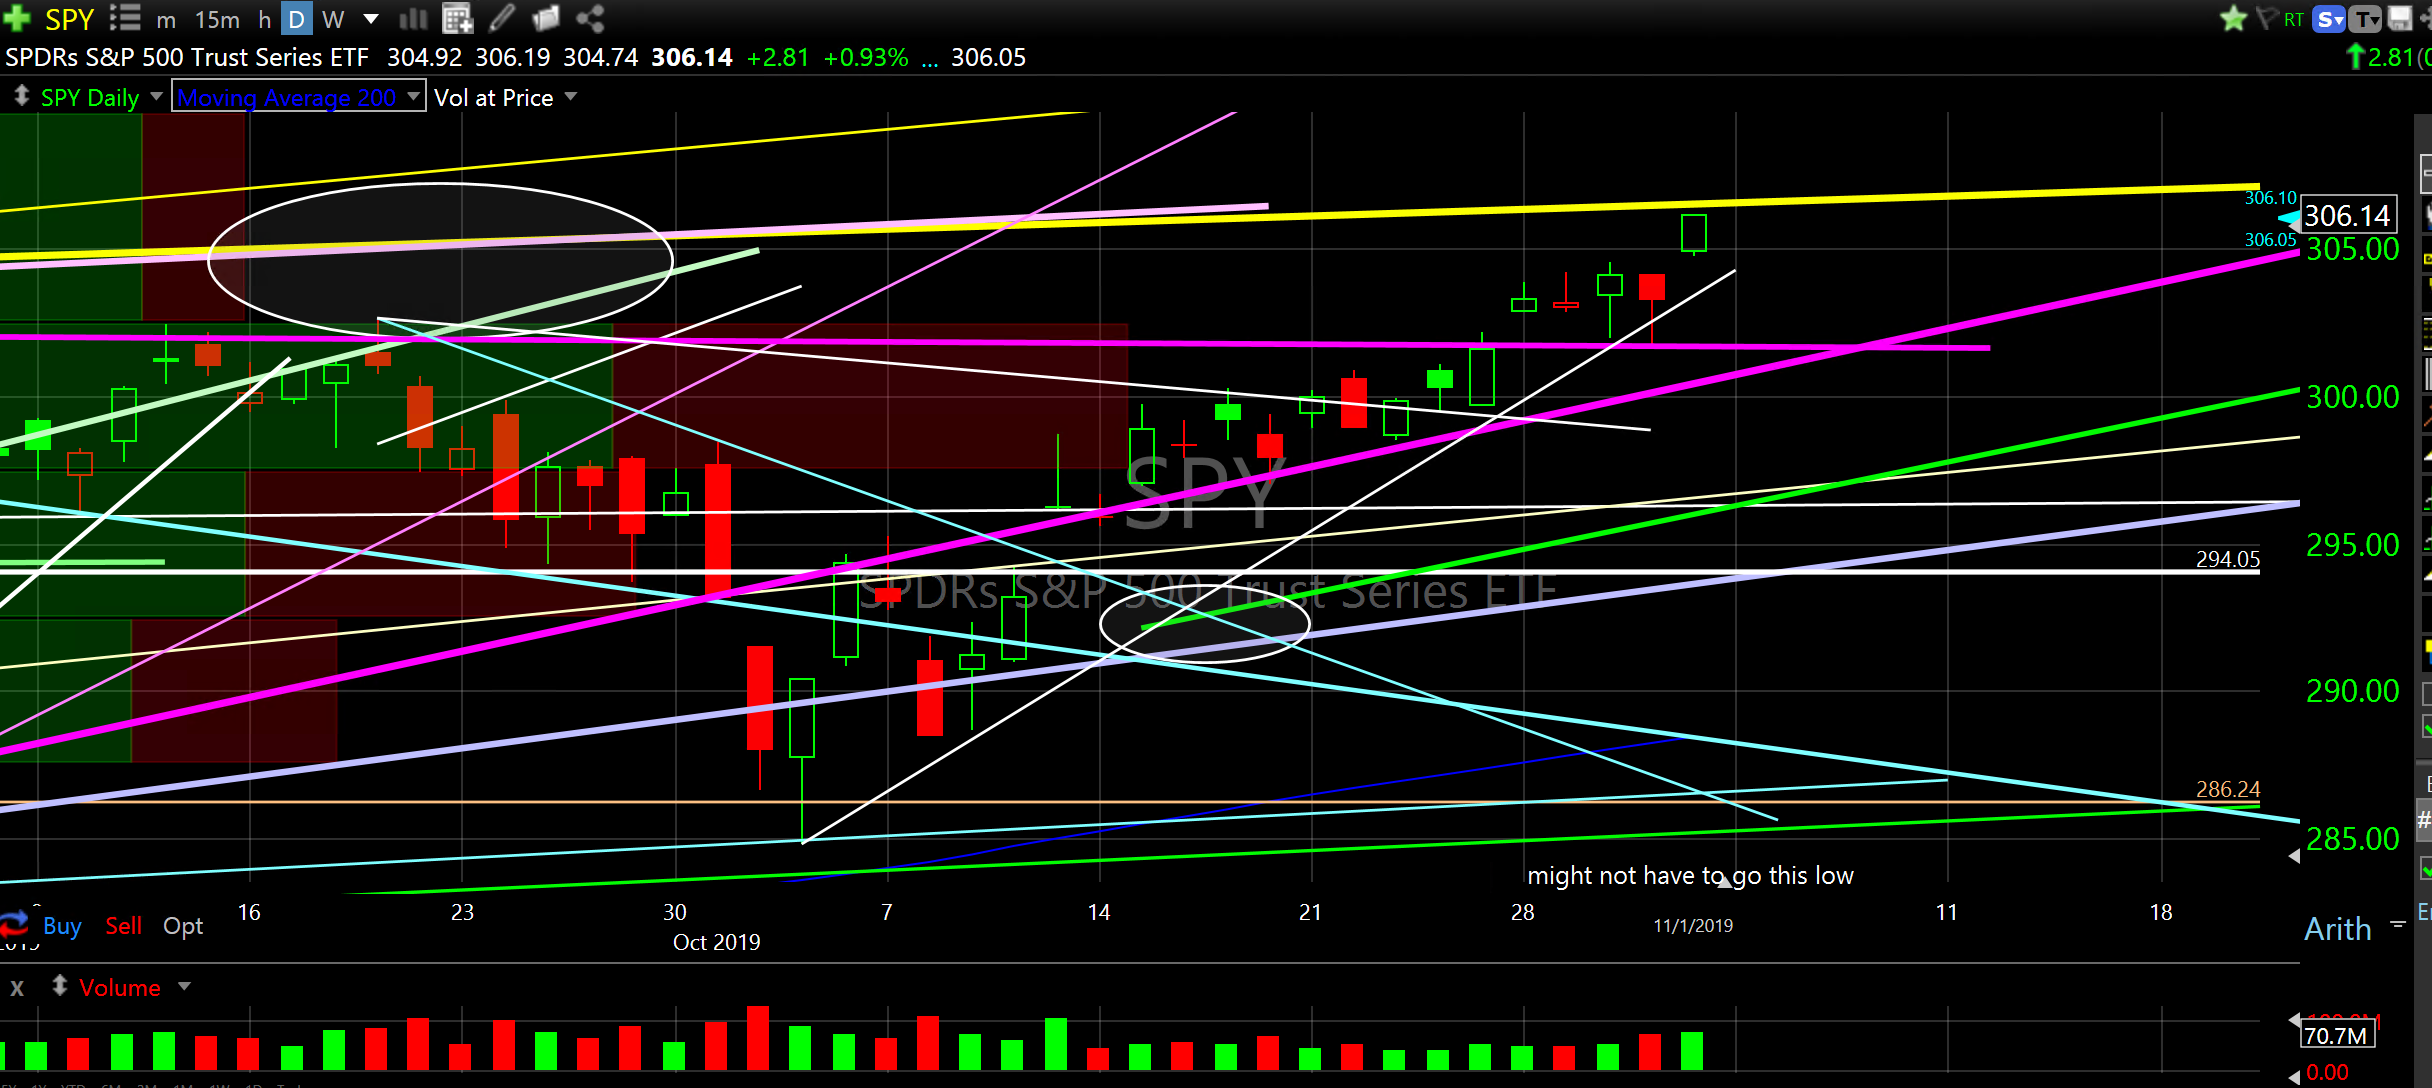
The S&P 500 traded up almost 1% on Friday to just underneath ascending yellow line resistance…THE MOST IMPORTANT RESISTANCE ZONE (currently) and the one I have been describing, writing about and showing for months and months. Do you see how it closed right underneath this level? Look at the “close up” SPY chart to see it from a more granular level. Once crossed this will become SUPPORT and price is likely to chop and re-test this ascending price level before ripping higher into and through most of 2020 and say SEE YA LATER yellow line ceiling we have had to deal with for the past two years. Good riddance you little yellow line price suppressor, good riddance. Make way for SPY to remain aligned within the current expansion channel that is likely to conclude near 400 in late 2020.
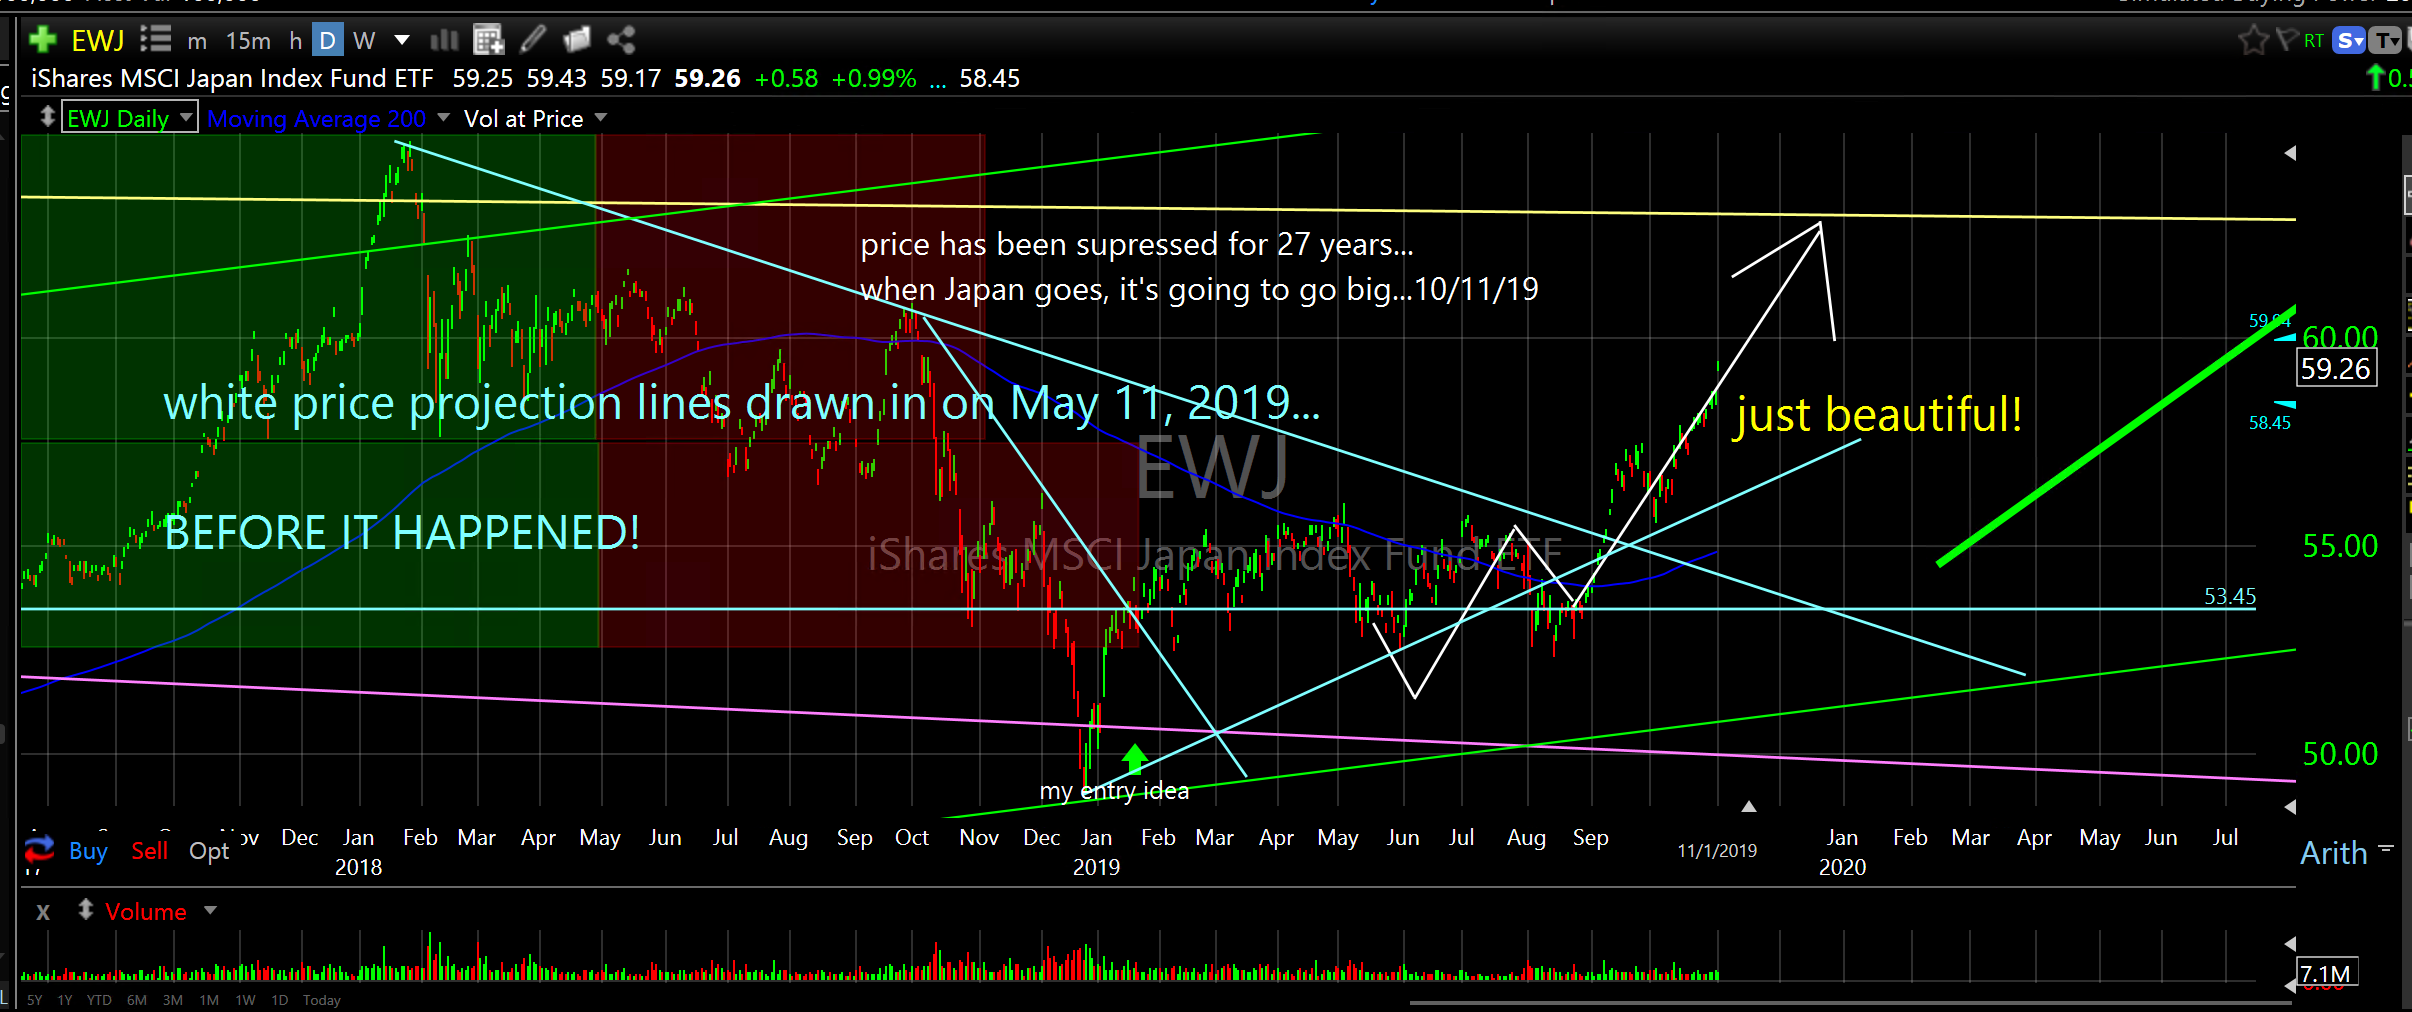
I expect all broader market indexes to follow suit…DIA, QQQ, IWM. I also expect the following ETF’s to rip higher as well; XLK, XLF, XLY, XLV, XLI, SMH, XTN. Other favorites are; XRT, IGV, KWEB, TECL, TNA, CQQQ, FINU, EWJ. Once the breakout and re-testing occur it will be all systems go. Ladies and gentlemen, start your engines. Vroom! Vroom!
SPDR’s S&P 500 Trust Series ETF (SPY) daily
SPDR’s S&P 500 Trust Series ETF (SPY) daily…close up
Show Me the Money
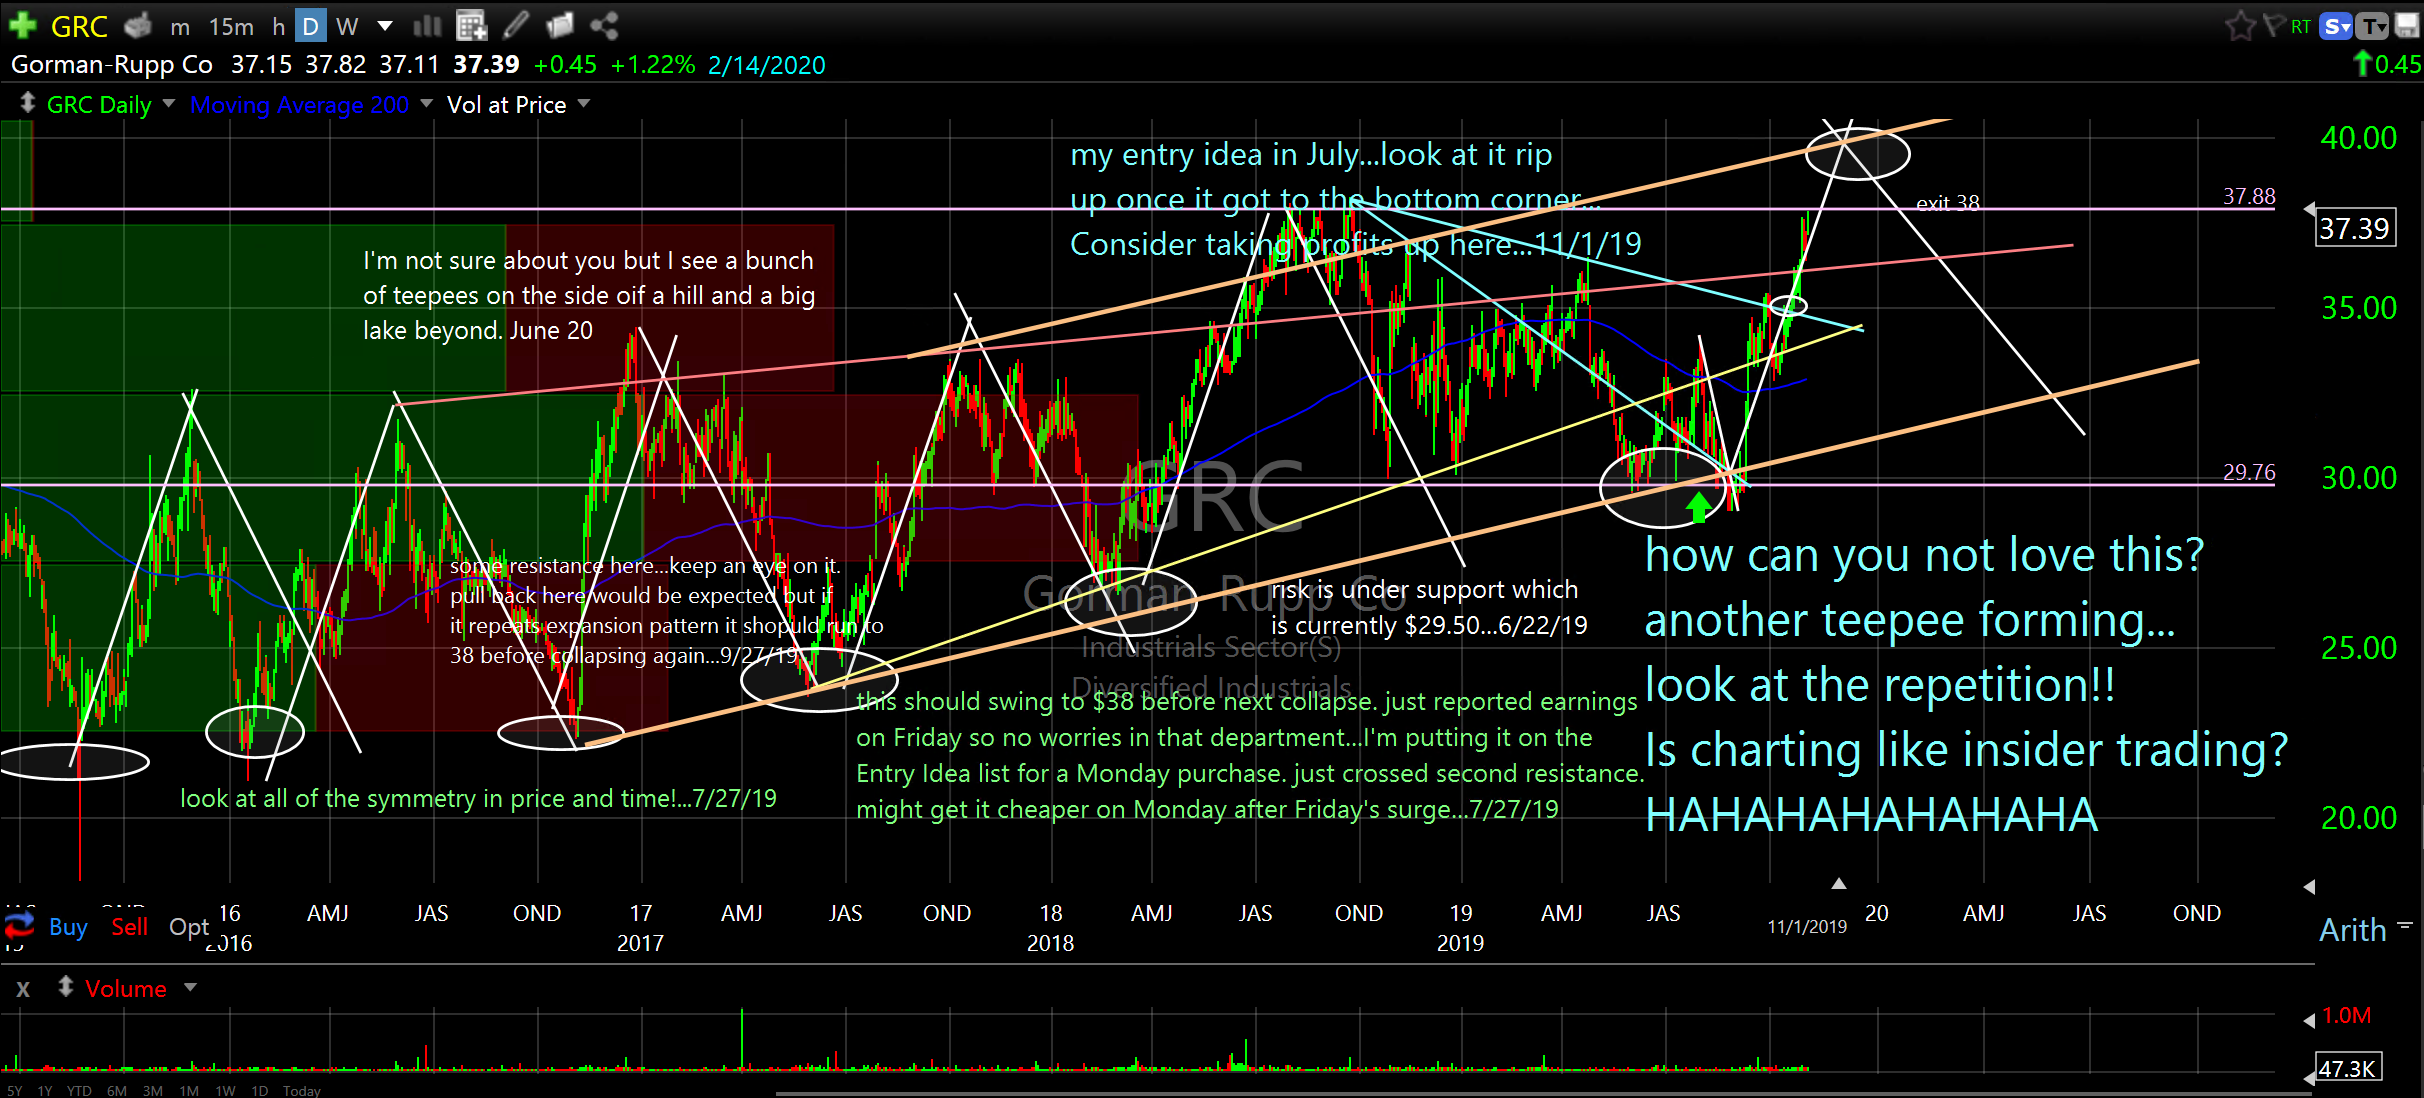
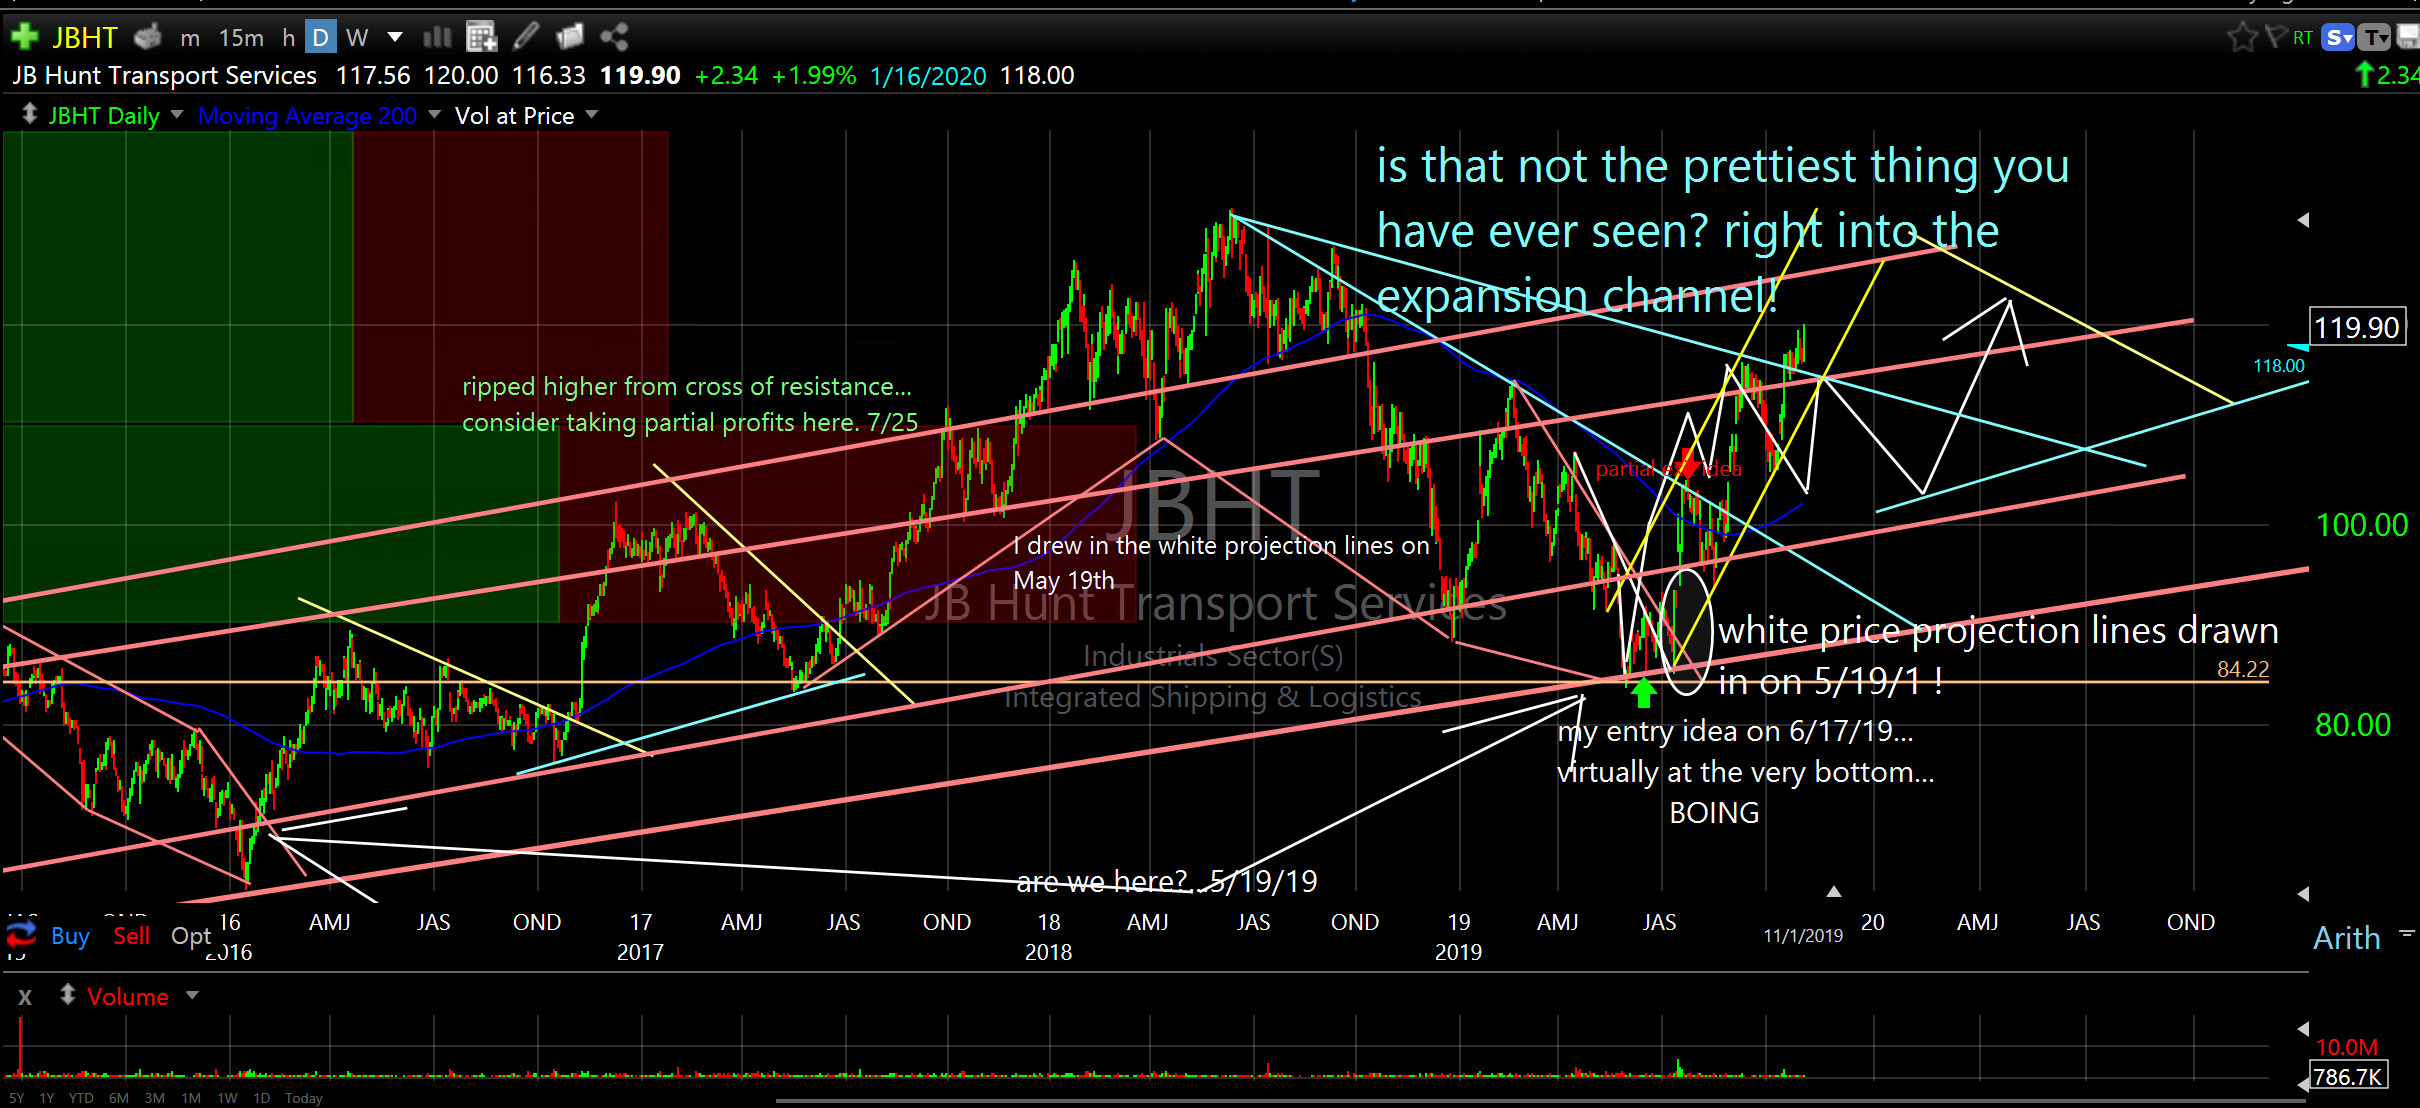
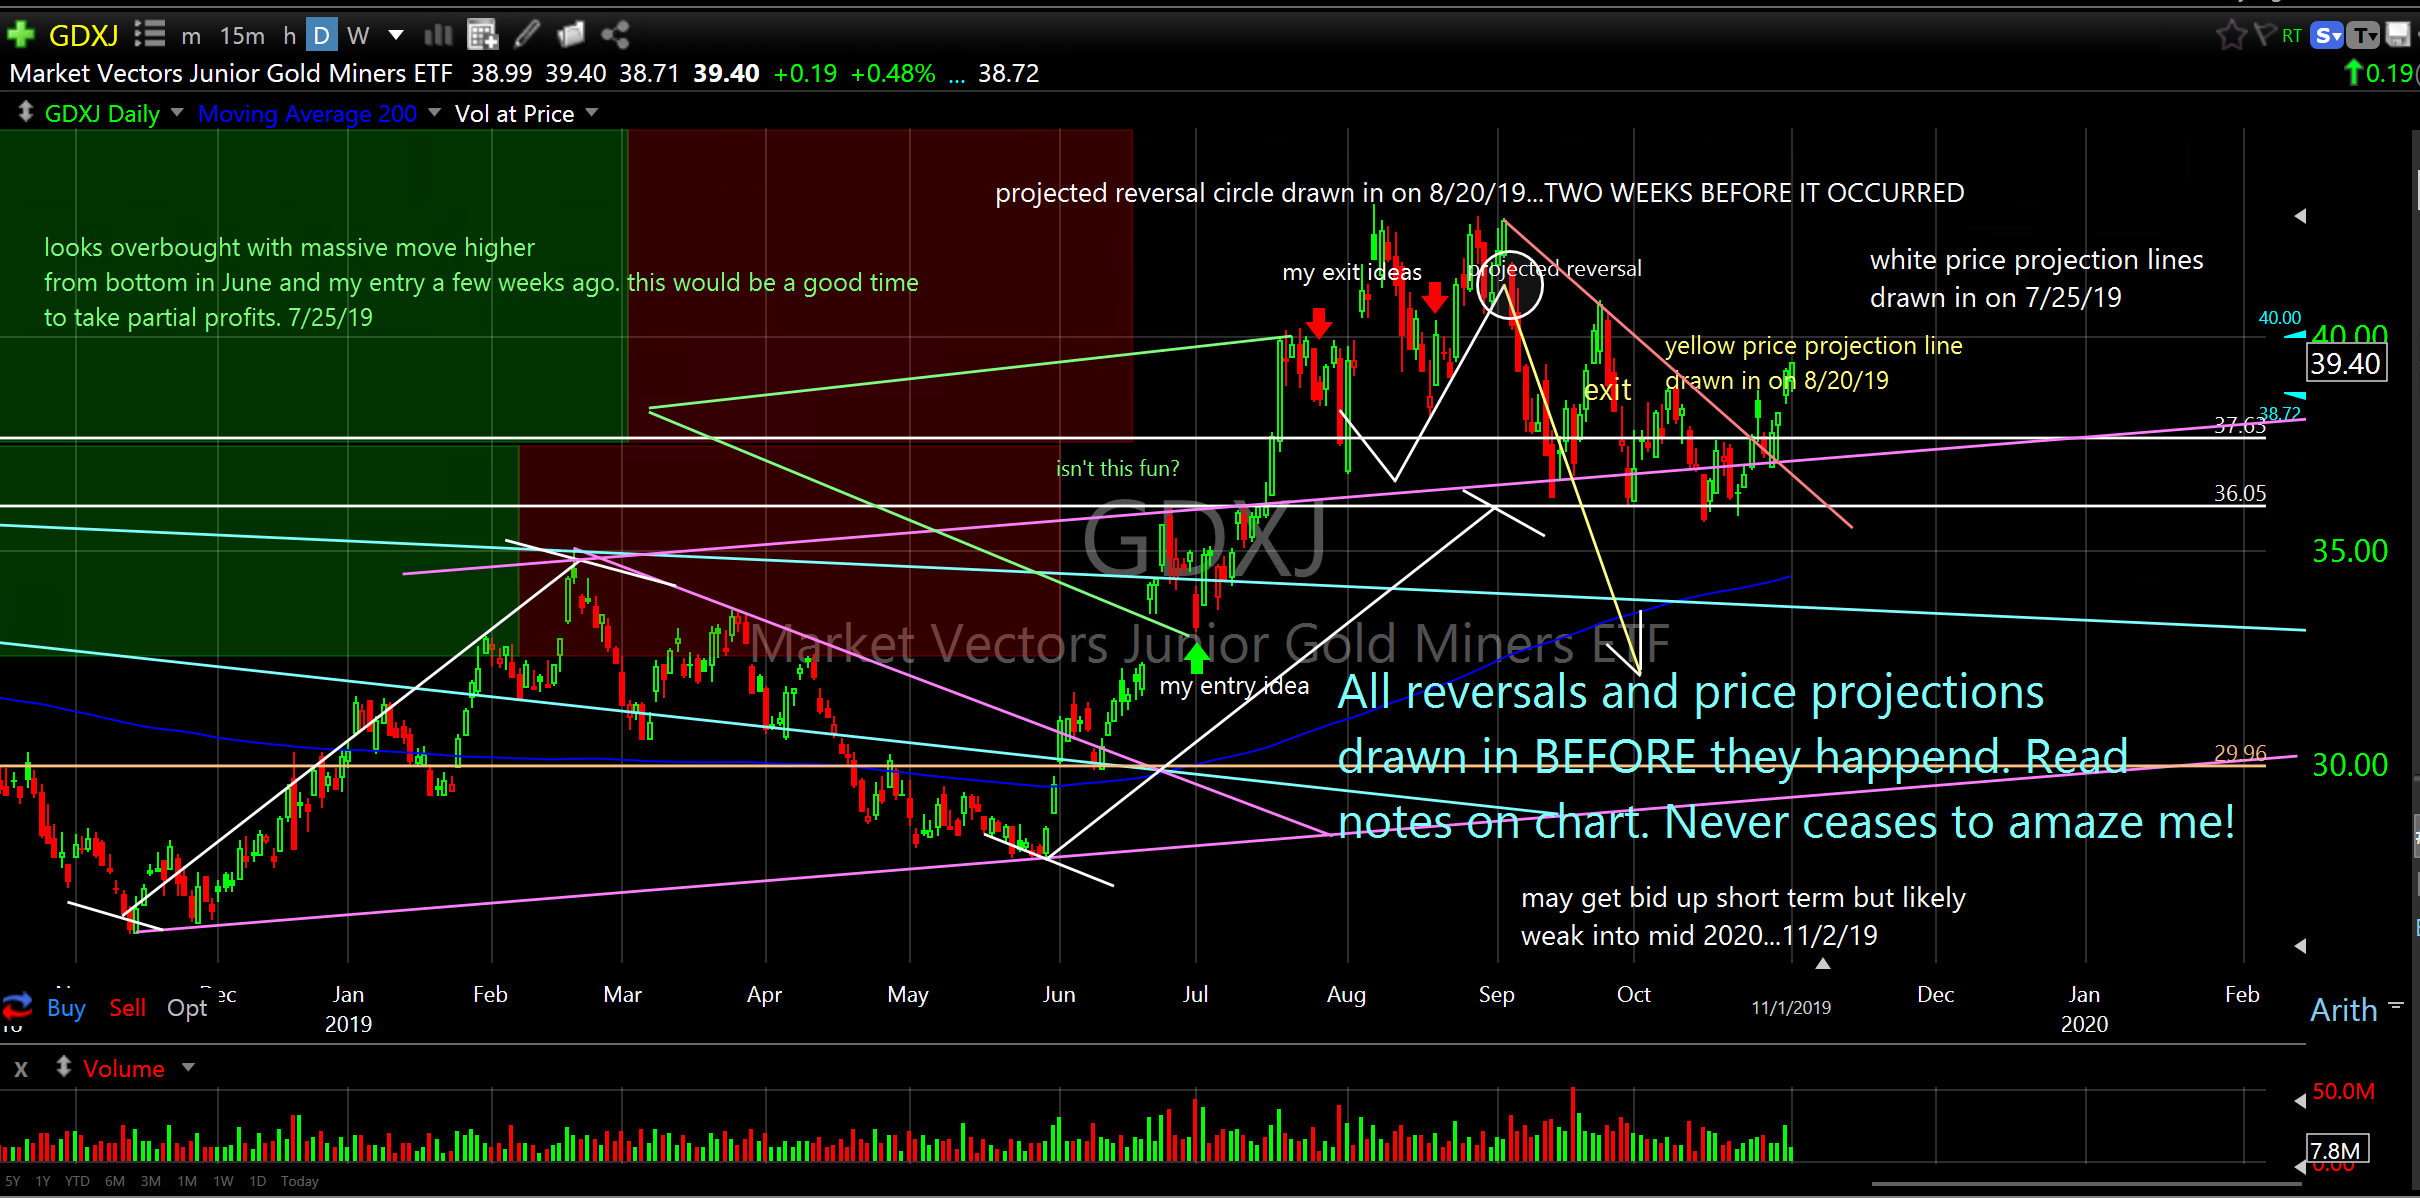
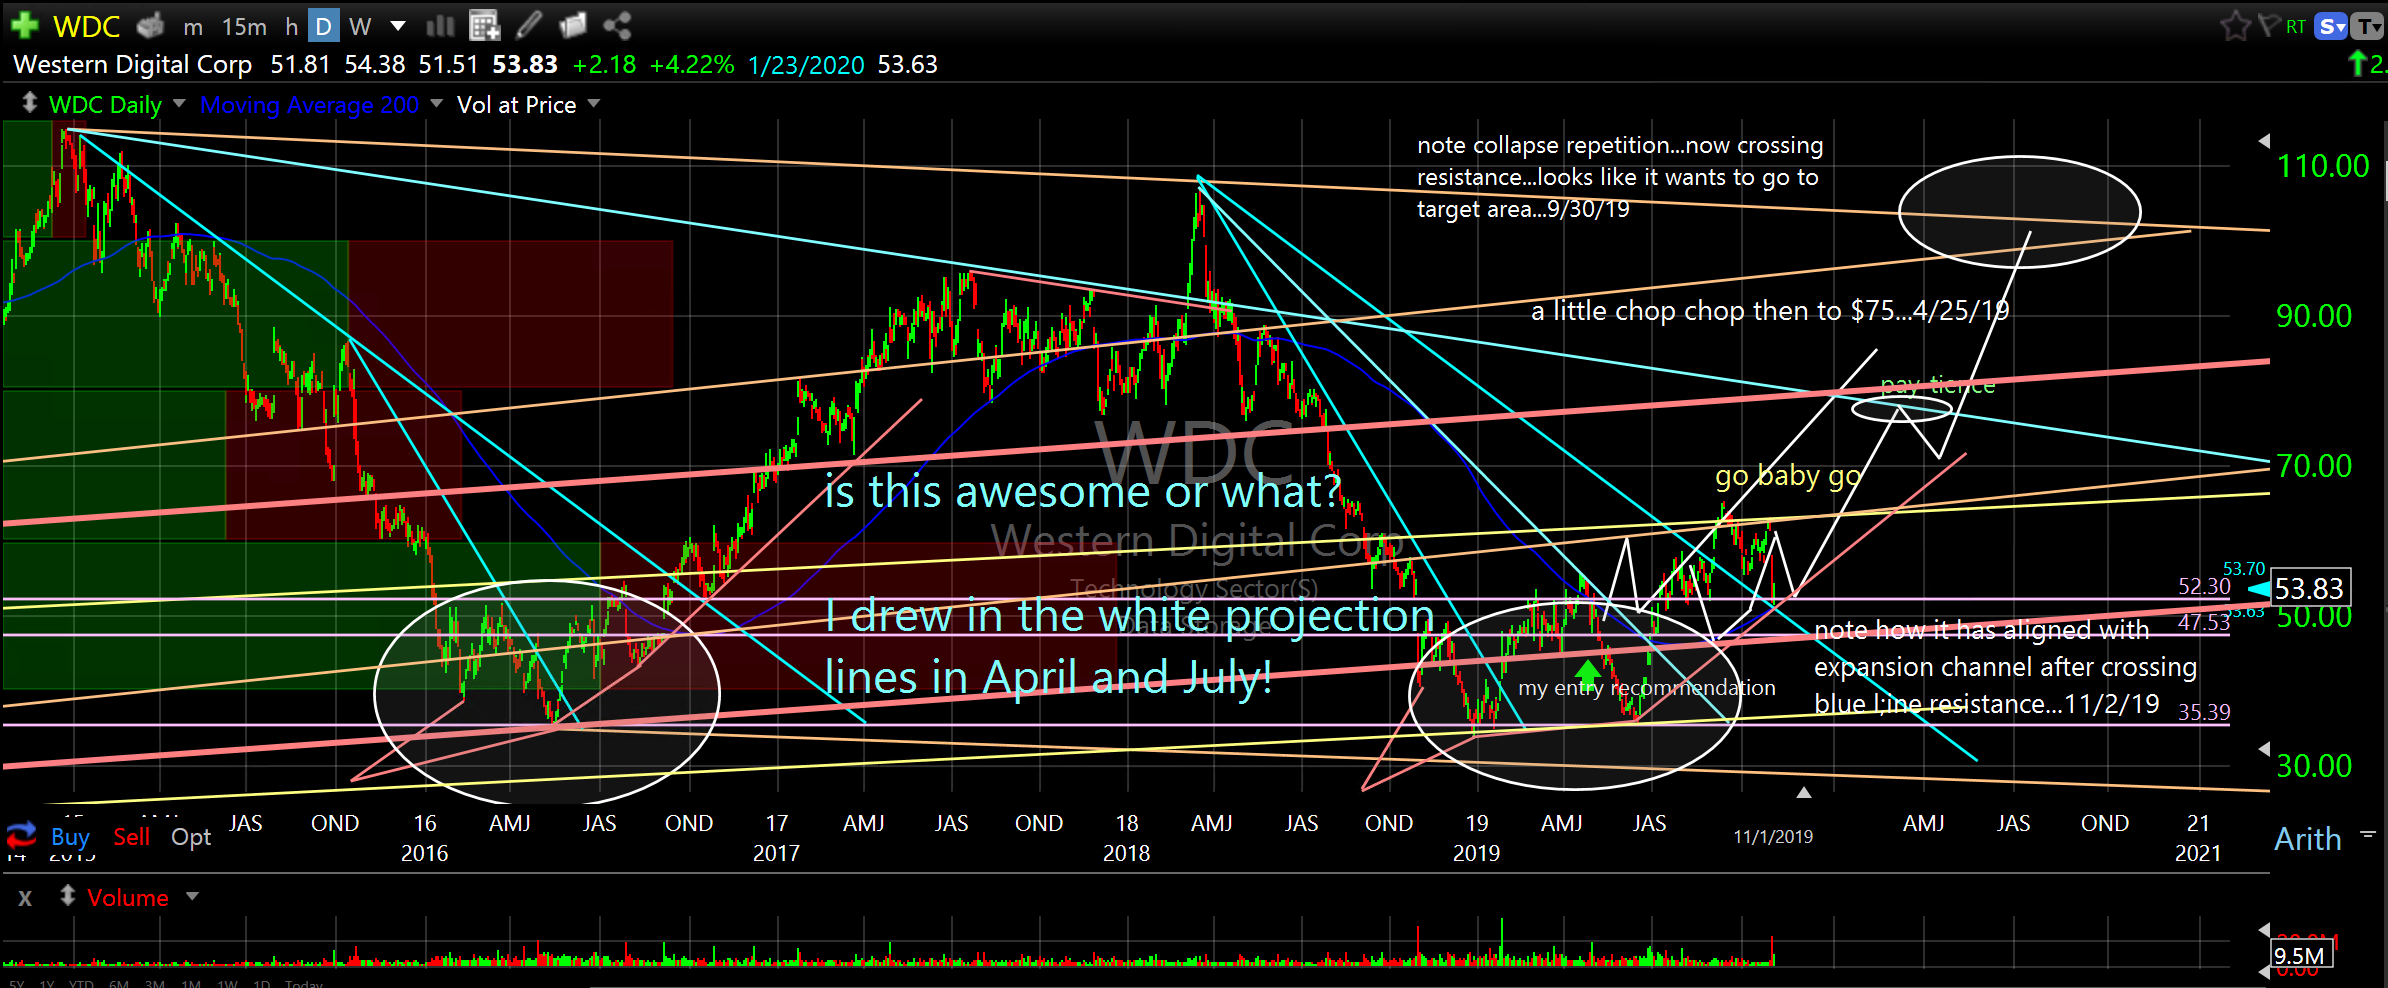
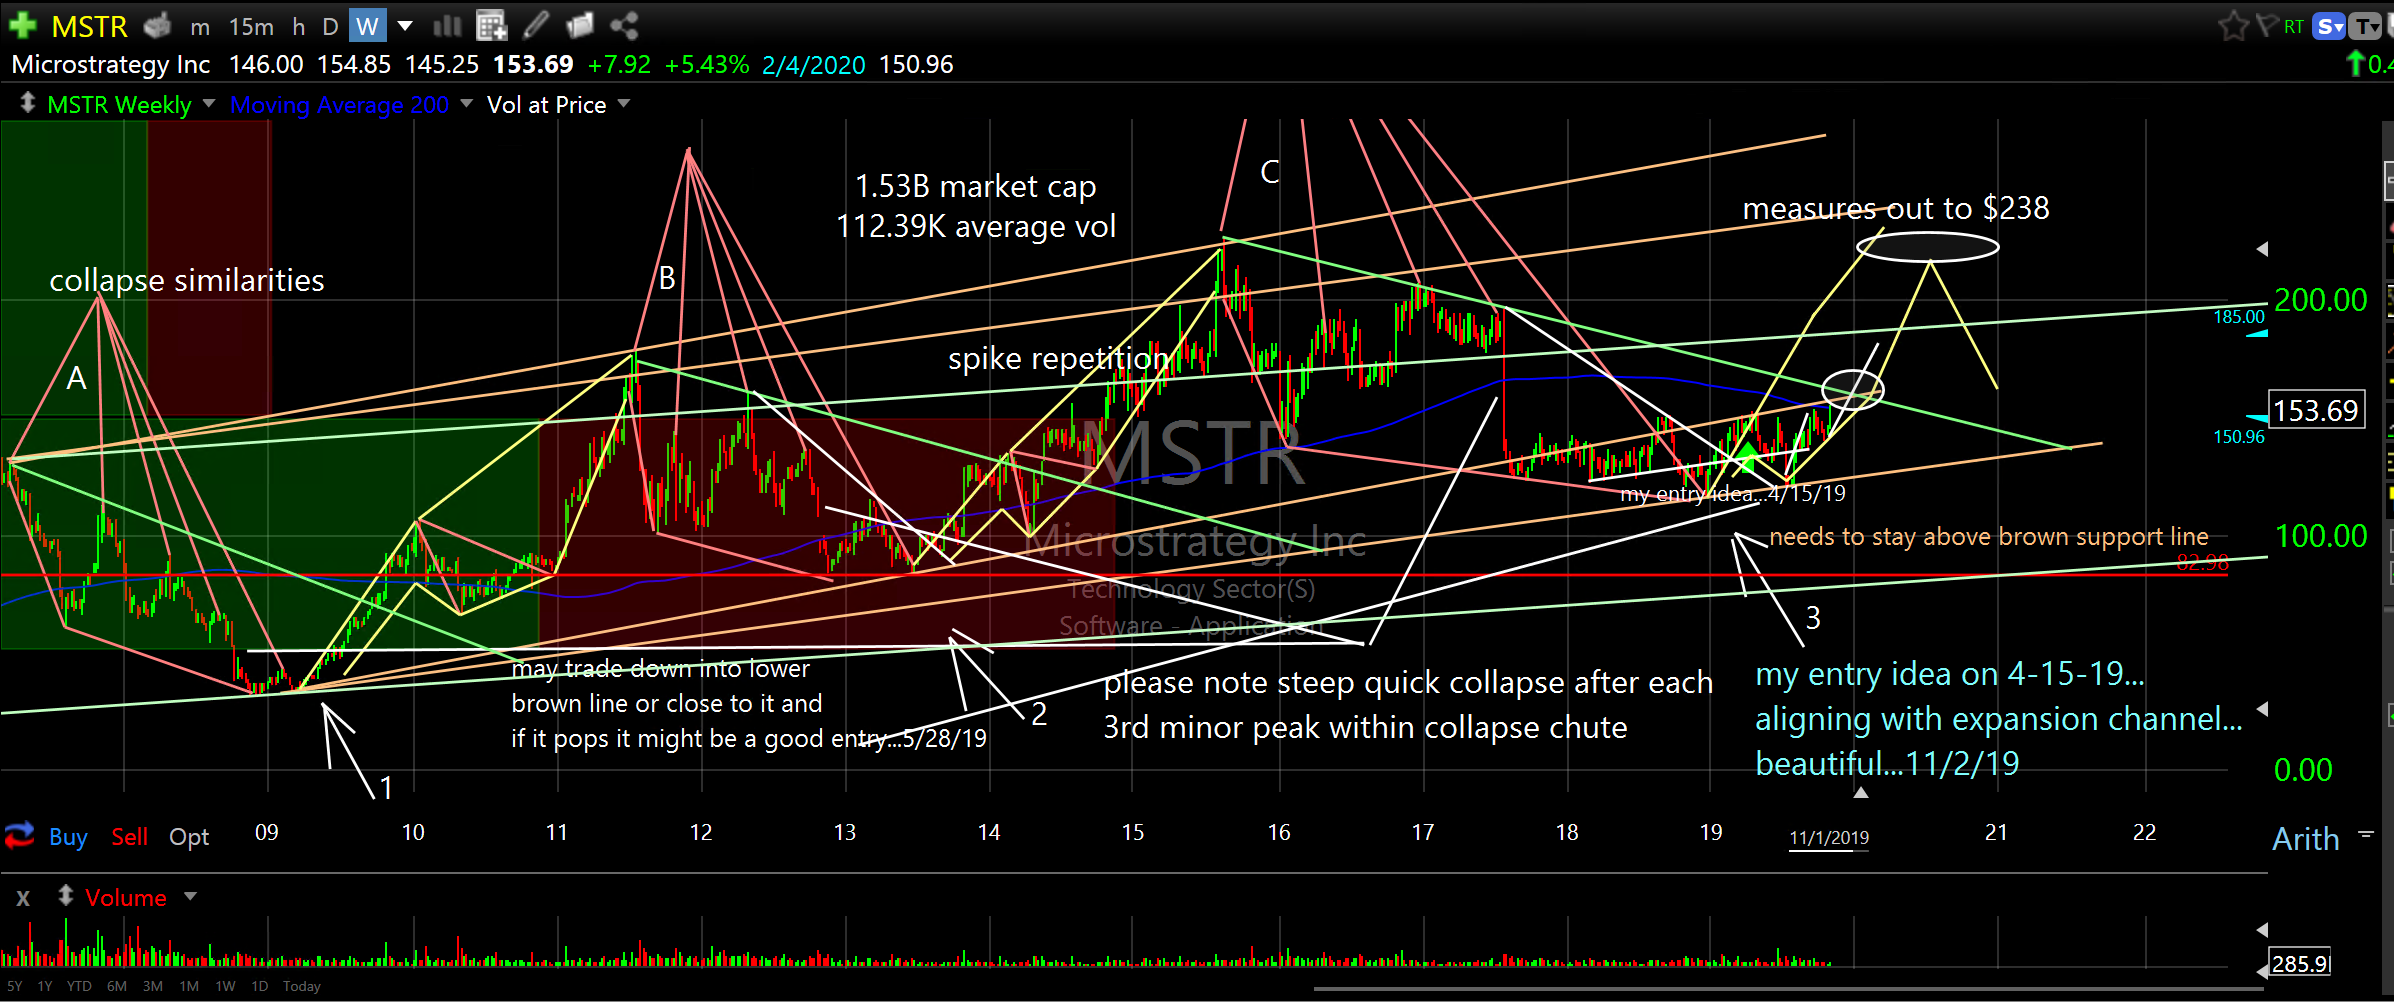
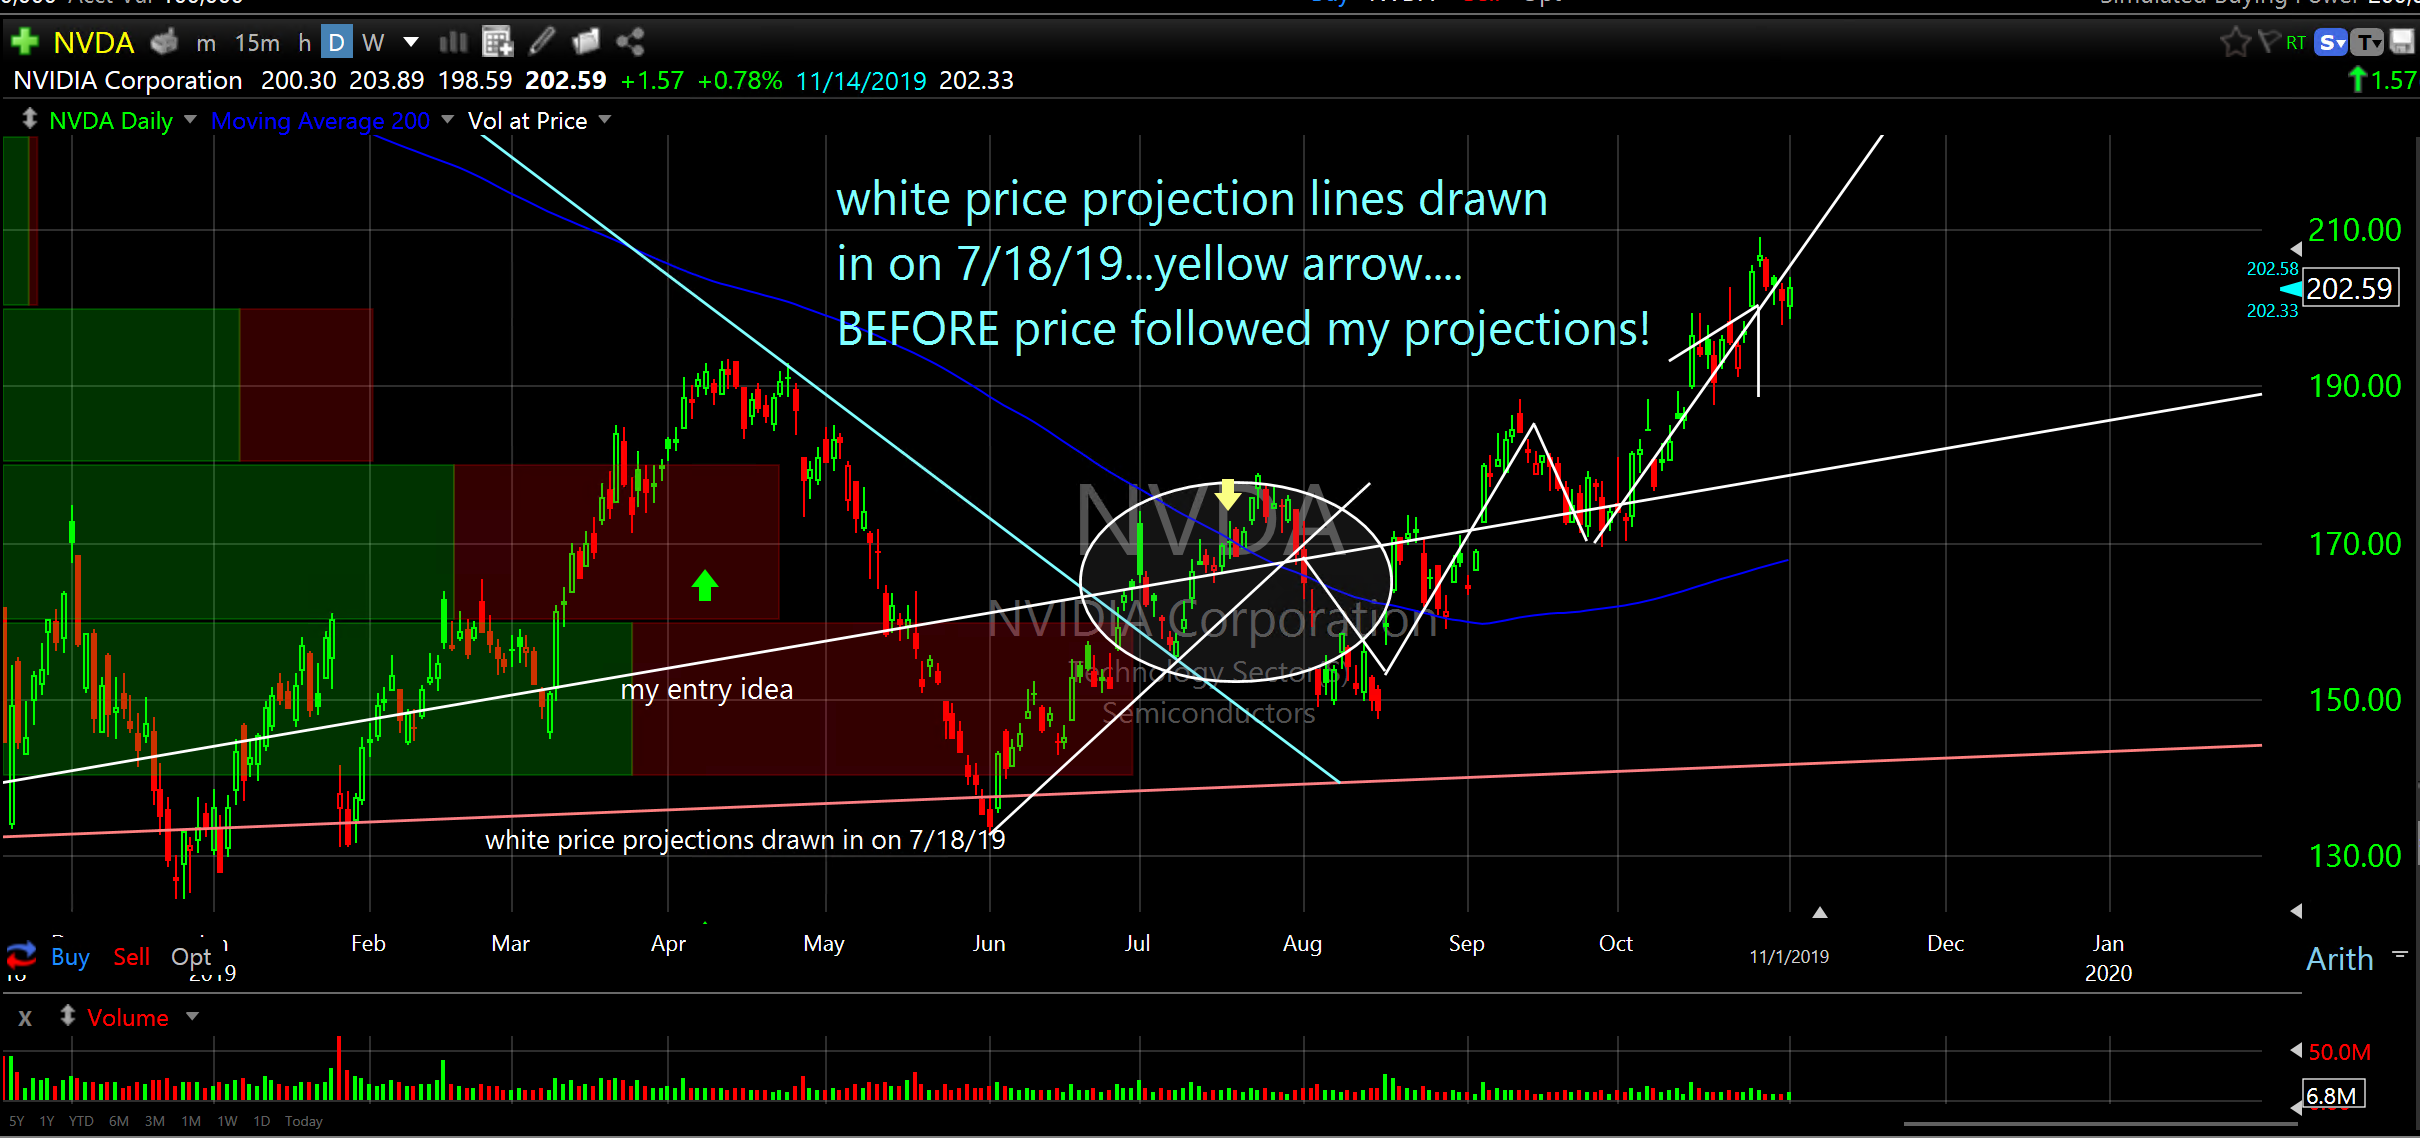
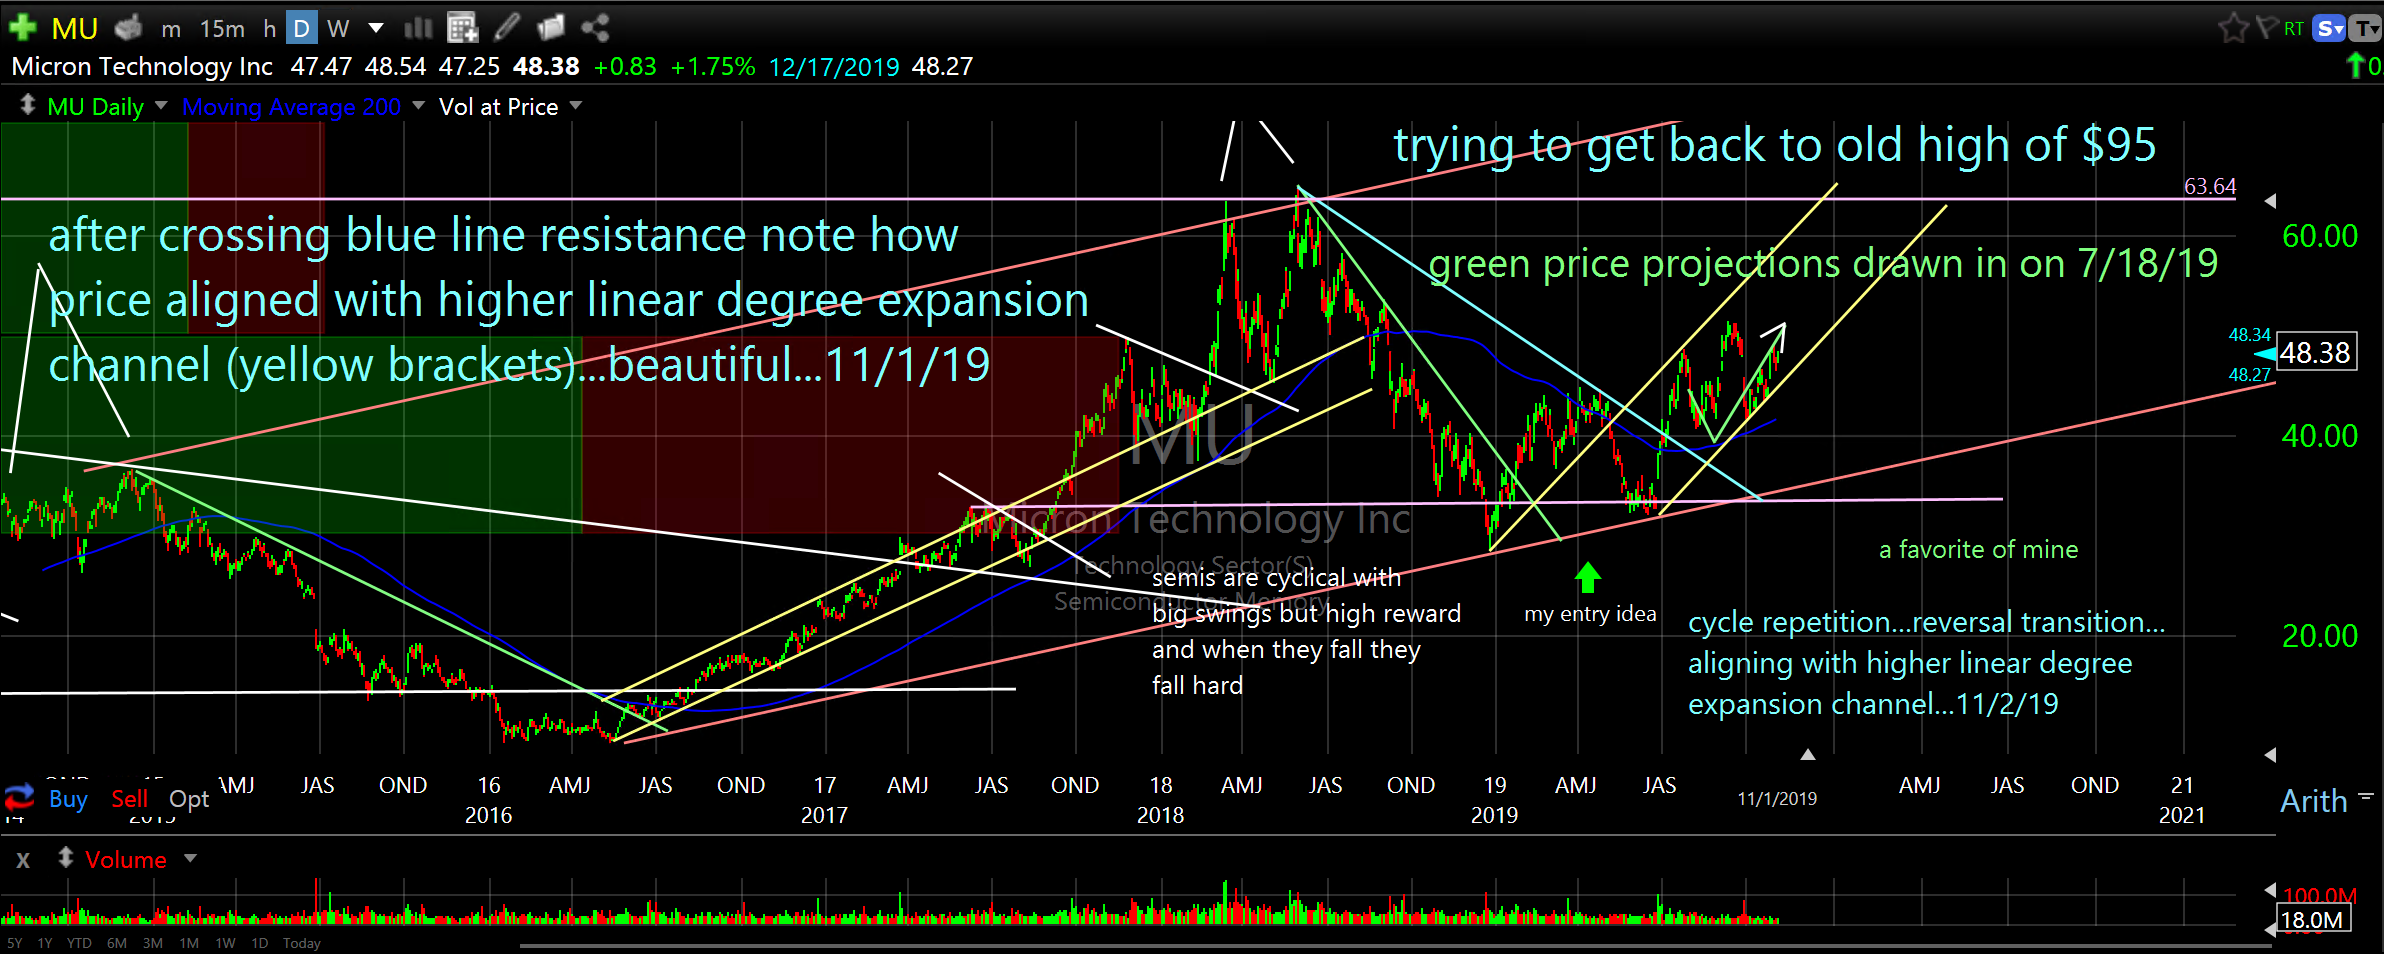
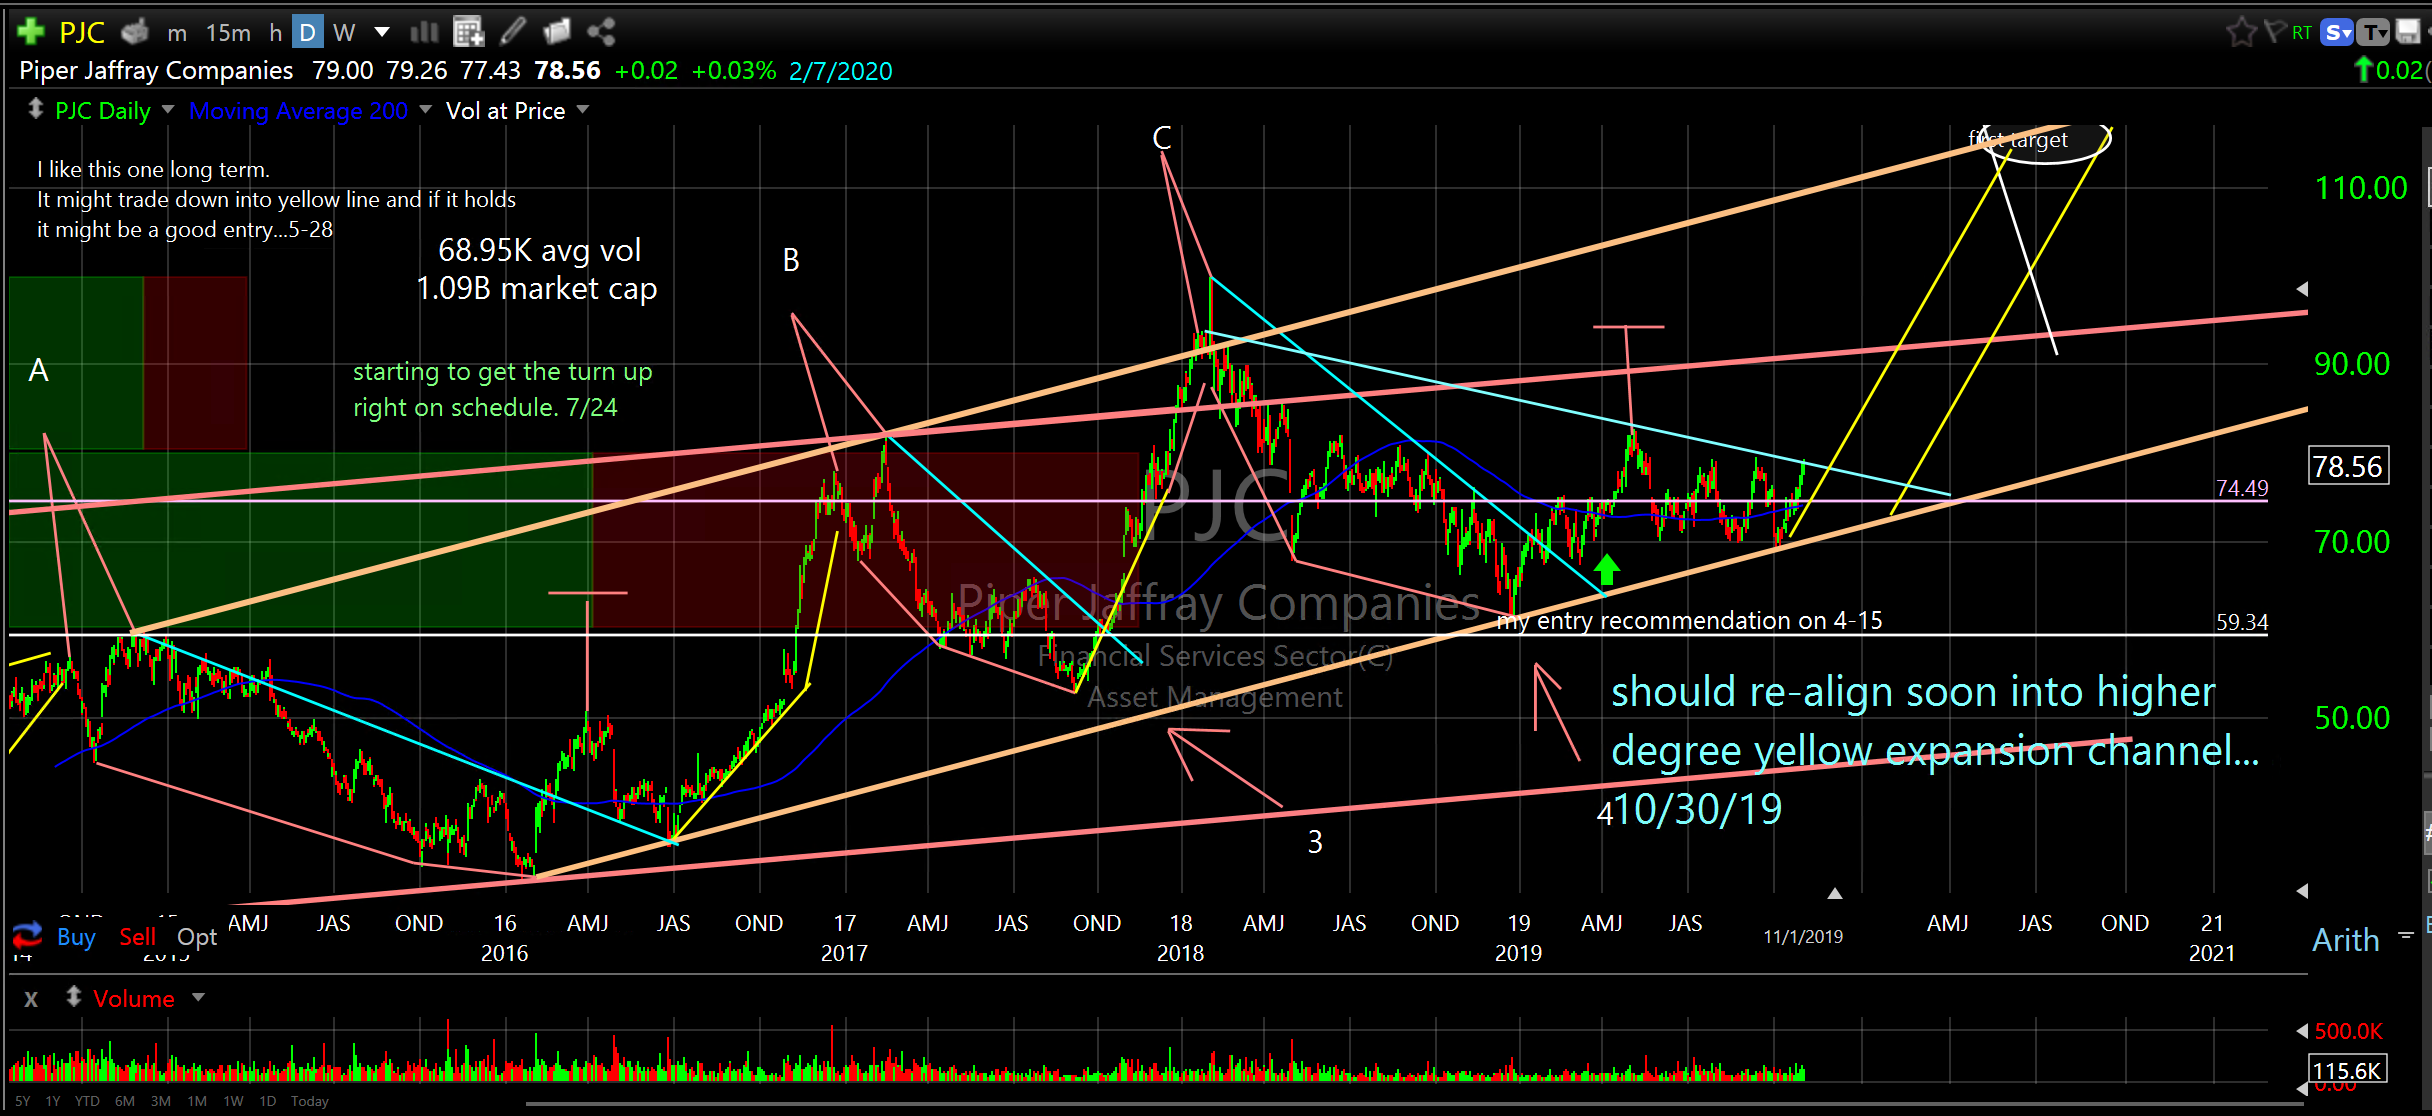
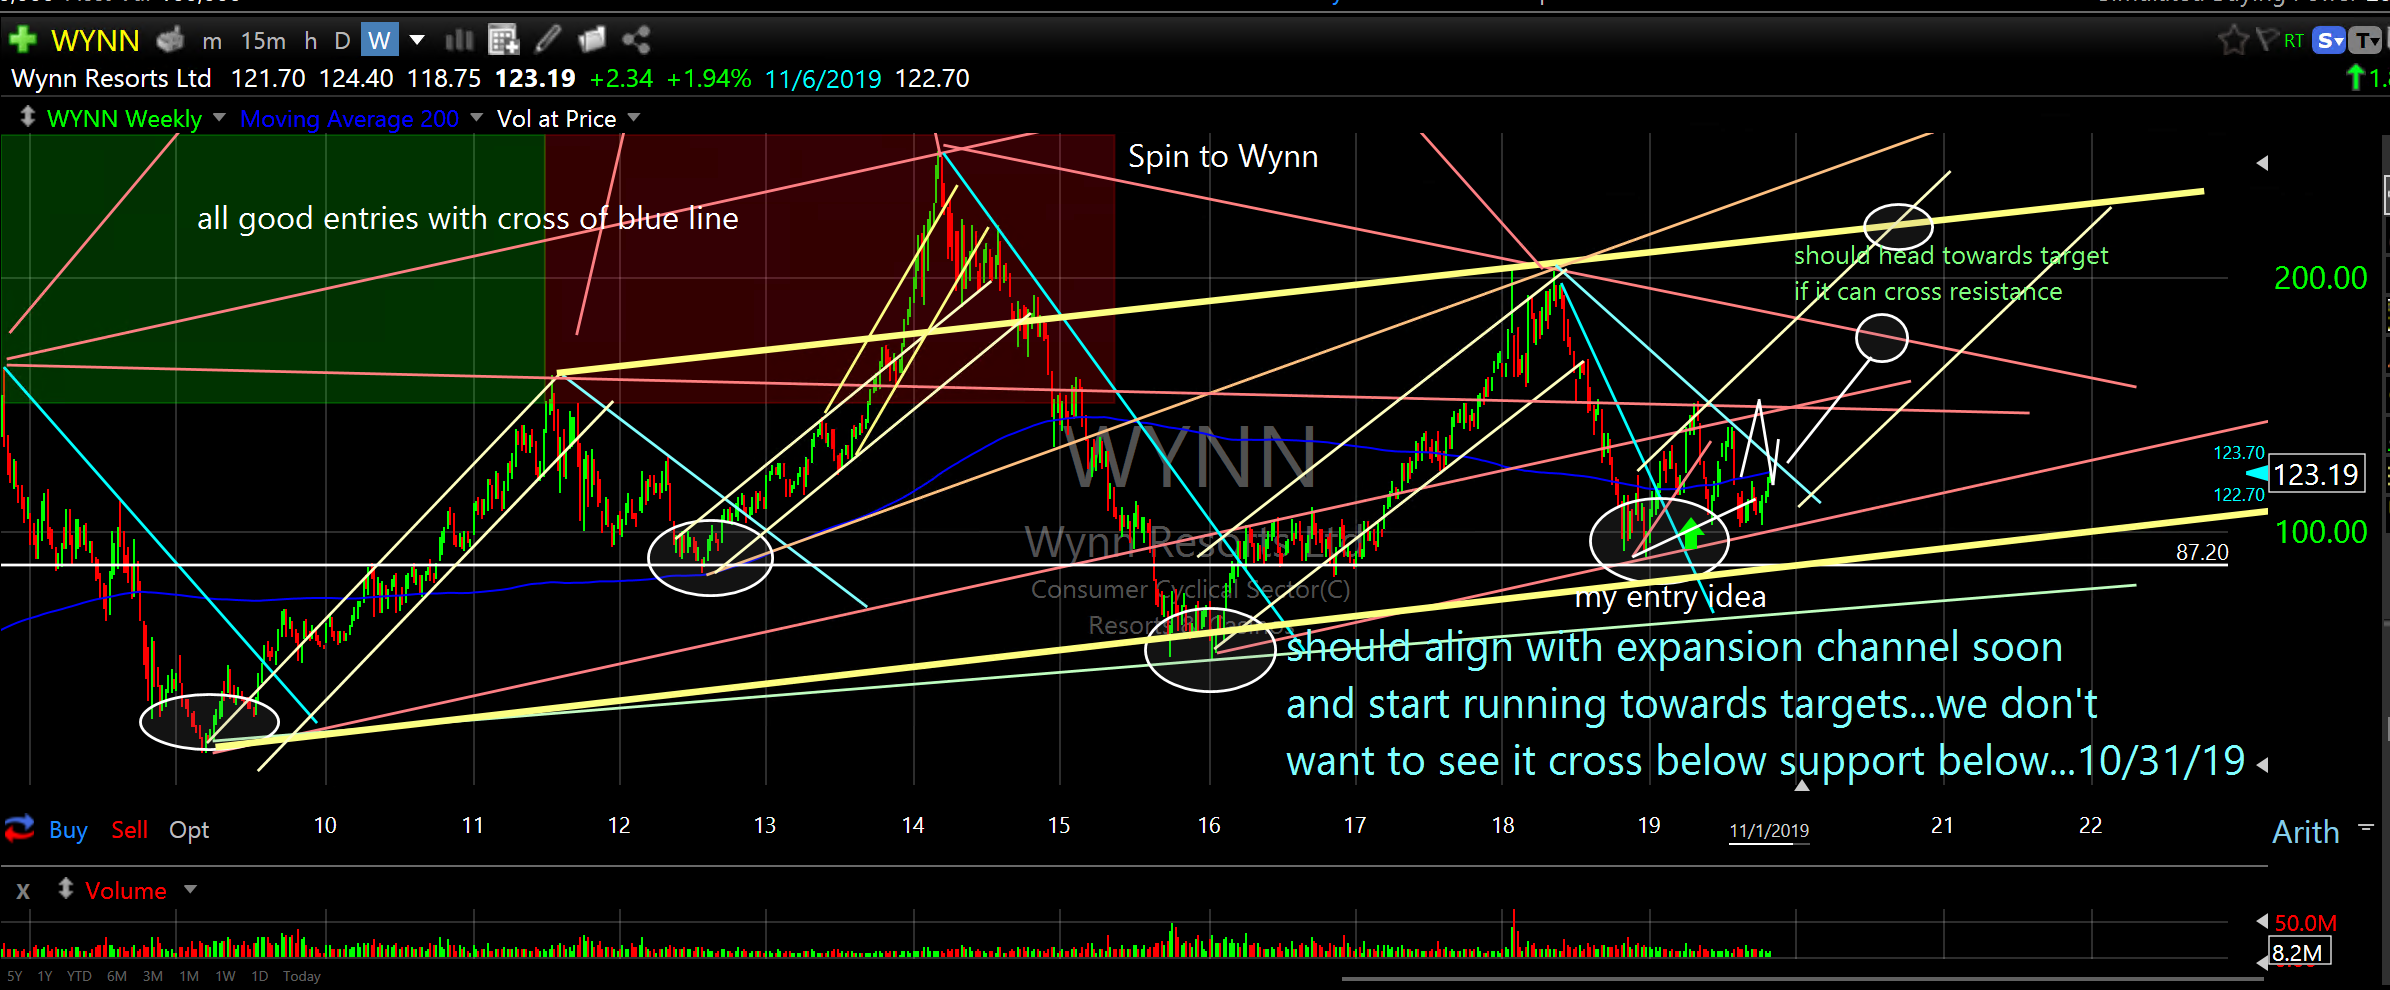
This week I would like to show a few charts of Entry Ideas (still open) I have shared with you this year. Please observe different linear degree expansion and collapse channels along with cycle rotation where reversals occur identifying Entry and Exit zones.
Gorman-Rupp Co (GRC) daily
JB Hunt Transport Services (JBHT) daily
Market Vectors Junior Gold Miners ETF (GDXJ) daily
Western Digital Corp (WDC) daily
YETI Holdings Inc (YETI) daily

Grayscale Bitcoin Trust (BTC) (GBTC) daily from 2018

Grayscale Bitcoin Trust (BTC) (GBTC) daily from March 4th entry

Microstrategy Inc (MSTR) weekly
iShares MSCI Japan Index Fund ETF (EWJ) daily
NVIDIA Corporation (NVDA) daily
Micron Technology Inc (MU) daily
Piper Jaffray Companies (PJC) daily
Wynn Resorts Ltd (WYNN) weekly
Arrow Electronics Inc (ARW) daily
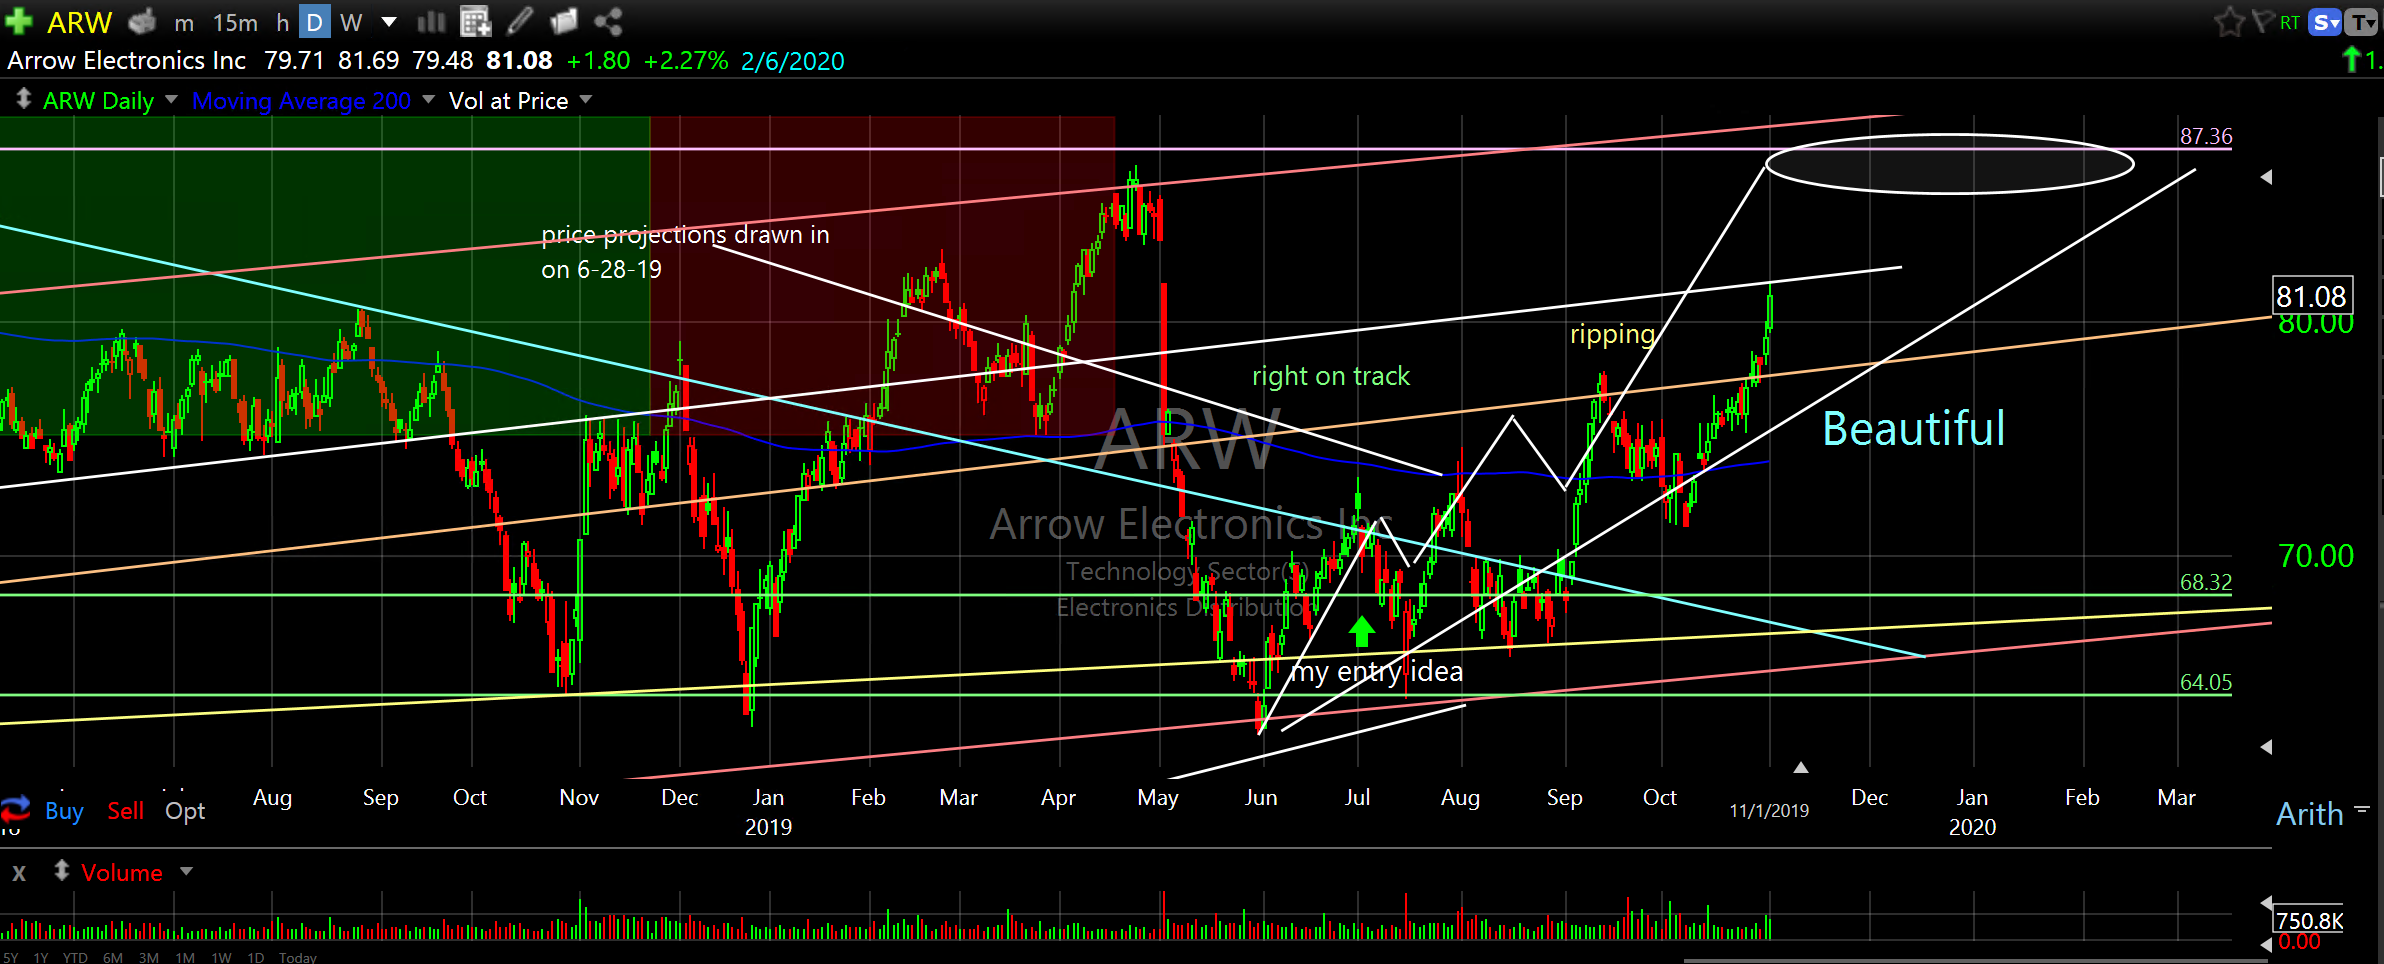
You can clearly see from these charts and hundreds more on my website that publicly traded equity and debt instruments run in fractal and repetitive cycles of expansion, collapse and consolidation. You can also see how I identify these cycles. You can also see why we attempt to identify these cycles; in order to BUY LOW and SELL HIGH. You can also see that these cycles occur in all time frames. You can also “see” that the longer your time frame is the wider your price range tolerance should be. In addition, the longer time frame channel you choose, inside which the expansions, collapses and consolidations live, the lower your investment return slope will be. In other words, buy and hold will produce the lowest investment return result compared to accurately identifying shorter term reversals.
In other words, Buy and Hold lives at the long end of the time horizon spectrum. This is where you must be willing to accept whatever the market gives or takes. It’s the real difference between never selling and actively selling, even if active means every five years or once per month (remember, choose your channel). At the other end of the time horizon spectrum is Robotville; the human programmed artificial intelligence high frequency systems trading every second of the day; buy, sell, buy, sell. I live somewhere in the center of this spectrum where it is possible to identify both long term, highly significant reversal zones where bull markets begin and where bull markets end and identify shorter term cycle reversal zones that make it possible to Buy Low and Sell High more frequently. Most investment professionals will tell you this is impossible. I tell you this is possible. You only have to read my archived commentary, charts and trade ideas to know and understand this and more importantly, to repeat it in the future, on your own.
Just take a look at this chart of Centene Corp (CNC). Which channel would you like to be in. Which channel would you like to avoid. Channels like this occur on all time frames. Choose your time frame, choose your tolerance, choose your channel.
Centene Corp (CNC) weekly…choose your channel
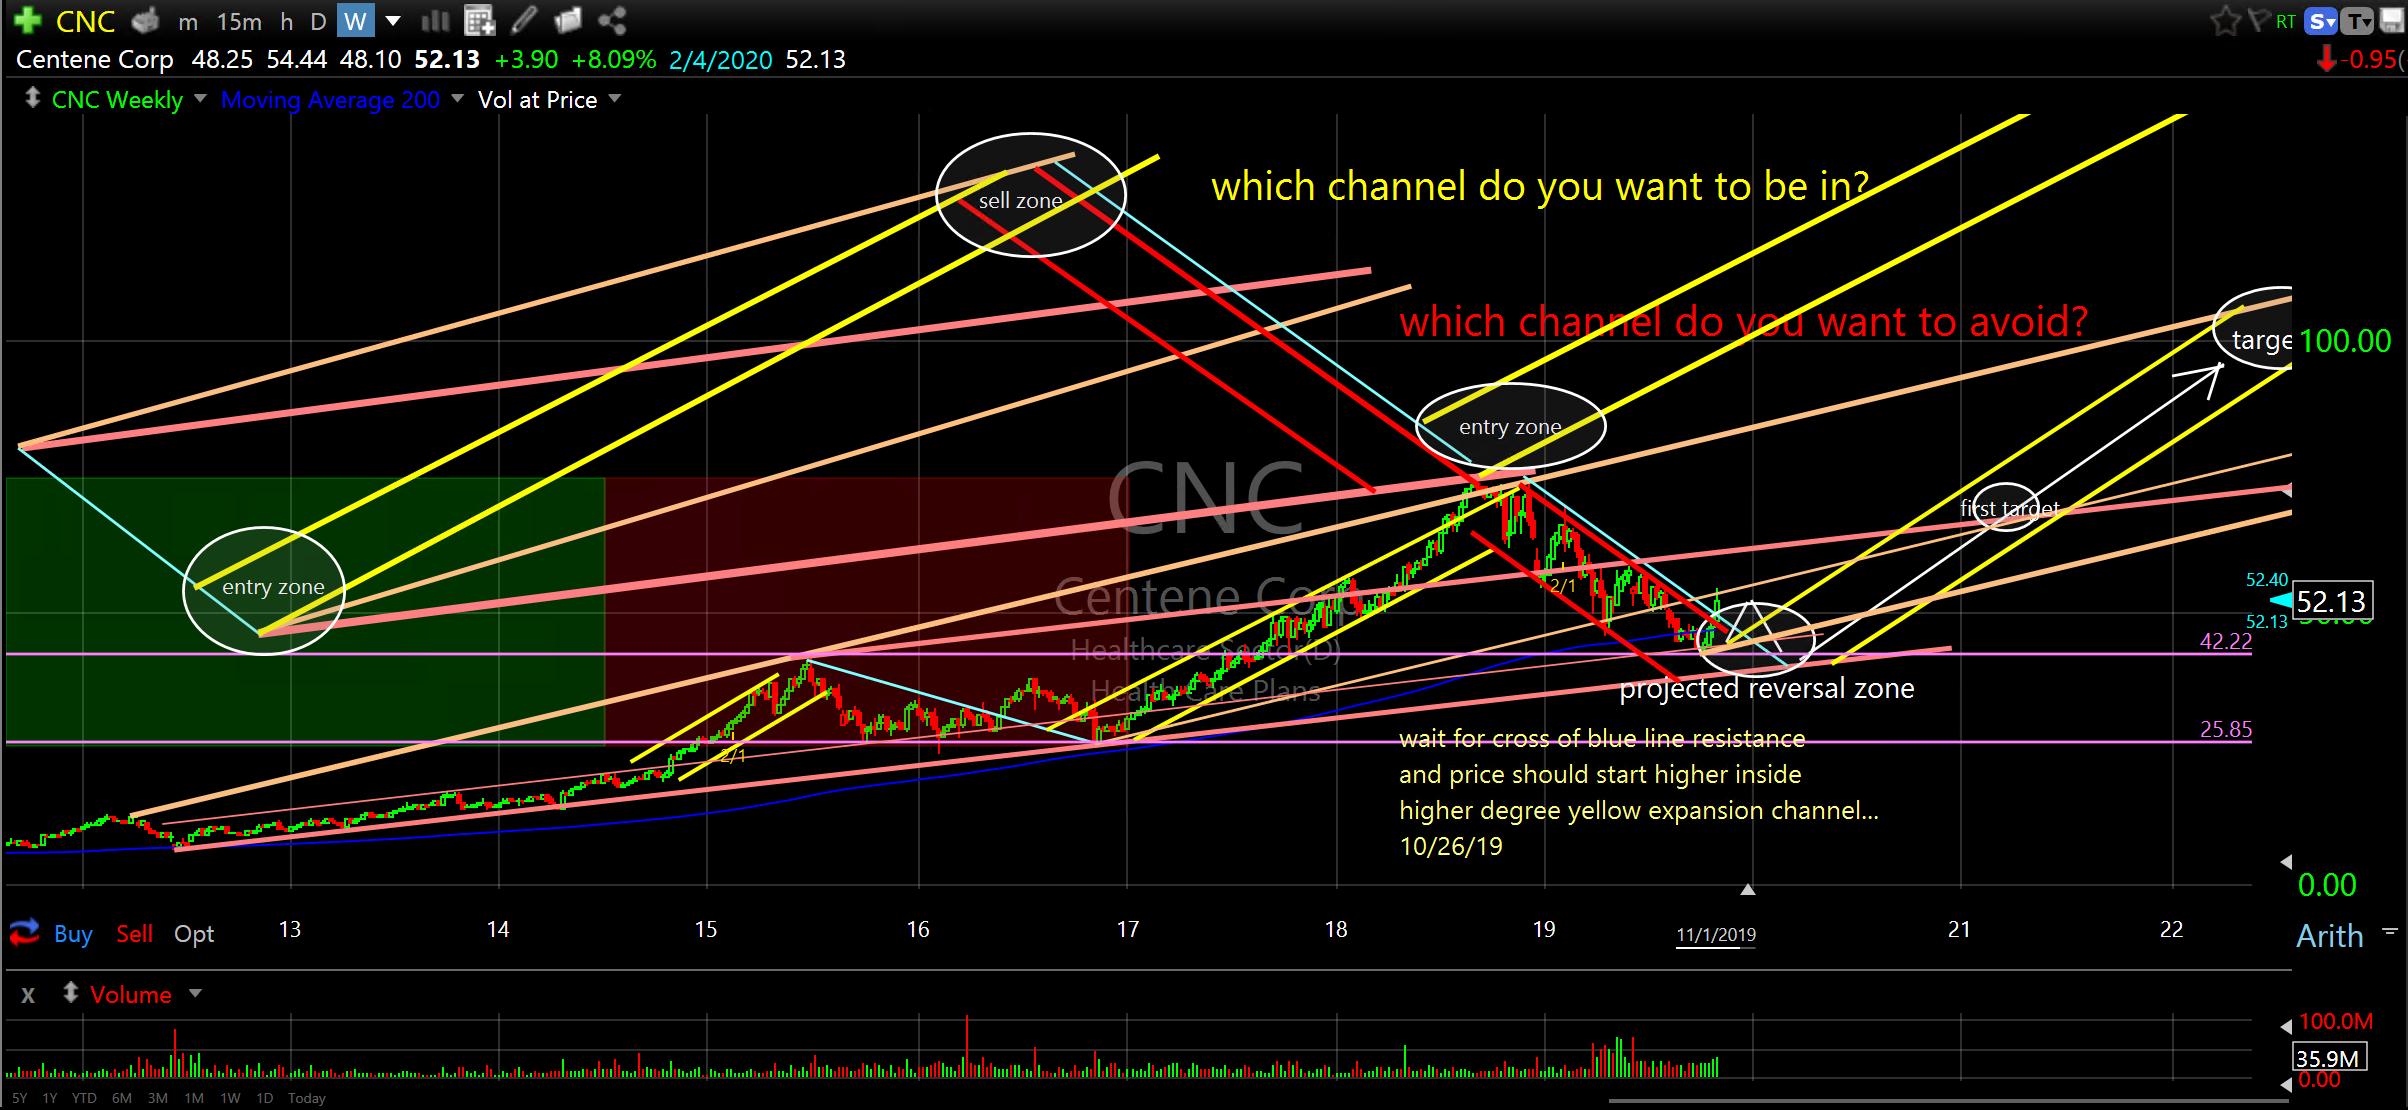
Yes, it is possible to identify and avoid collapse channels on short, intermediate and long term time frames. Yes, it is possible to avoid bear markets. Yes, Yes, Yes. This is possible! Do not believe those who tell you it’s impossible. THEY ARE WRONG.
And, we haven’t even covered the many other properties and characteristics of equity and debt instruments that exist on the other side of the surface. Come on in, let me show you.
Alice in Wonderland
In conclusion, I would like to share a few thoughts from the TC2000 workshop I attended over the weekend (I’m back home now Sunday evening). TC2000 functionality and features aside, which are great by the way, I still can’t believe the antiquated entry and exit ideas that still exist in our advanced information age. I continue to be astounded by the lack of understanding that hangs like a dark cloud over both retail and institutional investors about the characteristics and behavior of equity and debt instruments. I took a look around at the two or three hundred attendees and I just wanted to get up and scream “LET ME SHOW YOU SOMETHING THAT WILL BLOW YOUR MIND”. But, I kept my cool, shared some things with a few people I met and even invited the instructor (20 years experience) to read my work. Maybe he will, maybe he won’t. I don’t know. Again, I’m left thinking people just don’t know what they don’t know.
You know what else I think? I think I’m the luckiest guy in the world to understand what I know to be true about the stock market. I feel like “Alice”, seeing what is beyond what most people see through the Looking Glass. What a world! It’s wonderlanderful. Just ask Alice the swan who lives in Cambridgeshire.

(click to enlarge)
I guess my weekly notes weren’t abbreviated after all. I hope you enjoyed the read and thanks for your time.
Croquet anyone?
Don