Broader Market Review
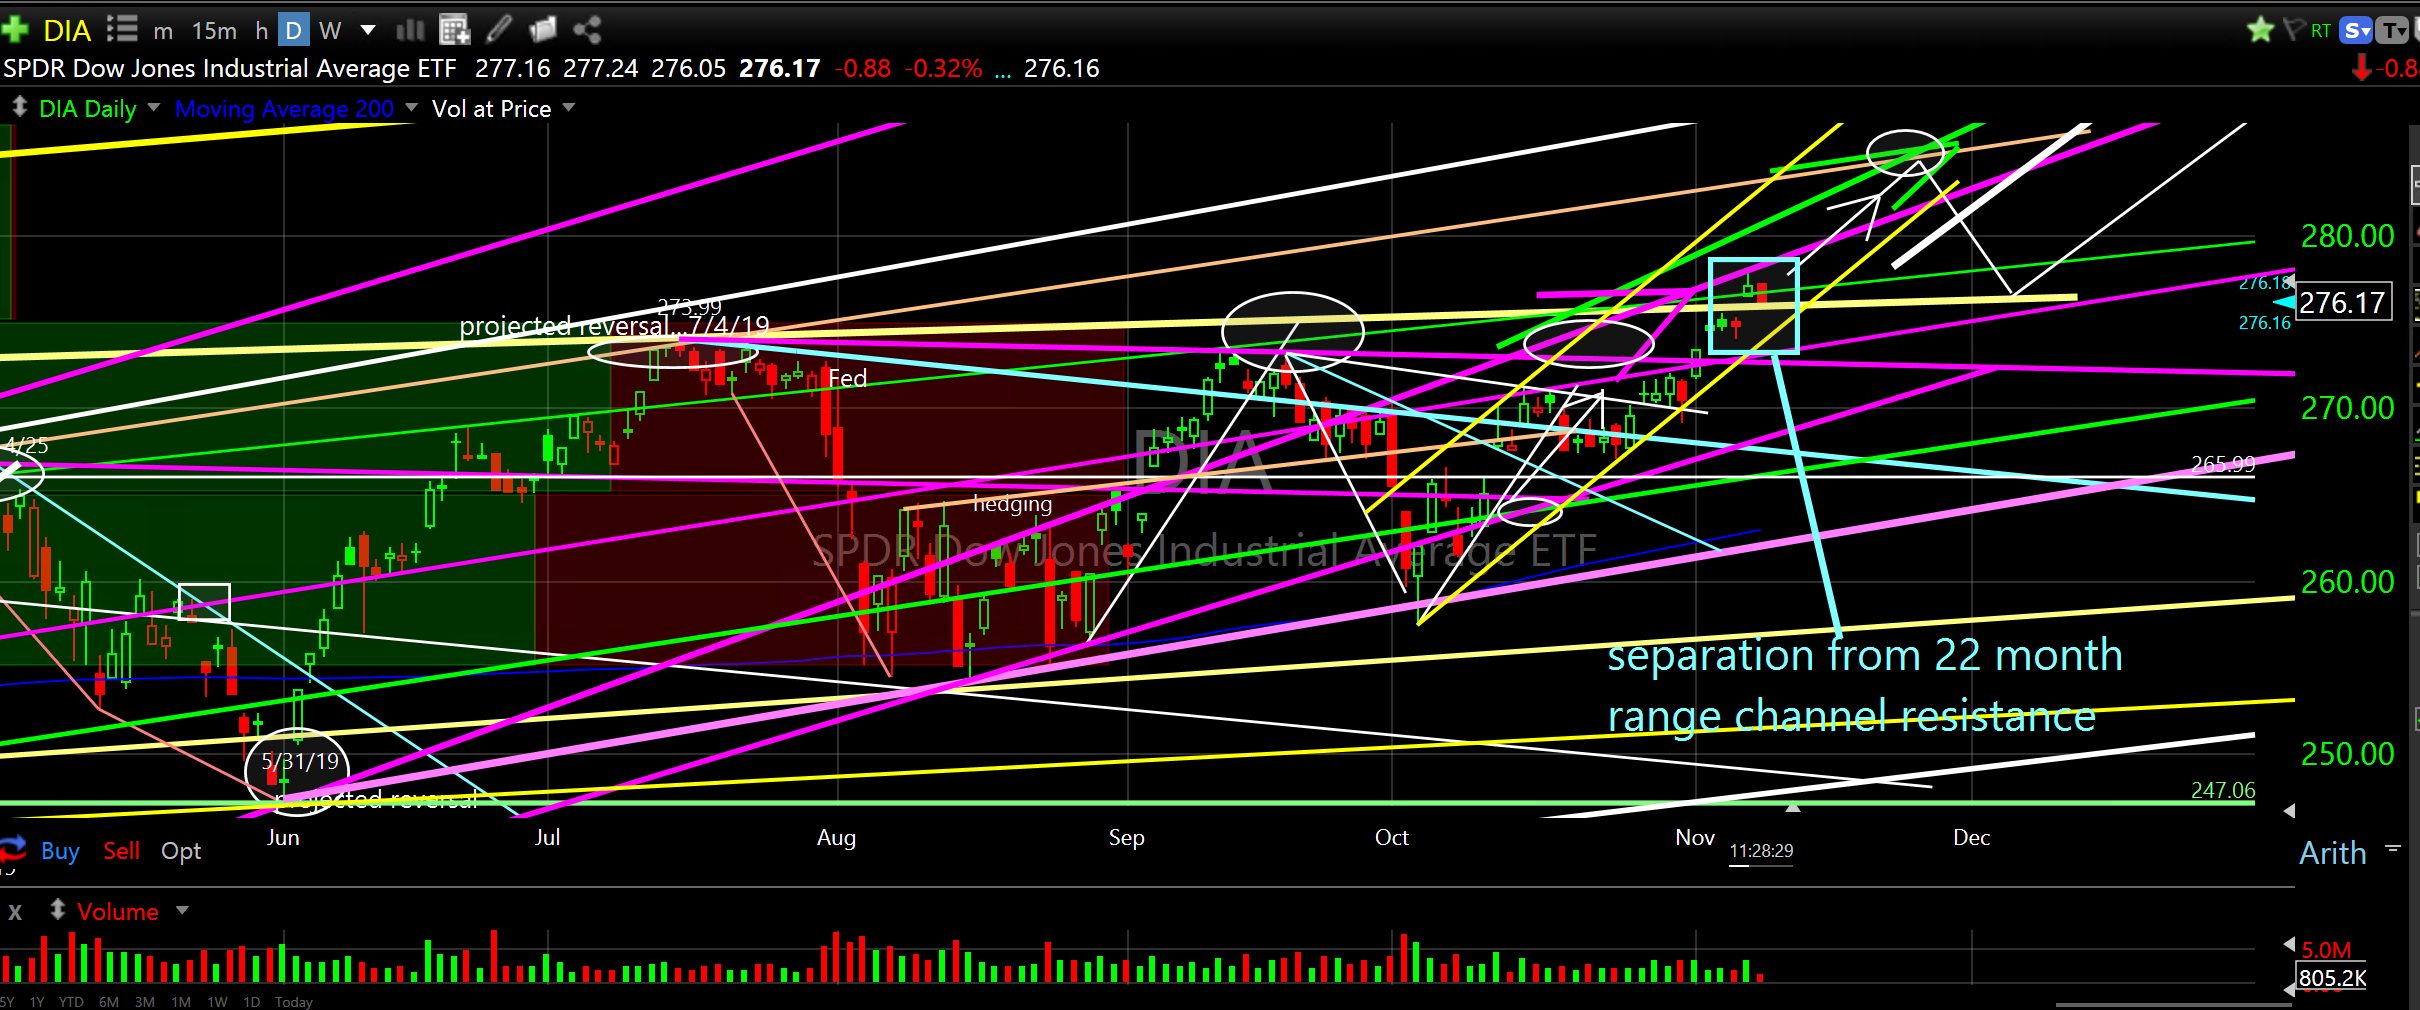
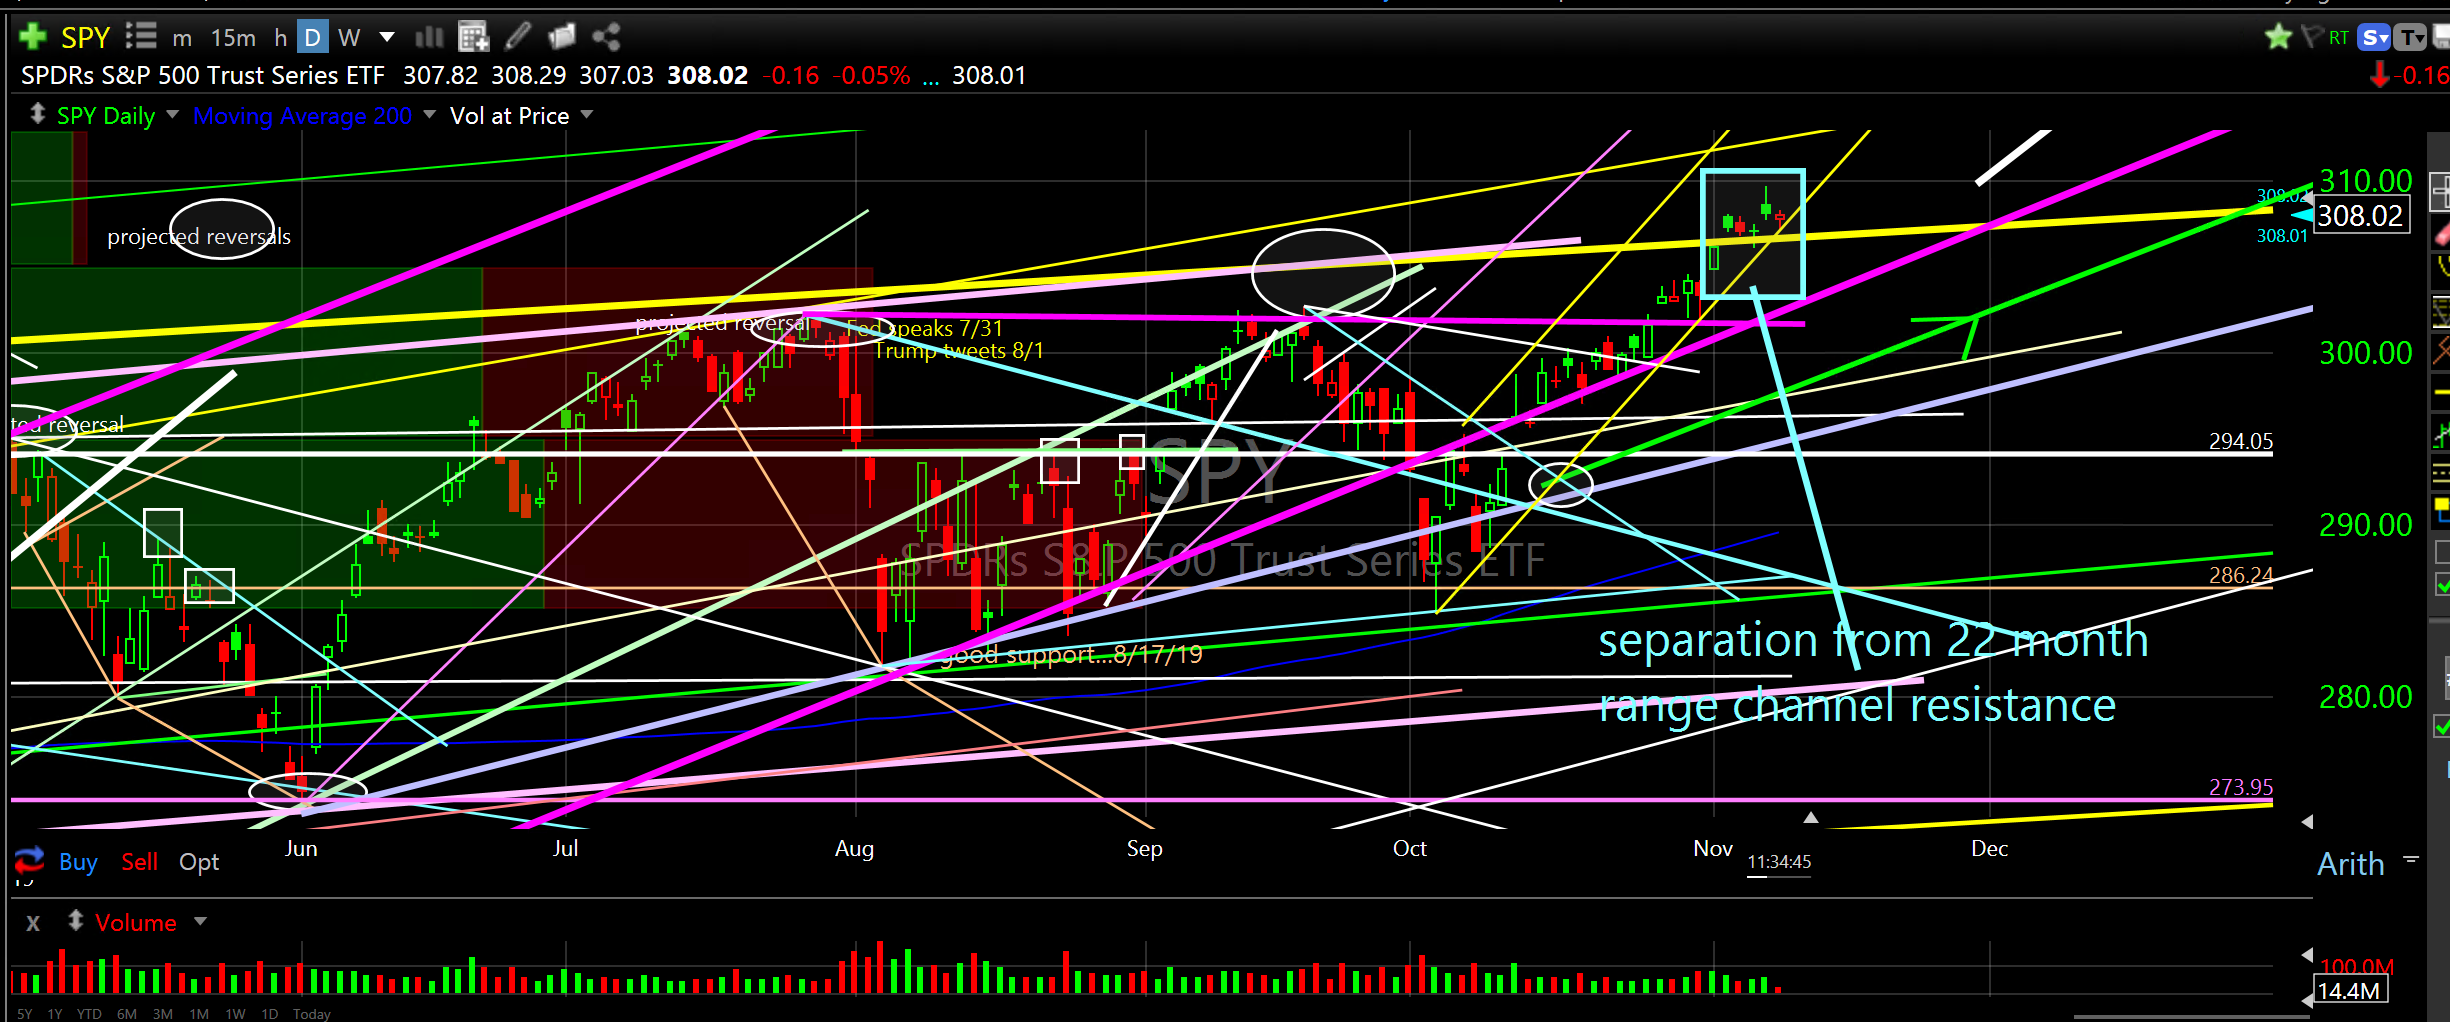
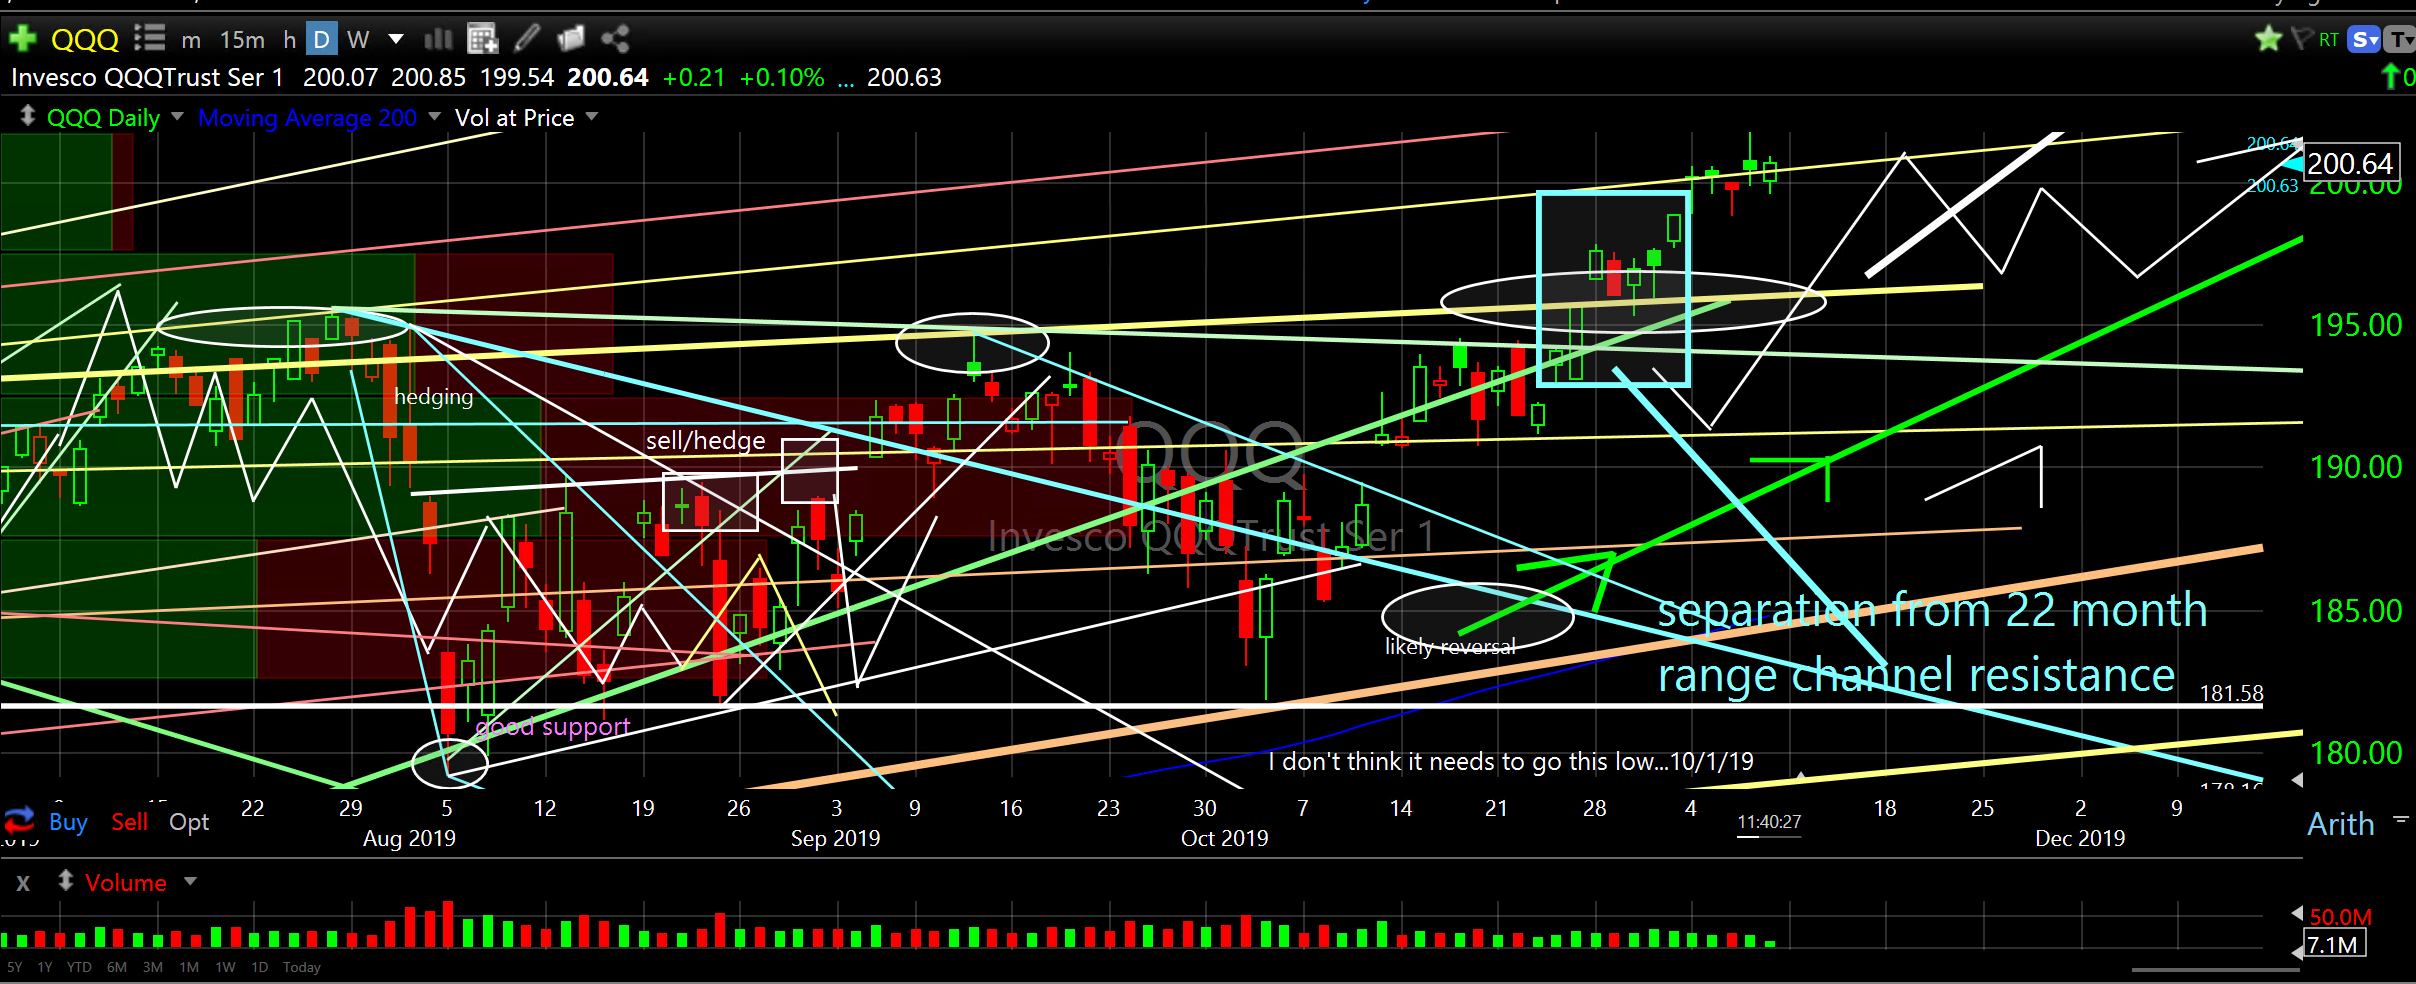
Just like I have been describing most of the year, the broader market has released above resistance and is beginning to separate from its 22 month range channel into its expansion channel leaving all those negative nancy’s in the dust scratching their heads.
It has happened almost exactly as I have projected. The Dow Jones Industrial Average, the S&P 500 Index and Nasdaq have all crossed over ascending resistance and are transitioning into their expansion channels. This is what I have been waiting for. This is what I have been expecting, writing about and projecting for months and months. In my humble opinion, it’s time to go ALL IN. We may get a significant dip in late November/early December as a re-test of the top of the range channel (previous yellow line resistance which is now SUPPORT) but this would be normal and expected after such a significant crossover after 22 months of consolidation. The balance of November could be a real ramp ripper rally then a reflective dip in December then a year end rally into 2020 then a ramp higher into the presidential election.
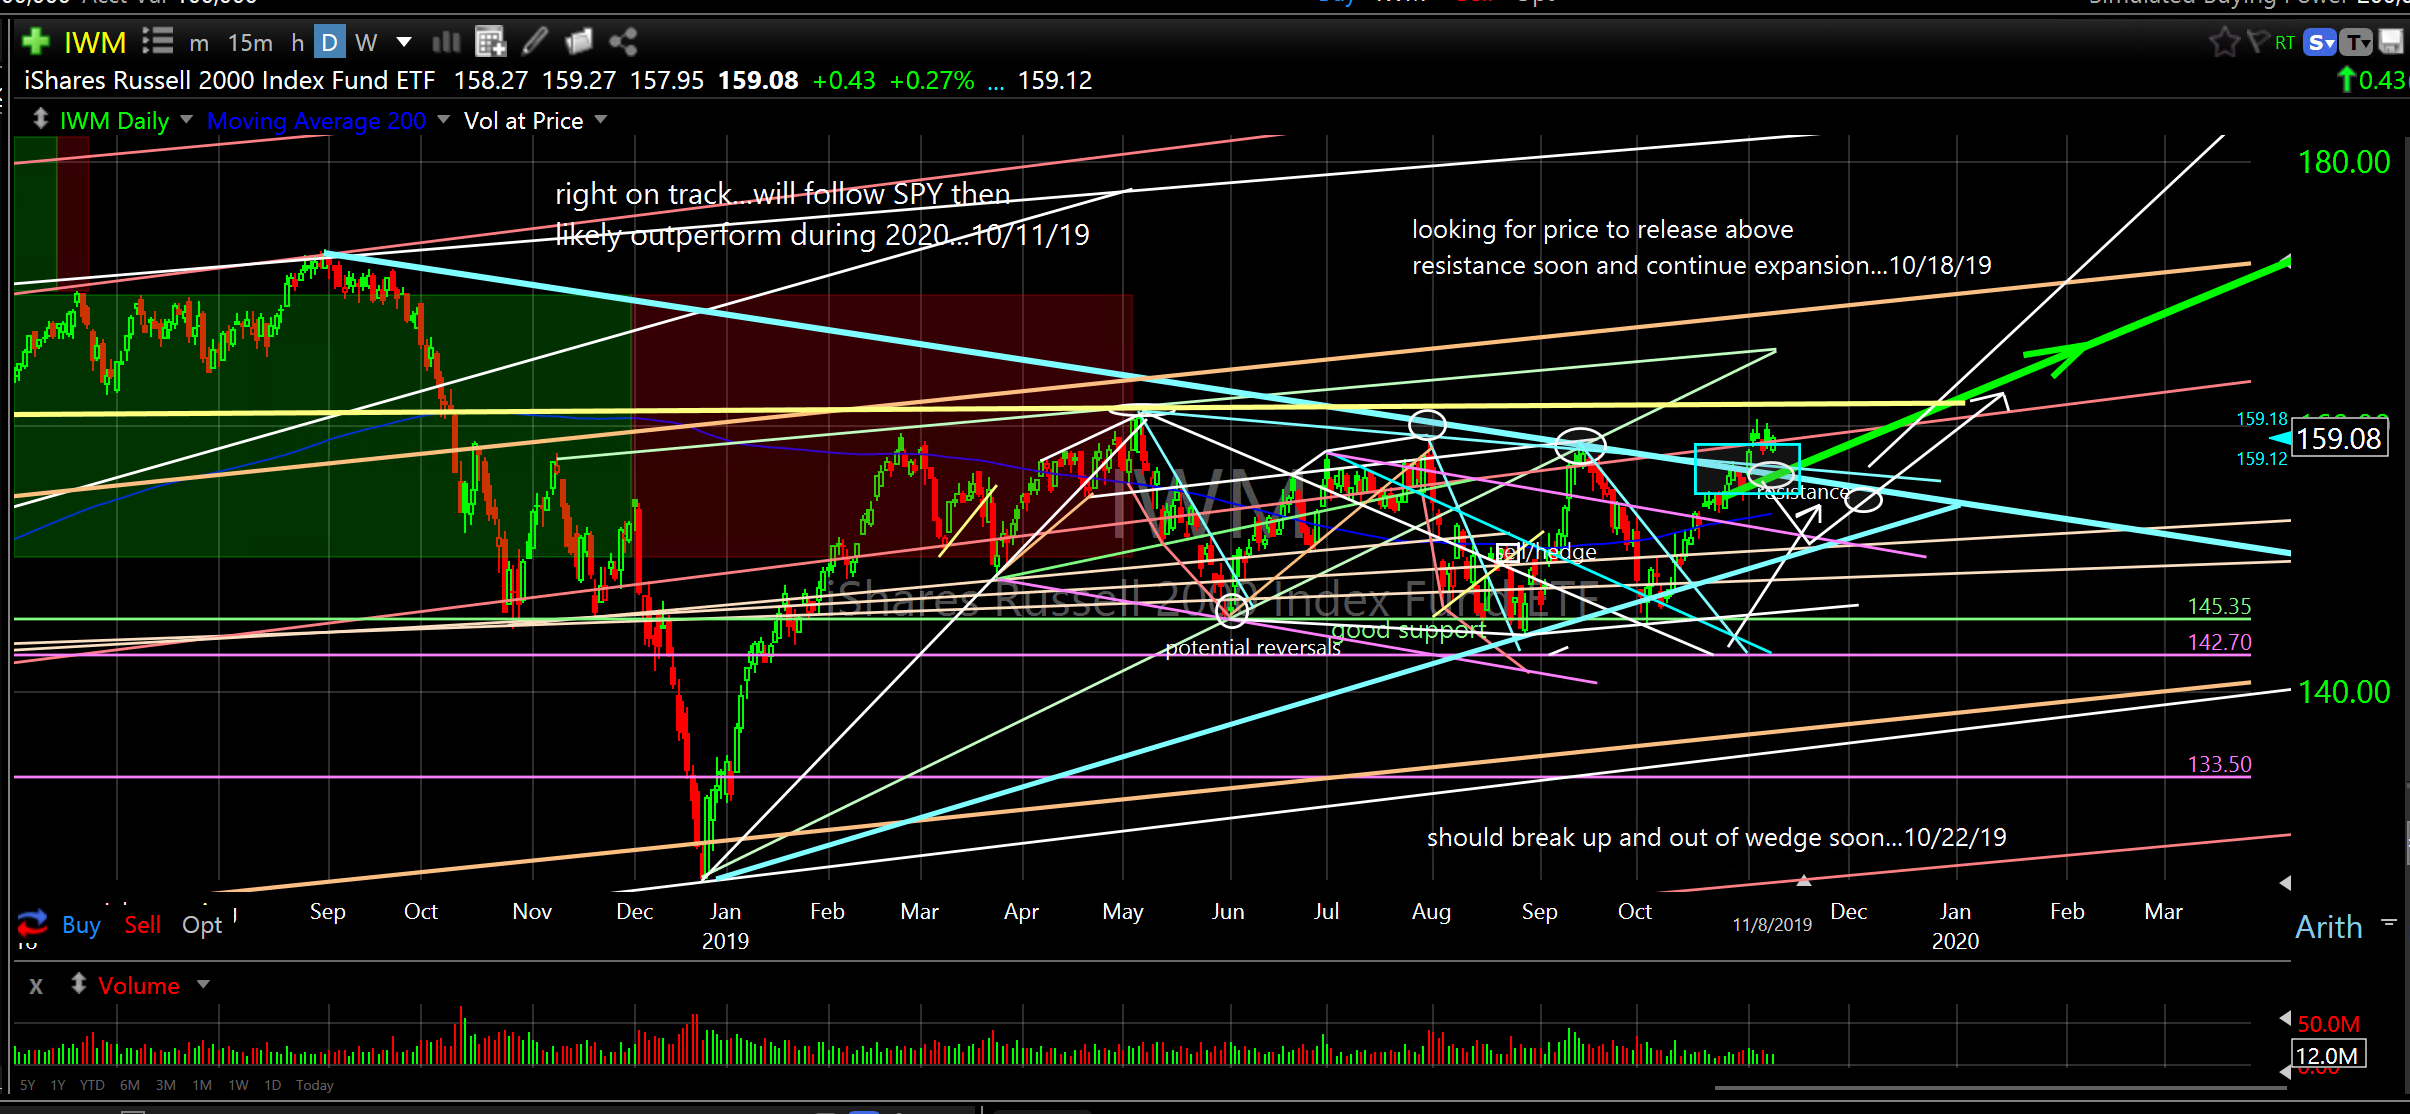
Please see the charts below of DIA, SPY and QQQ to see the crossover/release points that I have boxed in blue. I have also included IWM, the iShares Russell 2000 Index Fund for small caps. It is beginning to expand as well and a likely candidate for outperformance. In my opinion, these broader market ETF’s are all positioned as good entries now. Remember, you can leg in over the next few months to reduce risk.
DIA
SPY
QQQ
IWM
Longer Term Broader Market Projections
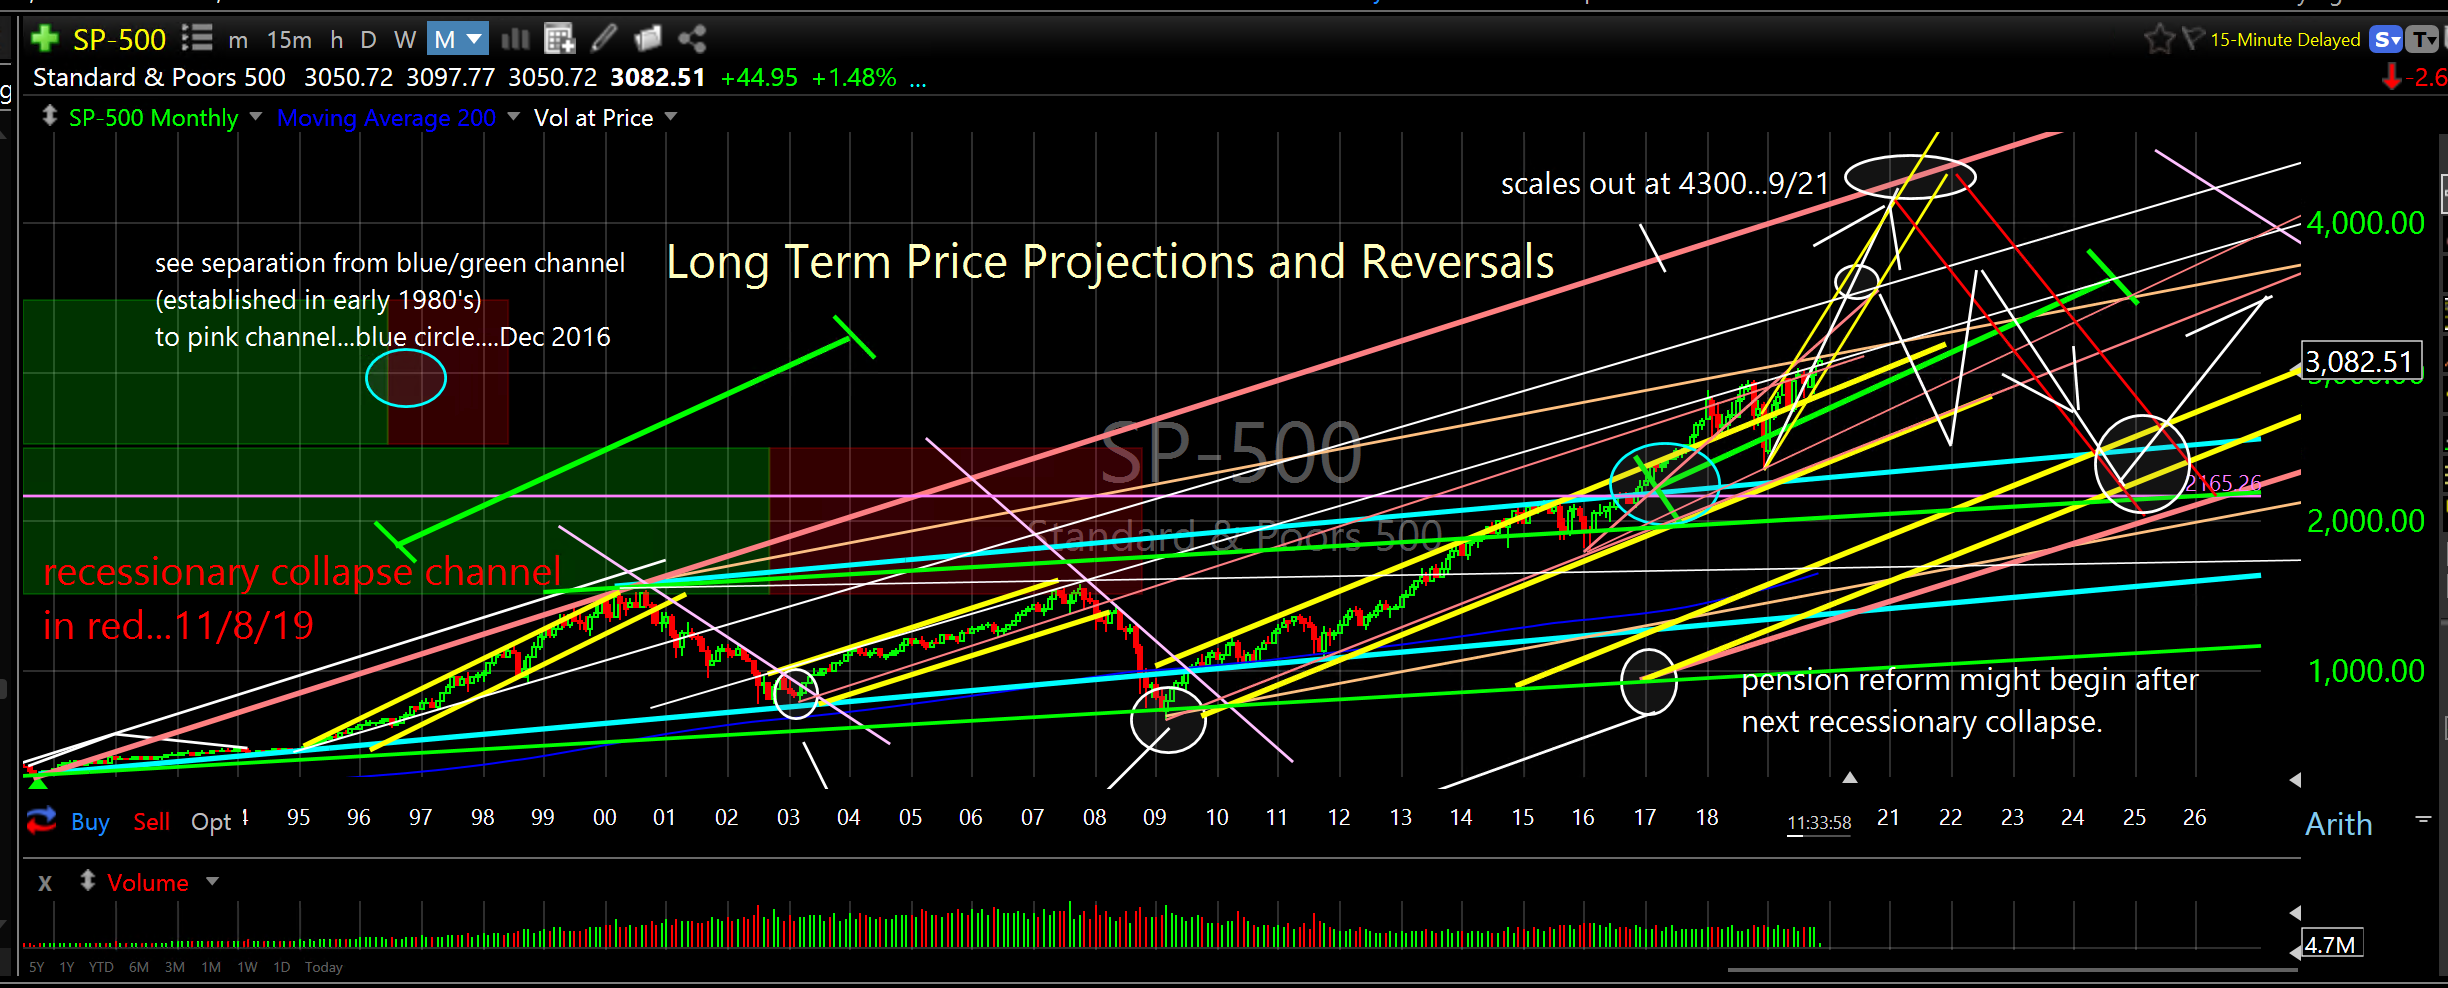
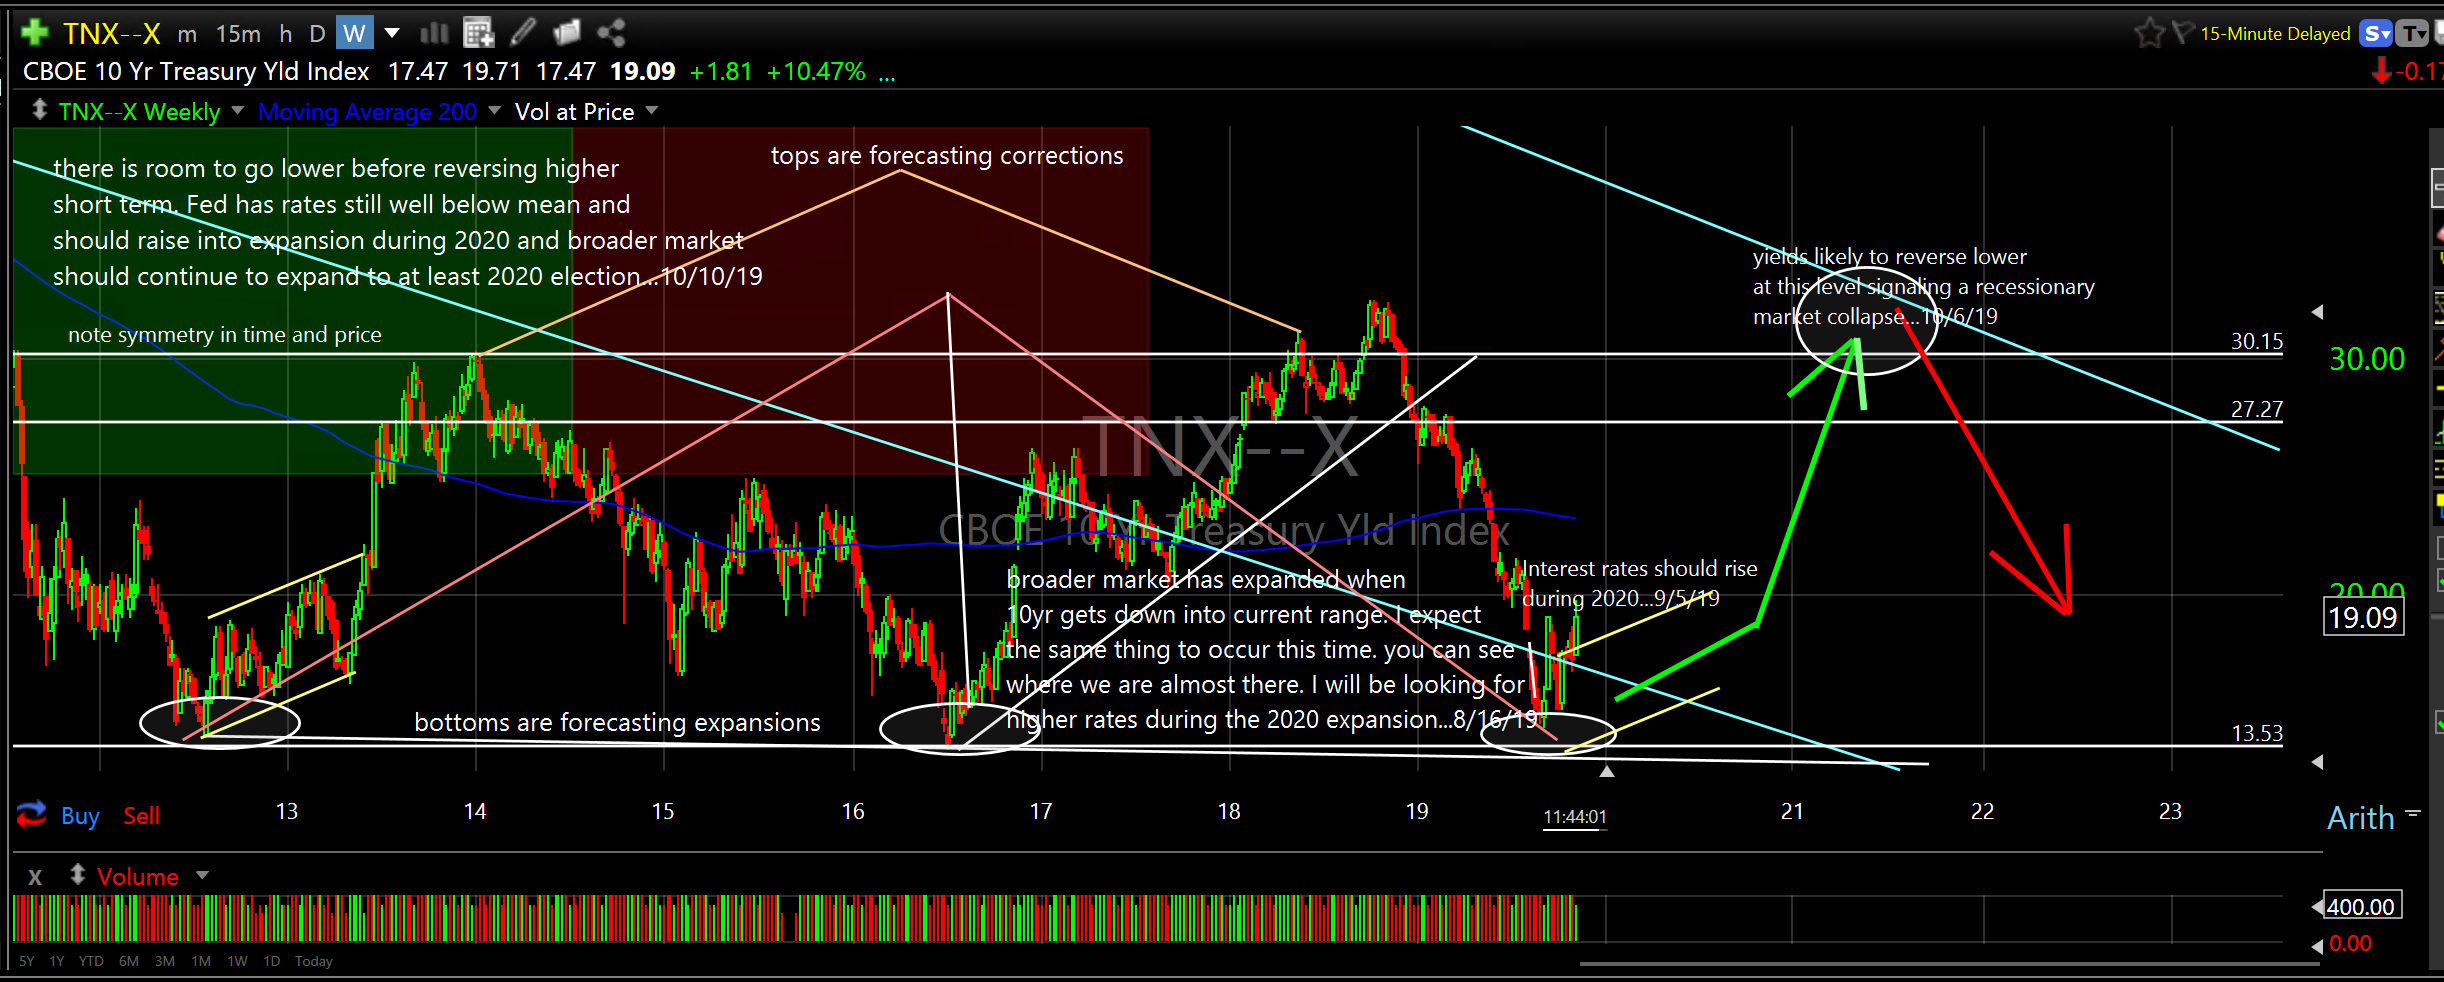
Now let’s look at some longer term broader market price projections. The first chart is a monthly chart of the S&P 500 Index (SPX) from 1982 to 2026. This is my long term roadmap which aligns with my yield forecast chart of the 10 Yr Treasury Yield Index (TNX-X) out to 2023. It is a broad brush forecast and subject to refinement as shorter term expansions, corrections, slopes, lengths and other price action characteristics are observed and measured. See charts below for notes, annotations and projections. See website for charts of gold, energy, sectors and subsectors to see how they are positioned relative to broader market forecast. All of the pieces of the puzzle are starting to fit together like they should for another equity expansion cycle.
SPX
TNX-X
The Takeaway
The Big Takeaway should be that you CAN project, with high accuracy, all time frame reversals. You can project recessions. You can project long term expansions. You can project short term reversals (see my broader market short/intermediate term price projections for all of 2019 that I forecasted BEFORE they happened). For that matter, just look at all of the “Exits” (closed trades) this year. You can’t do that with fundamental analysis…NO WAY! I have proven that probability price projection is possible on all time frames. I projected the Dot.com reversal. I projected the 2003 reversal. I projected the 2008 Financial Crisis collapse. I projected the 2009 reversal at the bottom. I projected the reversal off the bottom this year in late December/early January. I have projected almost every significant reversal this year. Just go back and read my archived weekly notes…it’s all there. I don’t say this to be boastful. I say it so you know it is possible. It has nothing to do with me and everything to do with being able to “see” what the charts want to show us.
I just don’t know why people are so closed minded. Maybe I’m just lucky that I am self taught and wasn’t brain washed early because what is taught on “Wall Street” is mostly not helpful in forecasting significant reversals.
A Bit More Granular
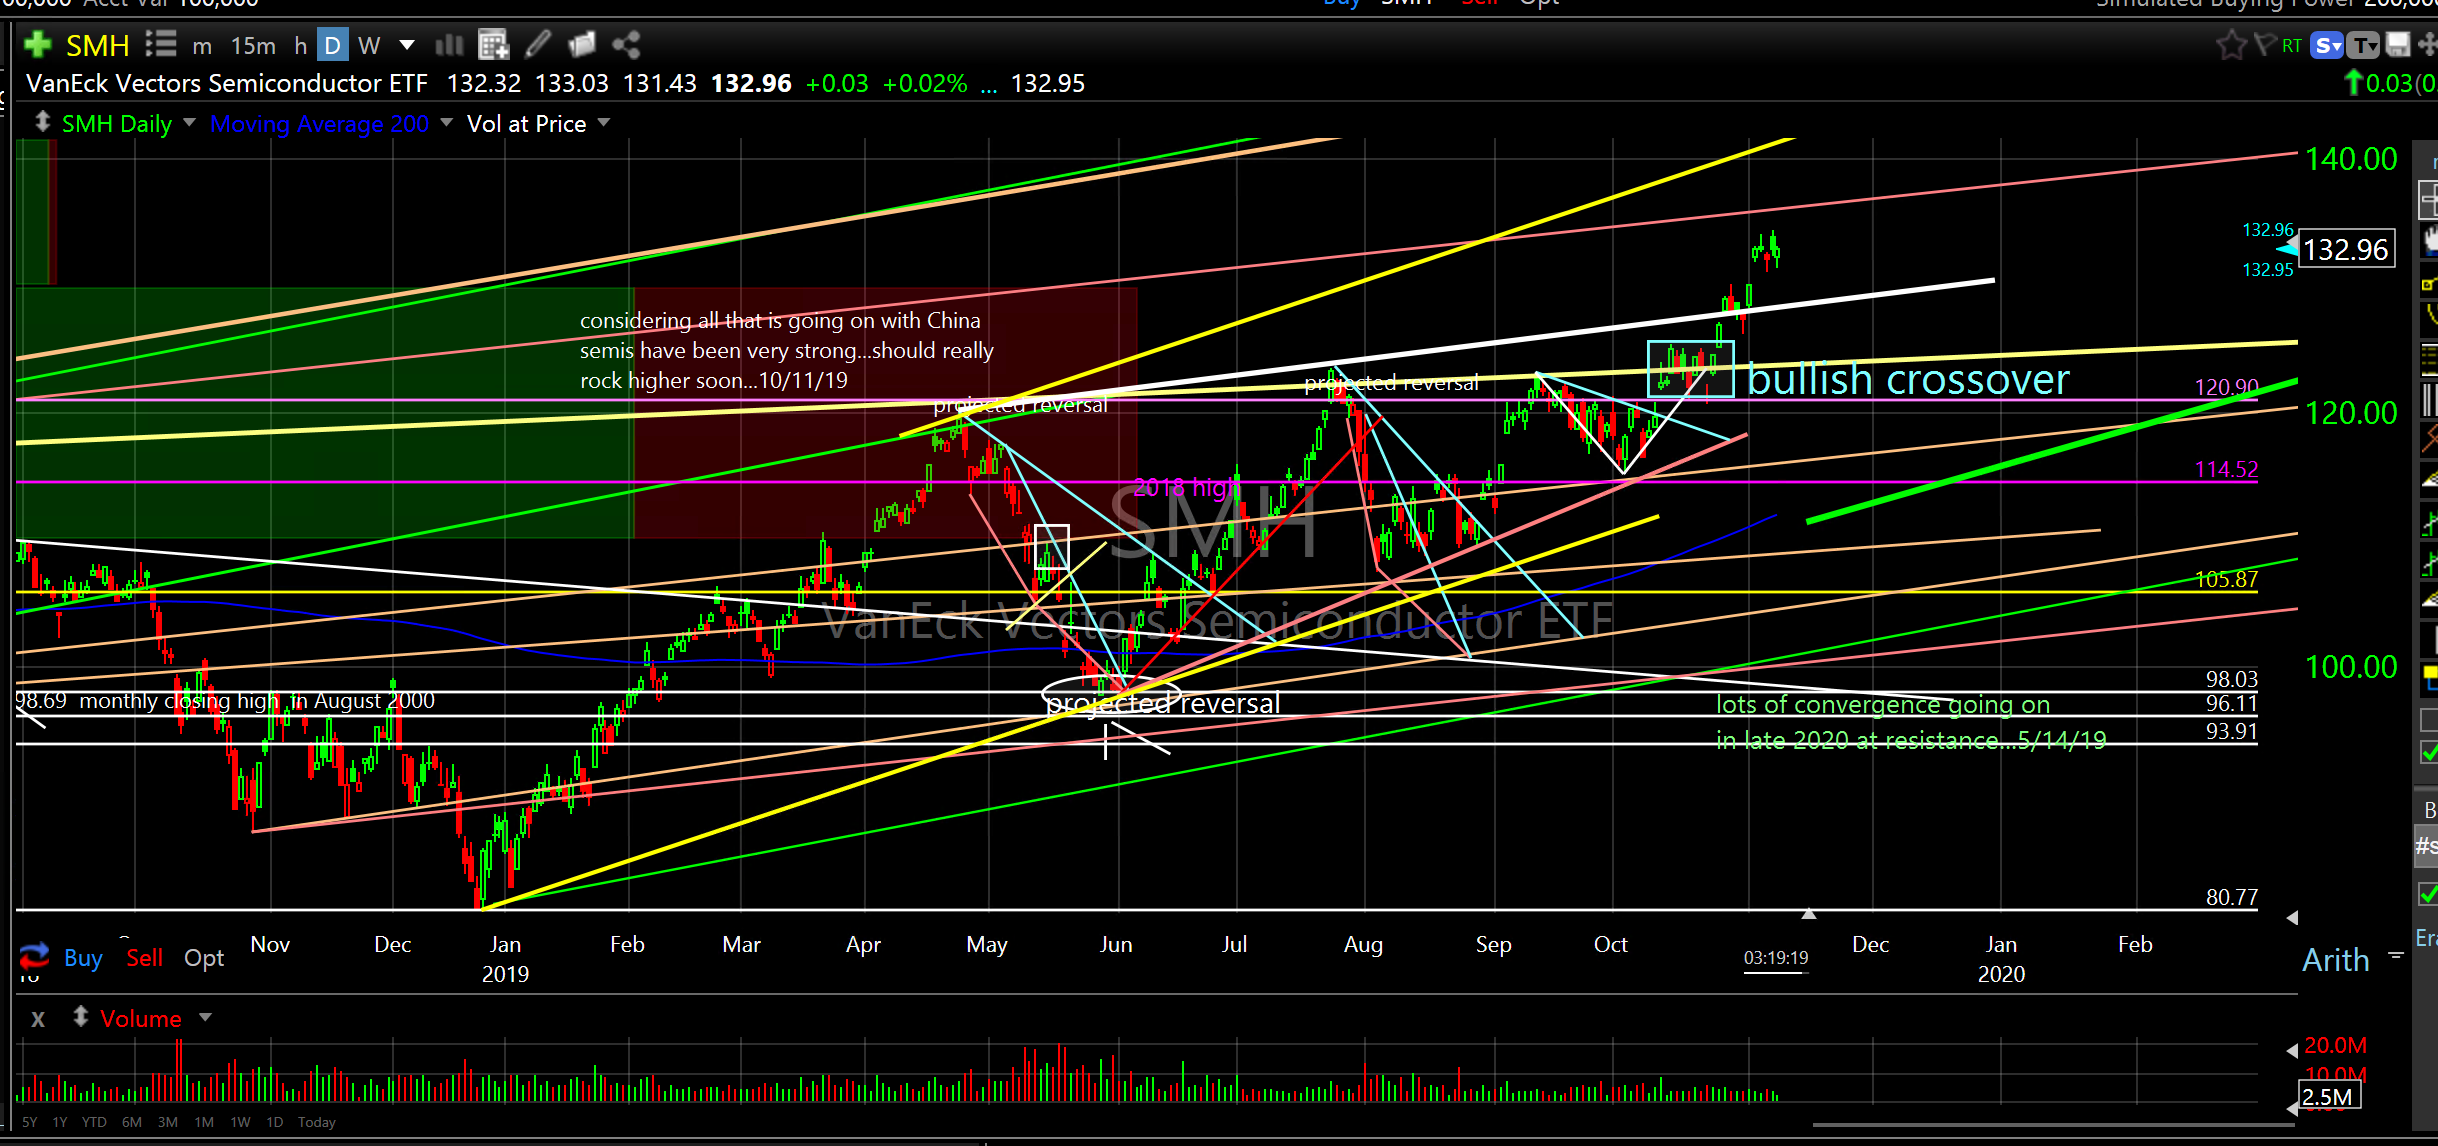
I’m not sure if you remember, but in October 2018 I pointed out that semiconductor stocks led the broader market down (the first subsector to break below ascending linear support). Now, they are leading the market higher (the first to crossover above ascending linear resistance). They are very cyclical so I always keep a close eye on them as they can provide early clues to broader market direction and price action. Understand, when they go (either up or down) they really go…they will scream higher during their expansion cycles and they will scream lower during their collapse cycles. Check out the chart of SMH, a semiconductor ETF. It’s a must own now and good candidate to outperform the broader market over the next few quarters, in my opinion.
SMH
What else is likely to outperform? Well, let’s take a look but let me start by saying this…Risk is at the foundation of everything I do. It’s the reason I chart. It’s the reason behind my entries. It’s the reason behind my exits. It is the reason I began writing and share all of this. Am I always right? Of course not. Am I right more than others? I will say yes but I’ll let you be the judge. It’s all on my website for you to read.
While all equity and debt instruments have their own individual cycles and have varying degrees of correlation understand that the broader the ETF the less it is influenced by an individual stock, subsector or sector event. So, it follows that to reduce your risk own broader ETF’s. The reverse is also true. To increase your reward and potential risk own individual stocks. In the middle, to varying degrees, are sector ETF’s, subsector ETF’s and more narrowly designed ETF’s that track most anything you can think of.
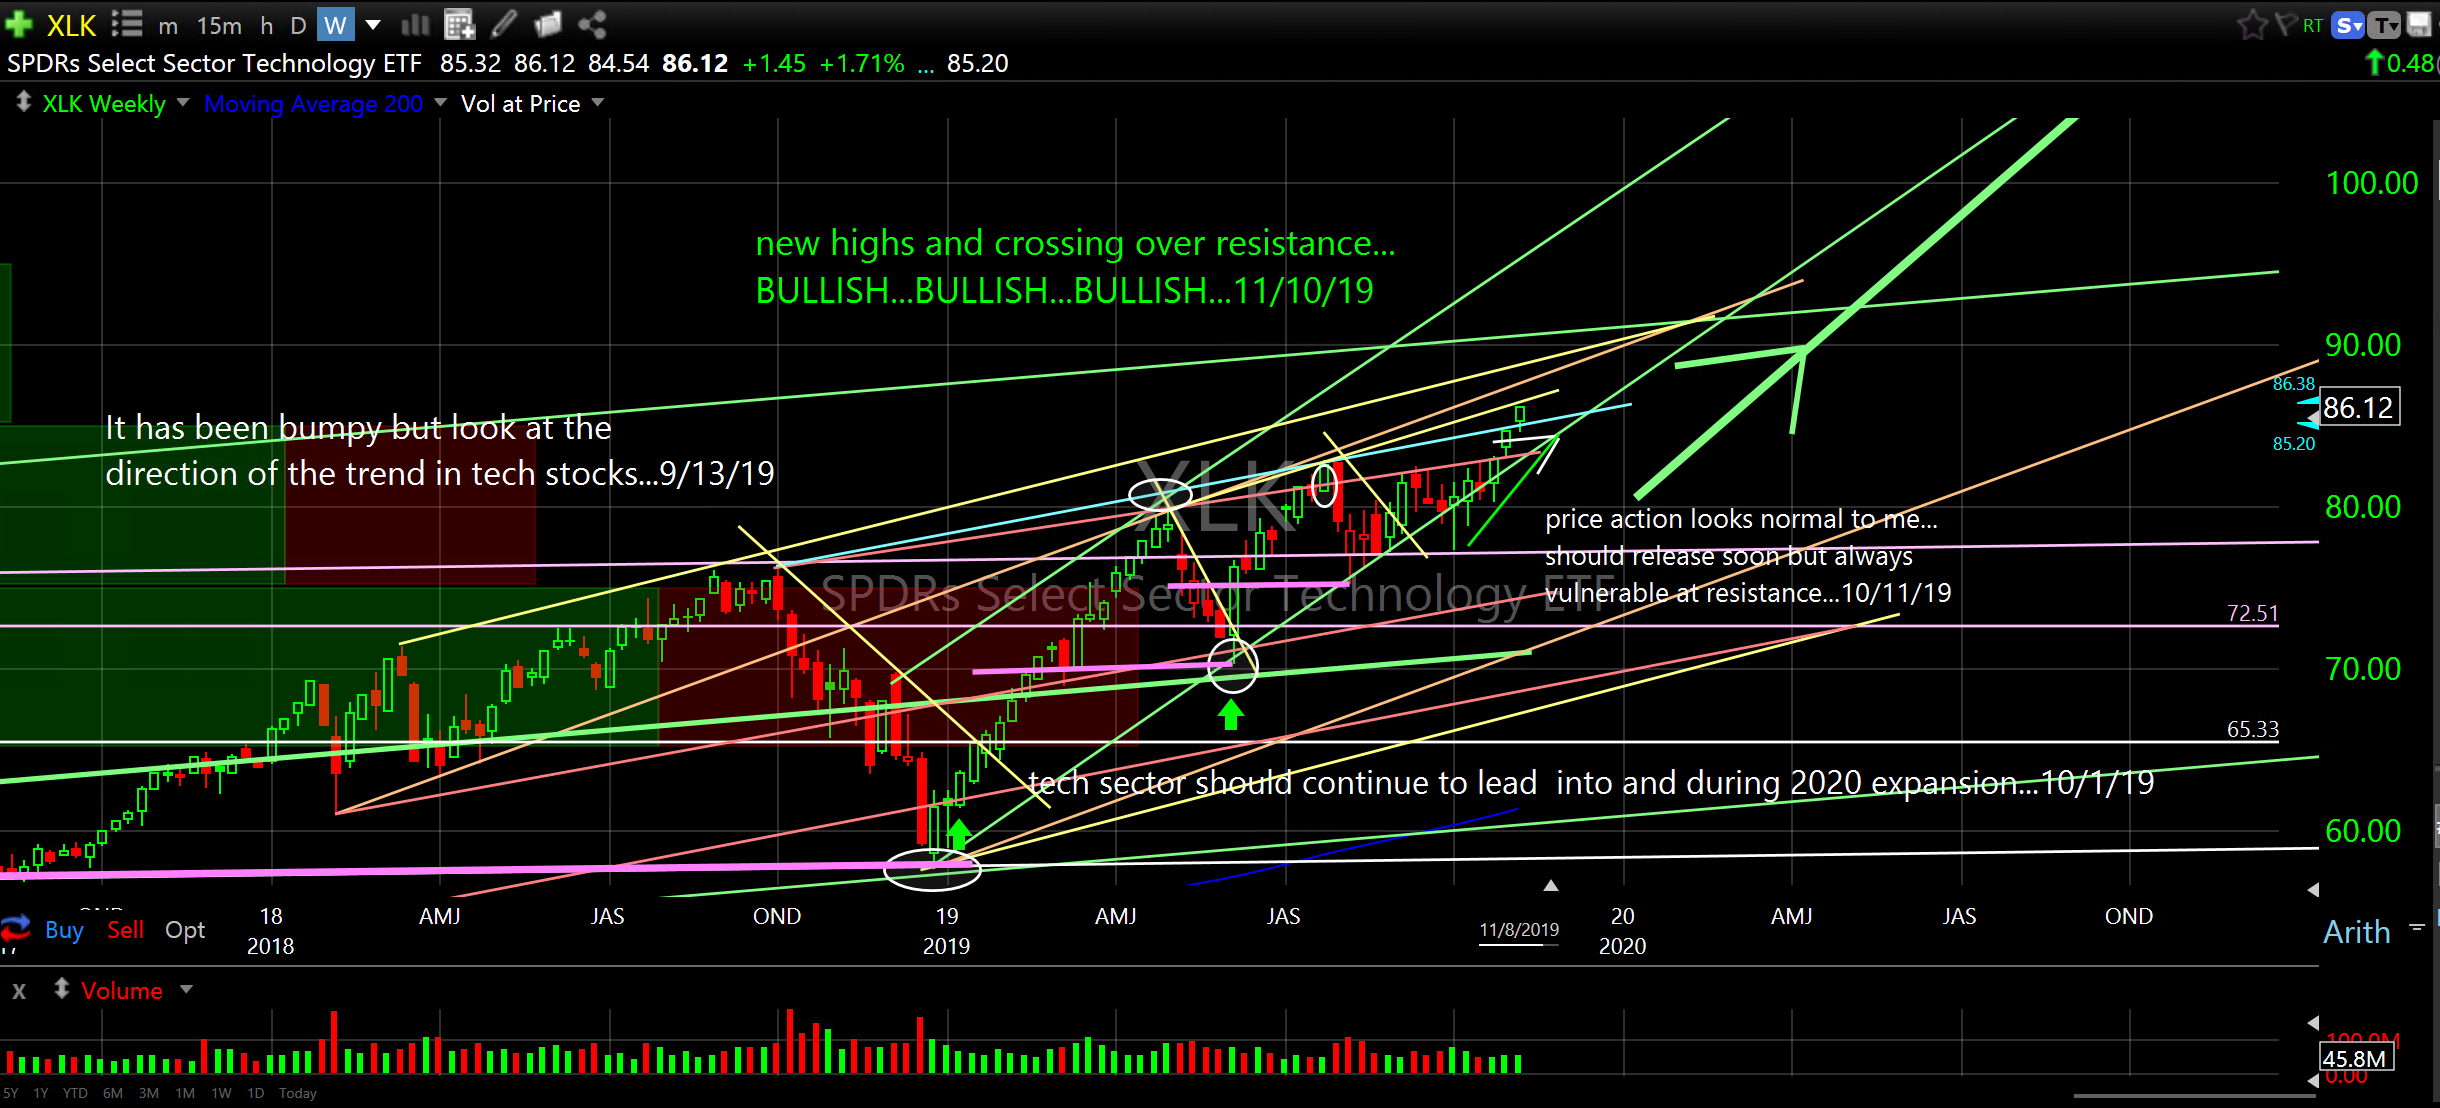
Let’s take a look at some of these sector, subsector and other ETF’s that are transitioning to their expansionary cycles, ramping higher and likely to outperform their broader ETF product mates.
Many of these are on the Entry/Open list on the Trade Alert page. I list them again, as well as others, as either accumulation or new entry ideas. These are my favorites in no particular order.
XLK
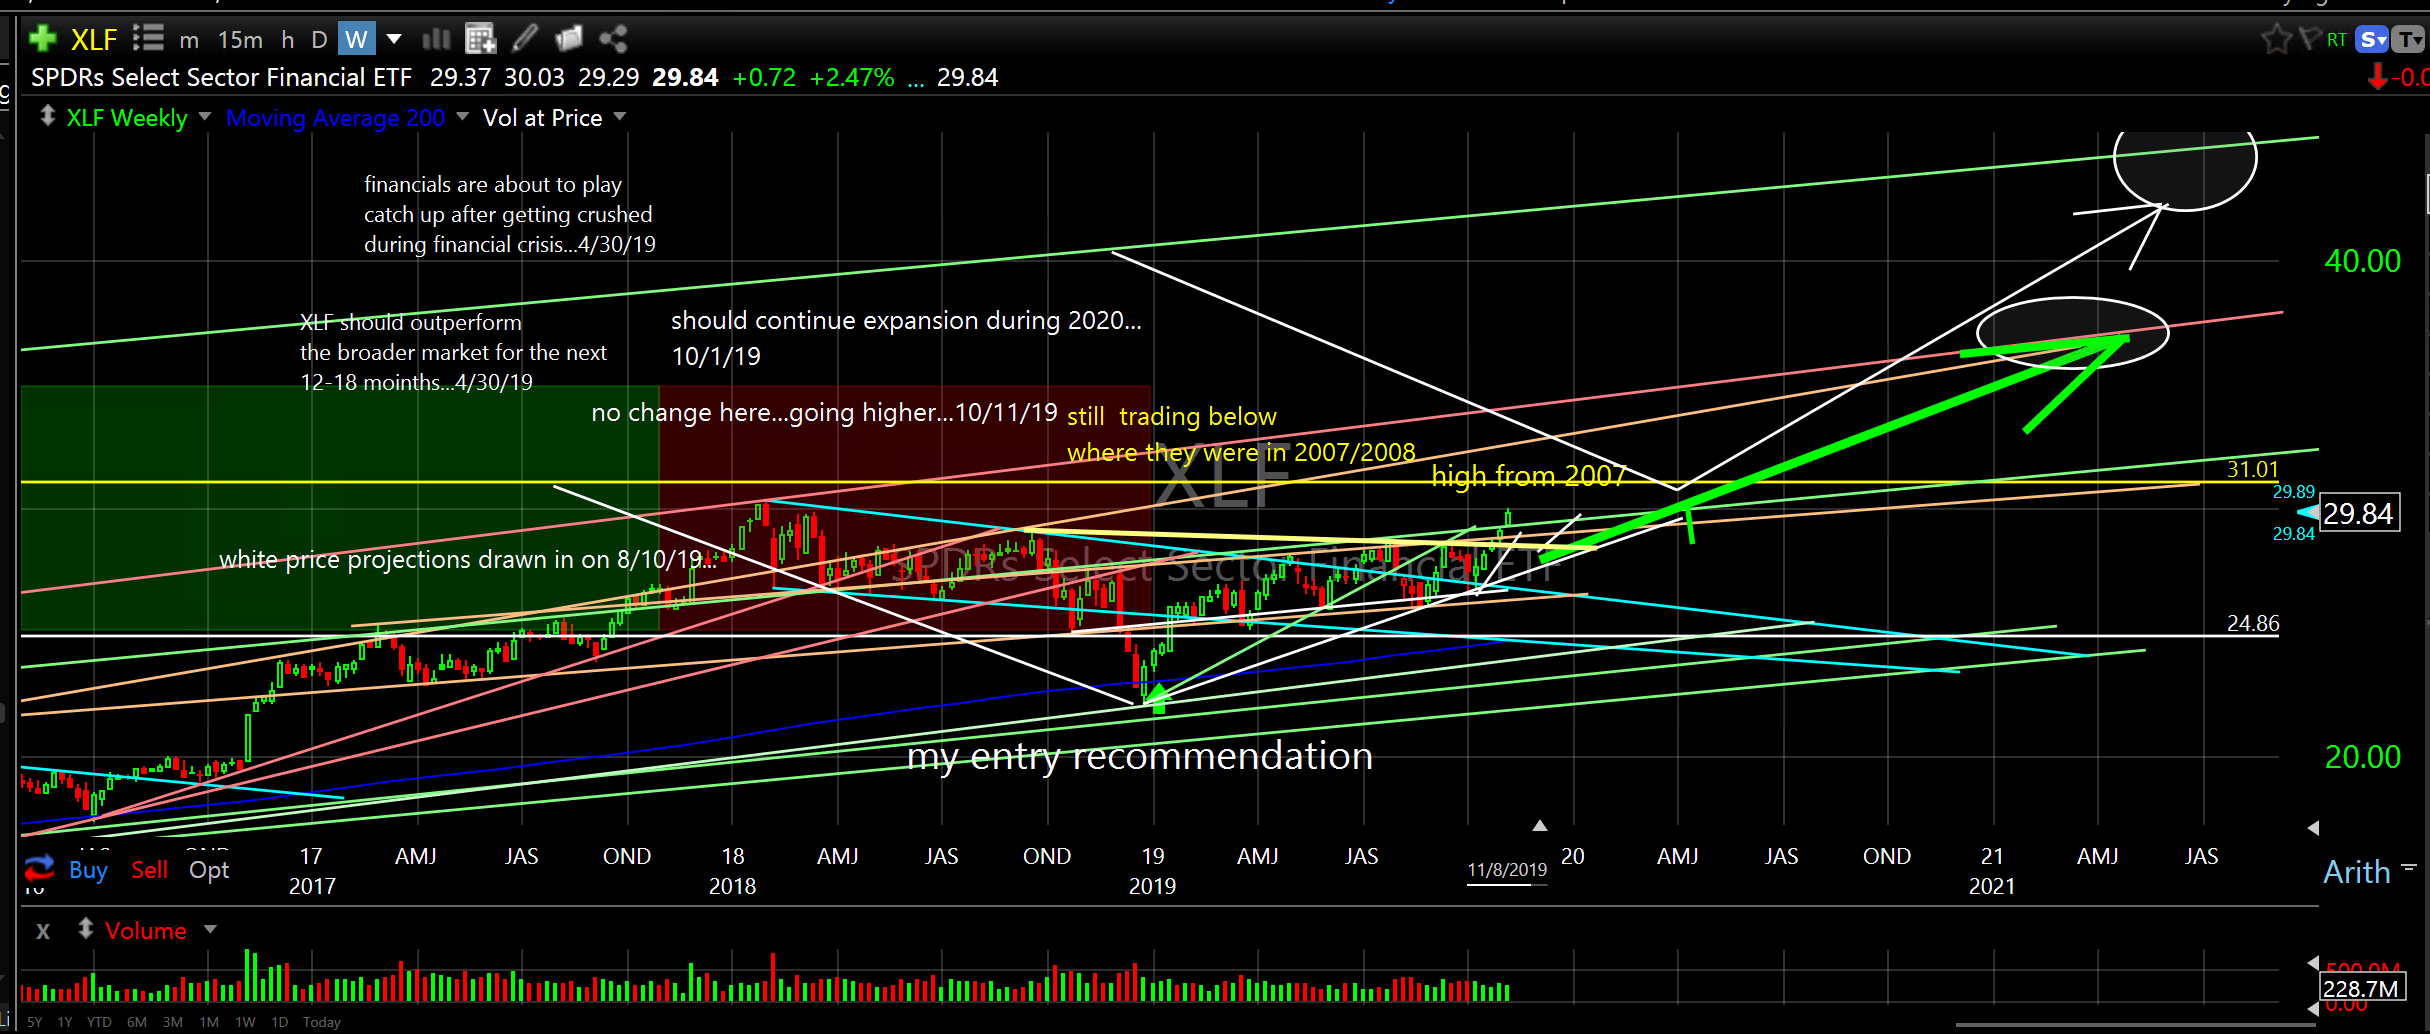
XLF
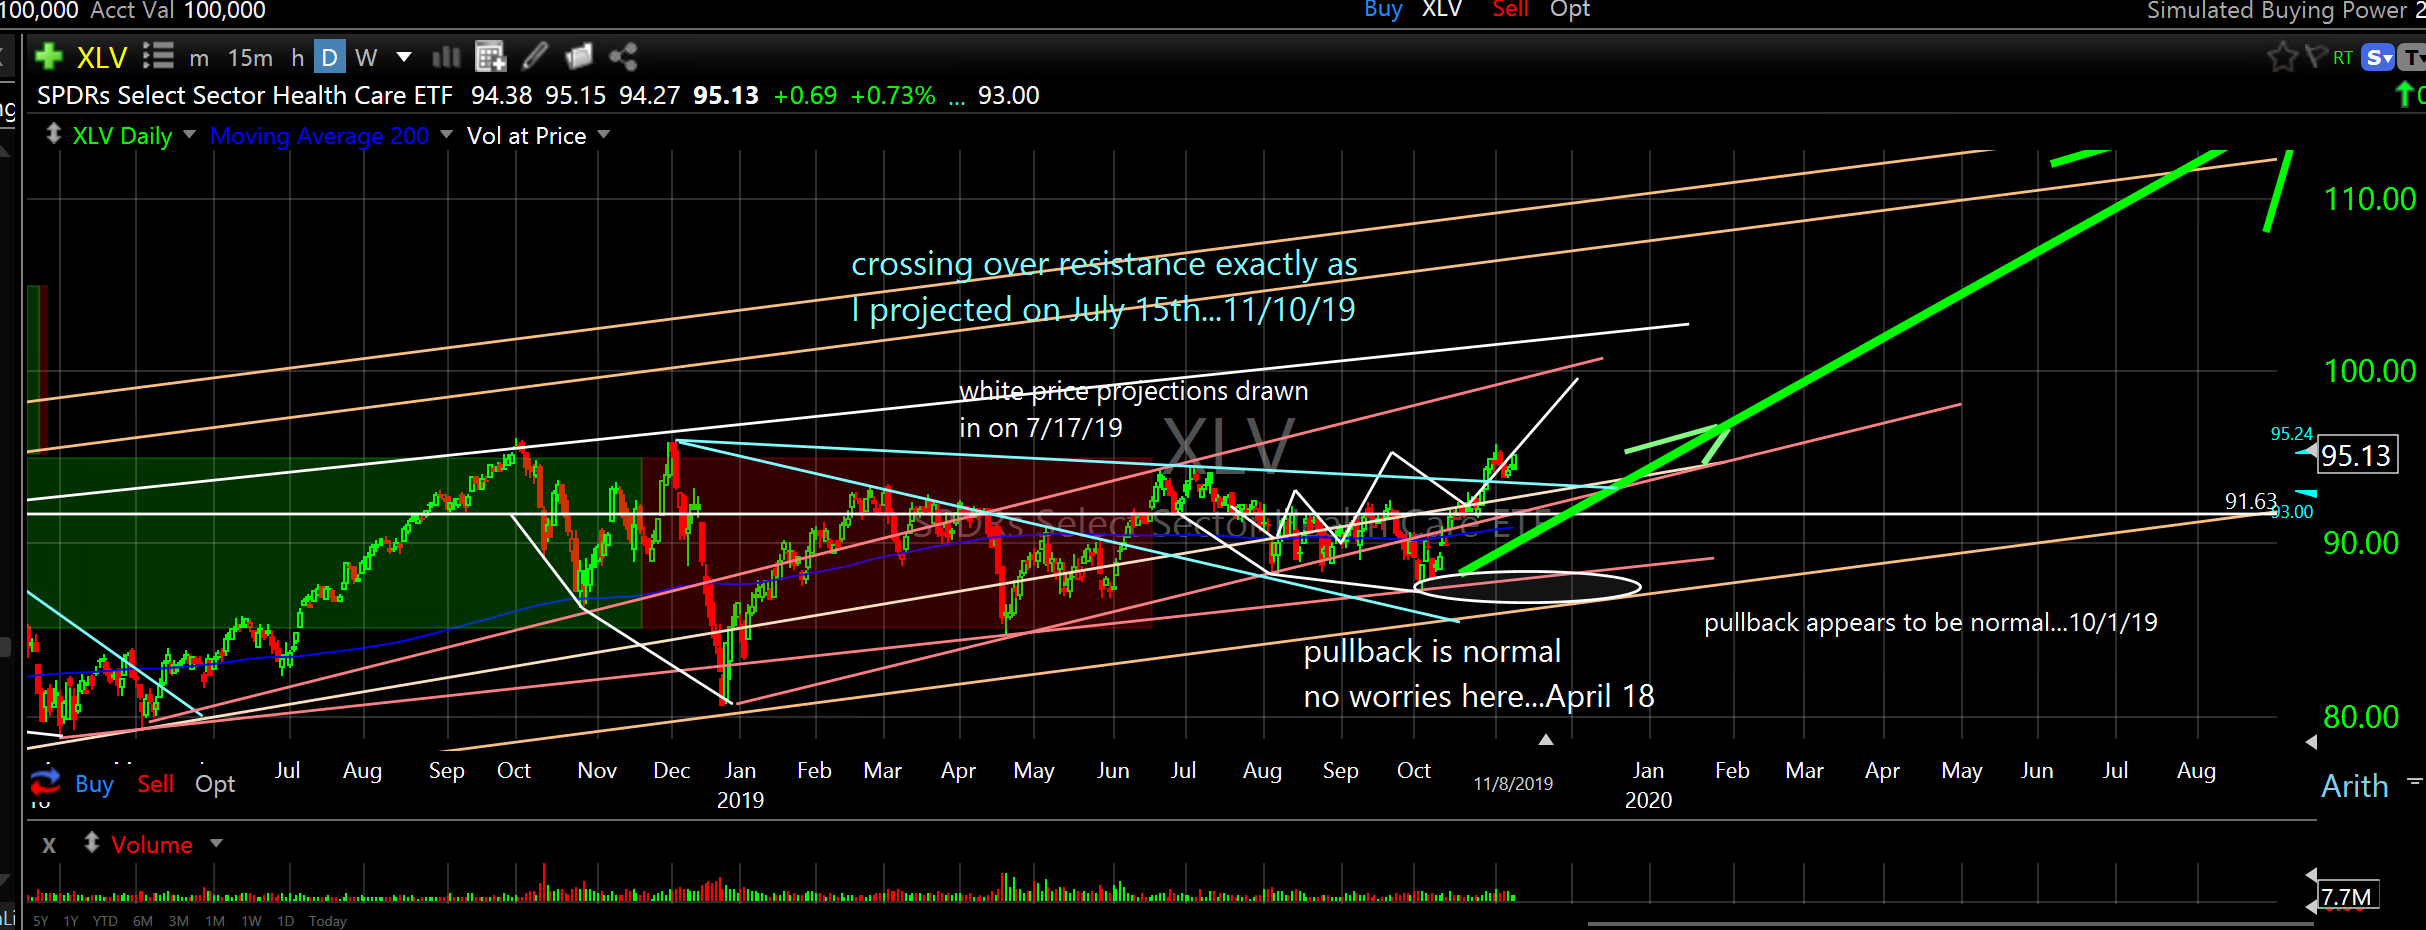
XLV
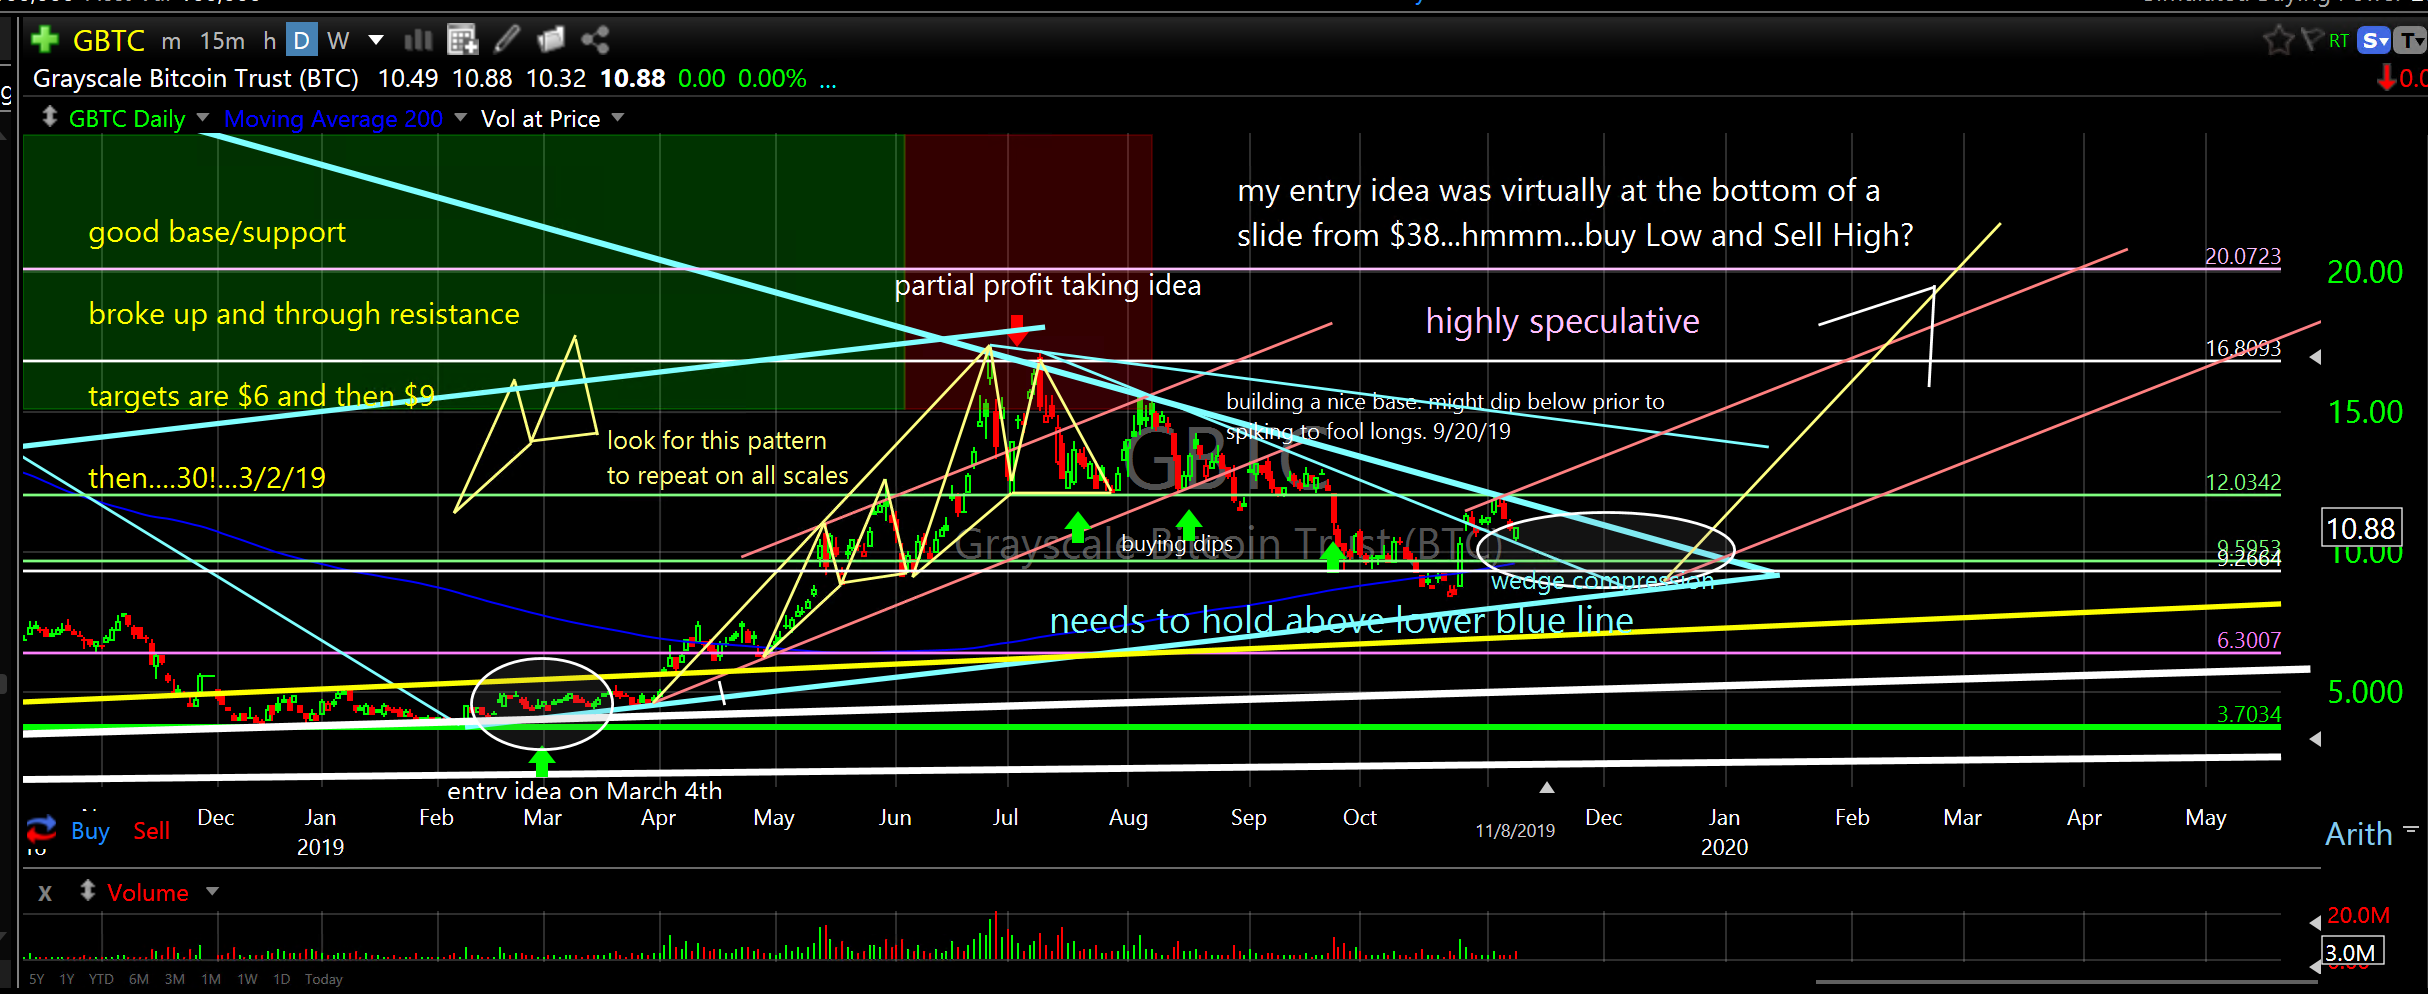
GBTC
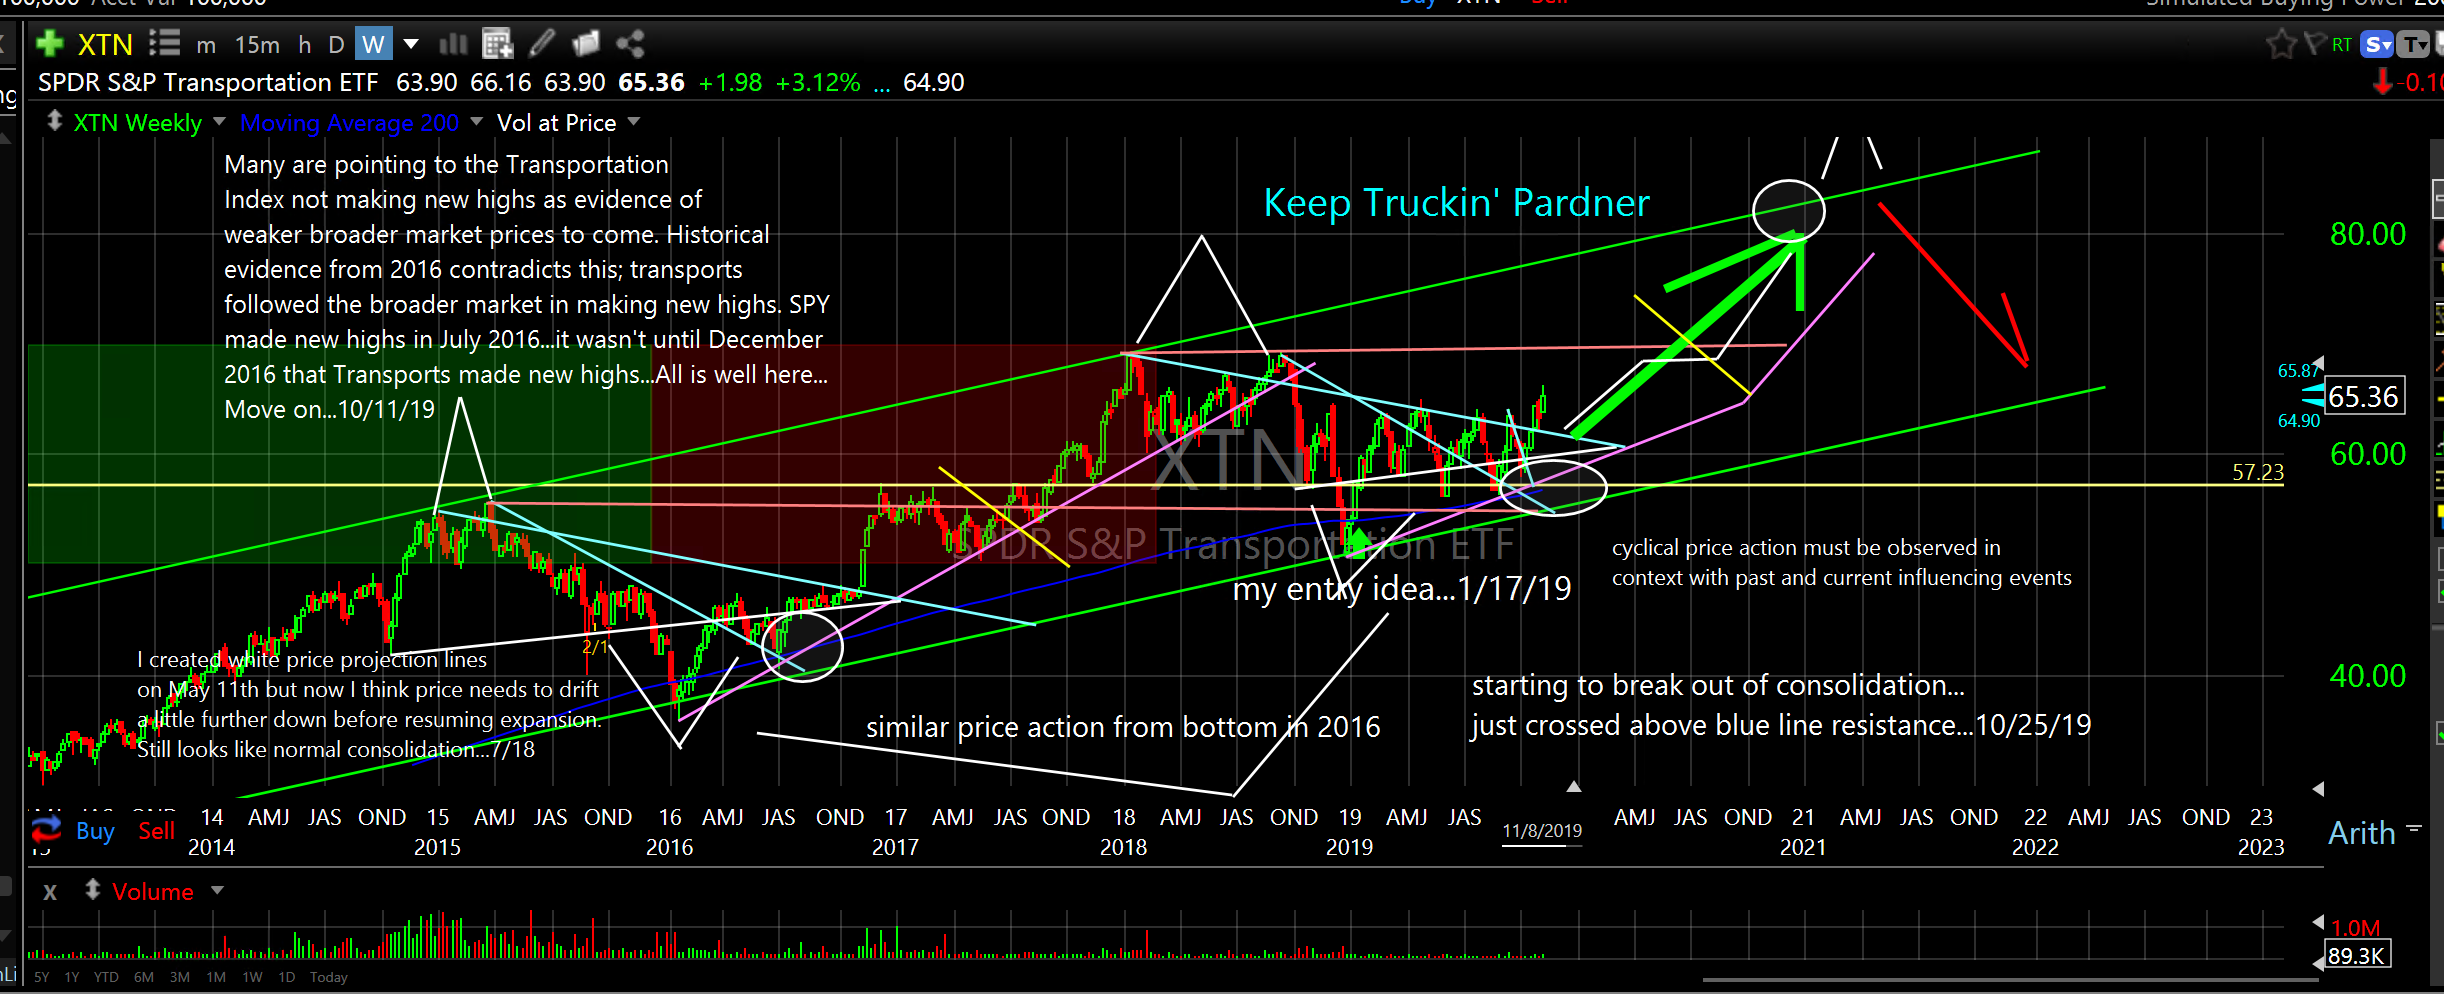
XTN
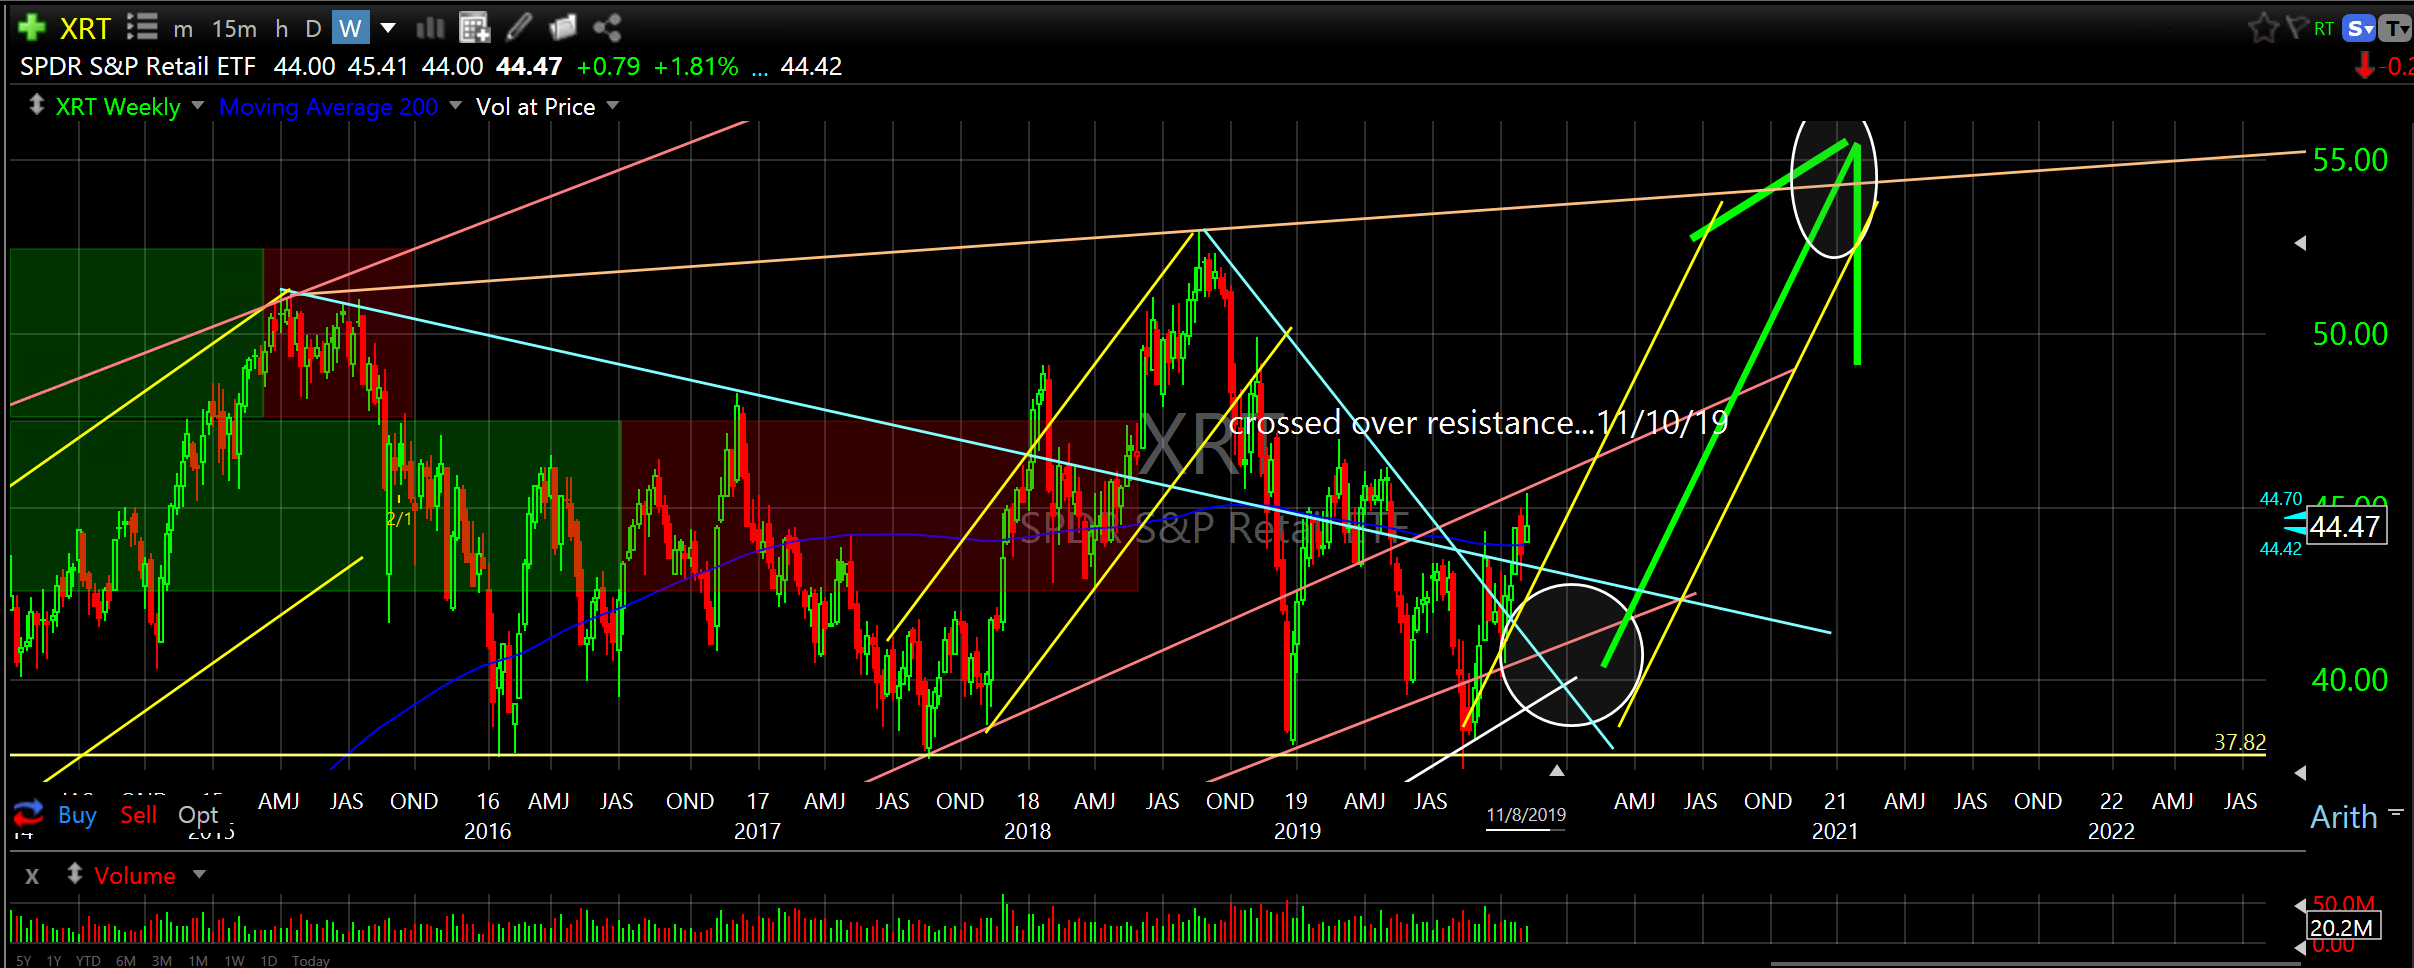
XRT
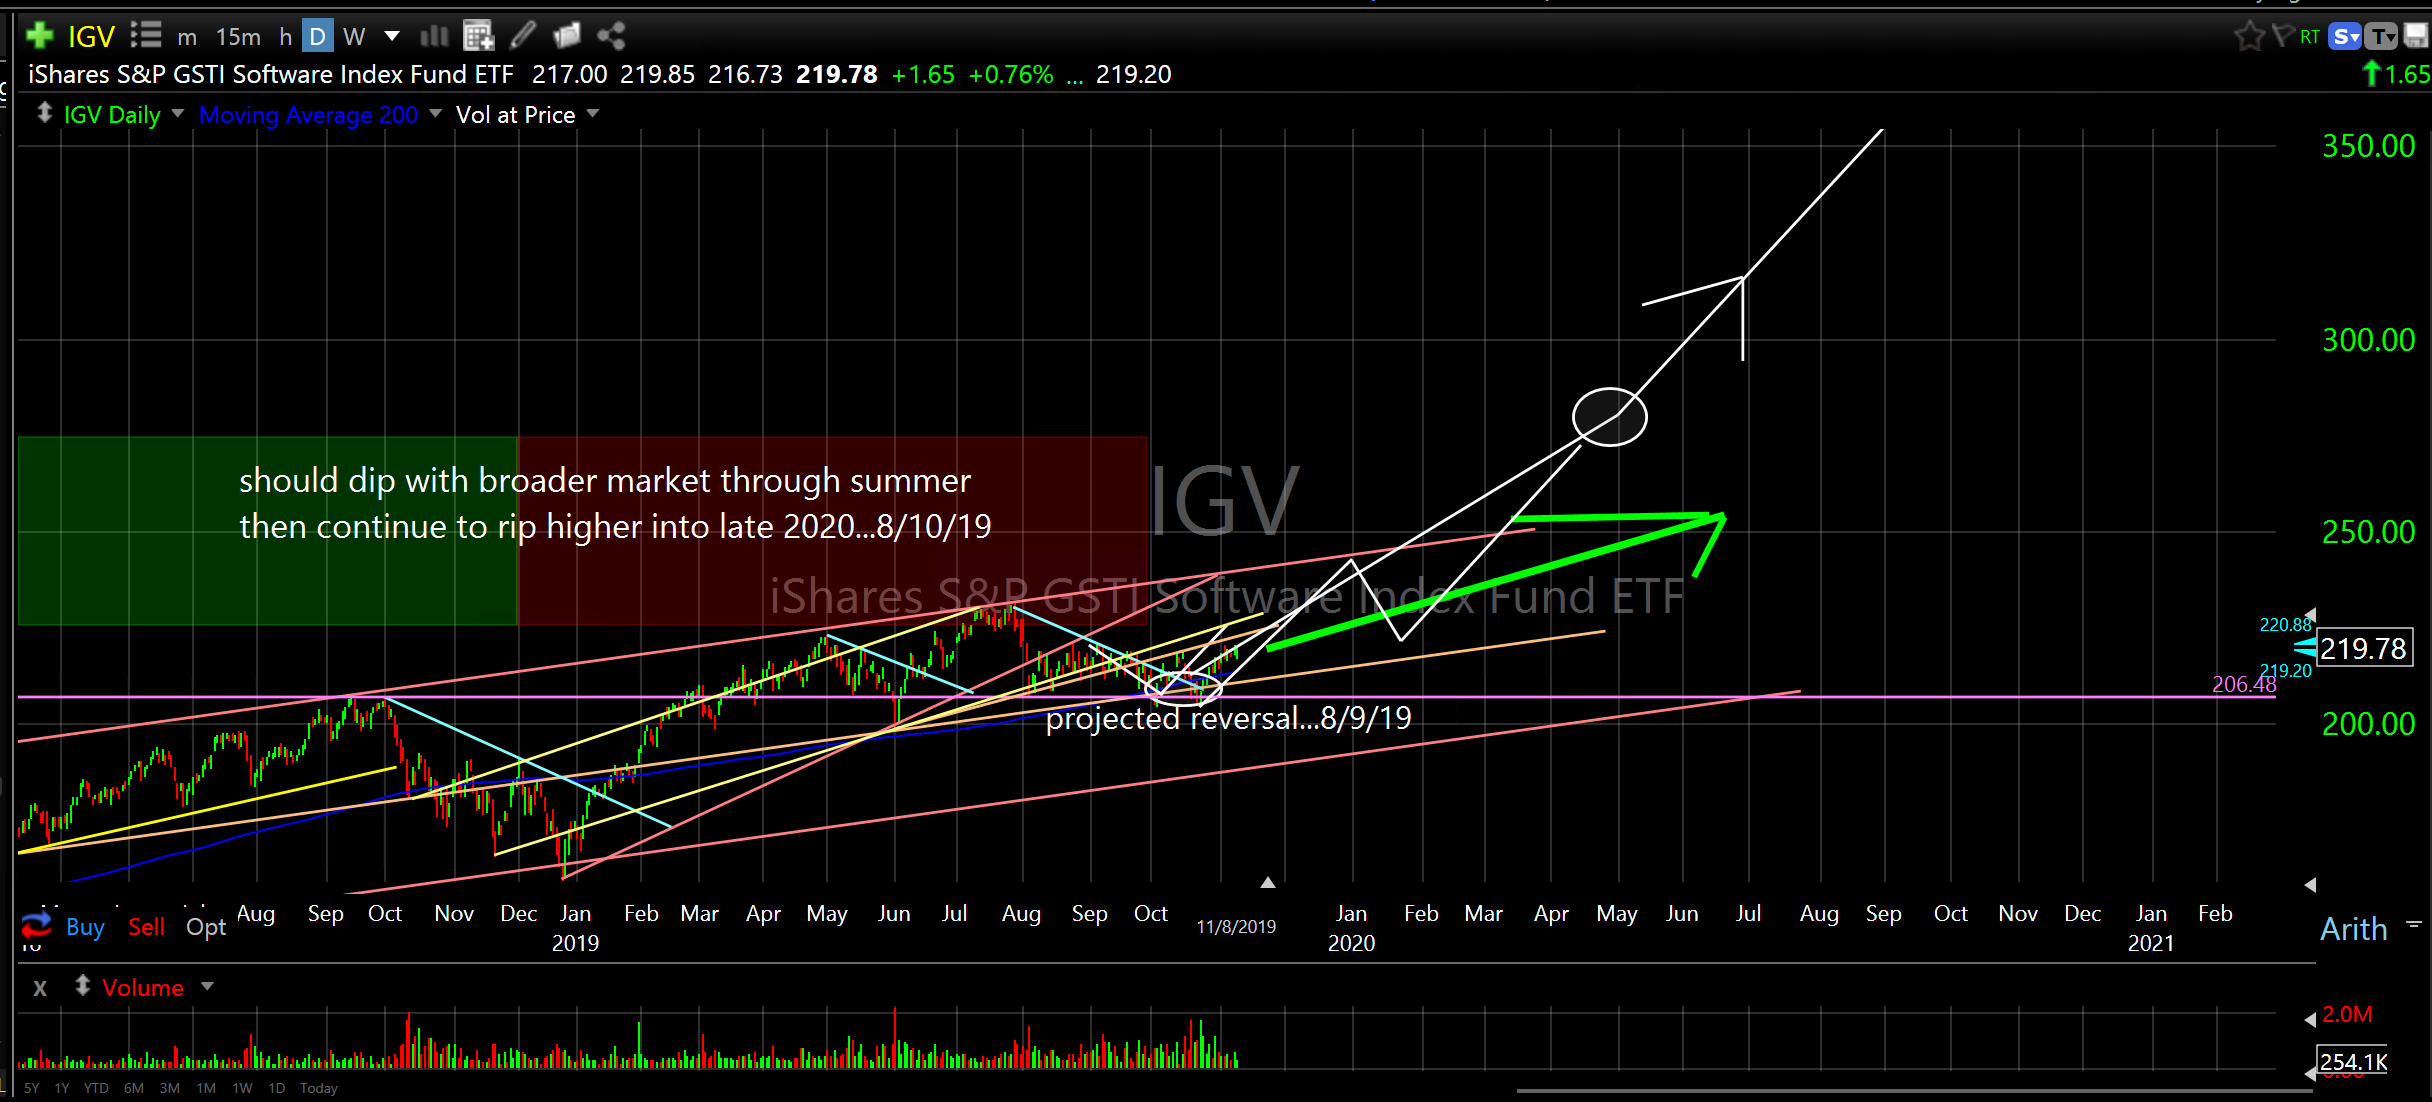
IGV
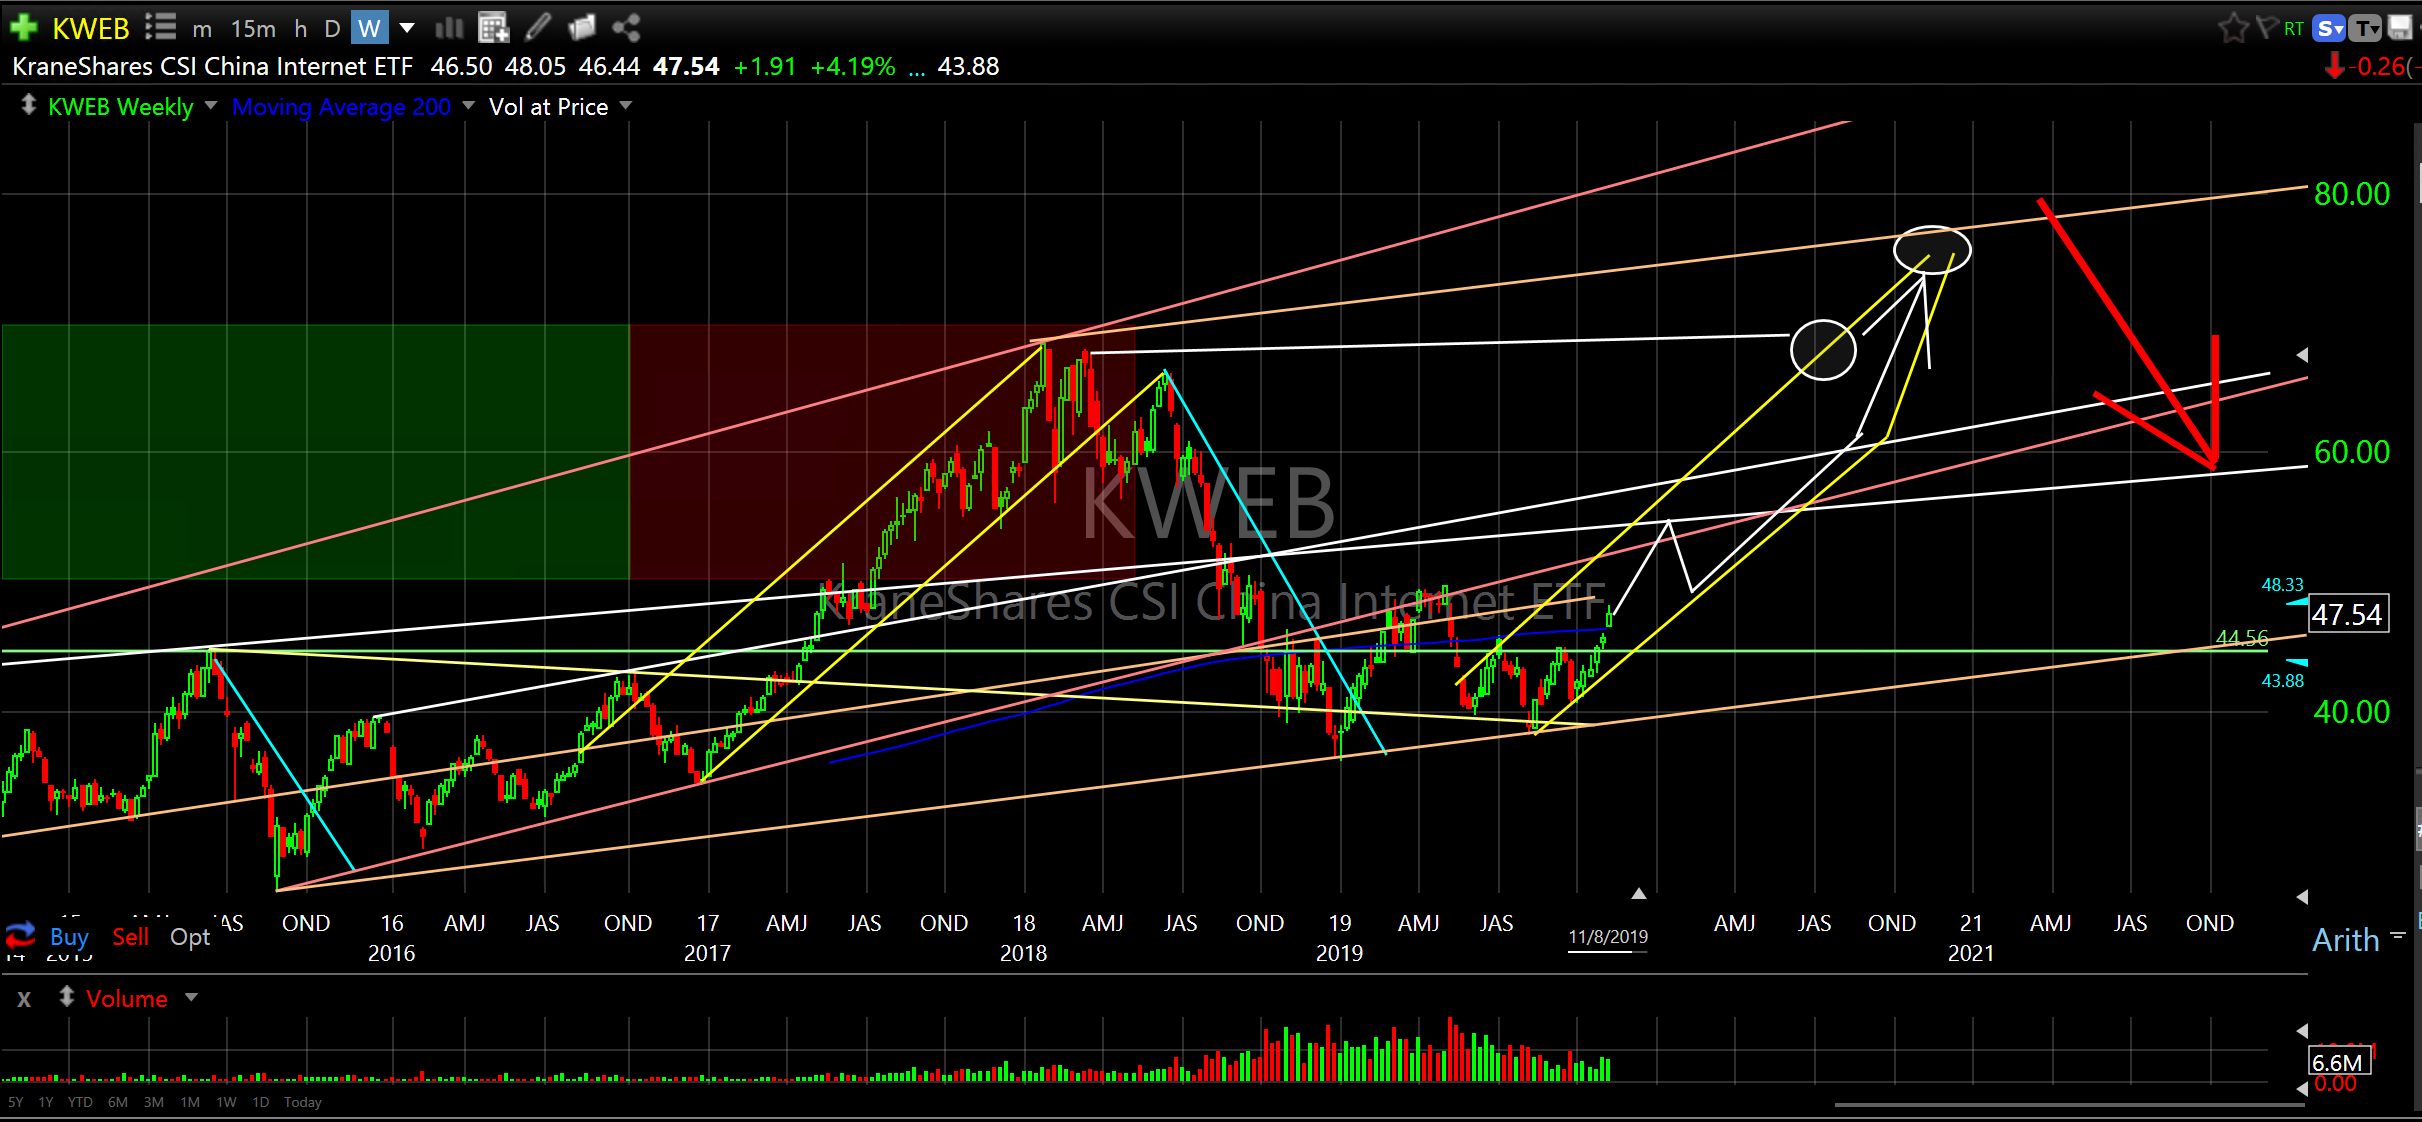
KWEB
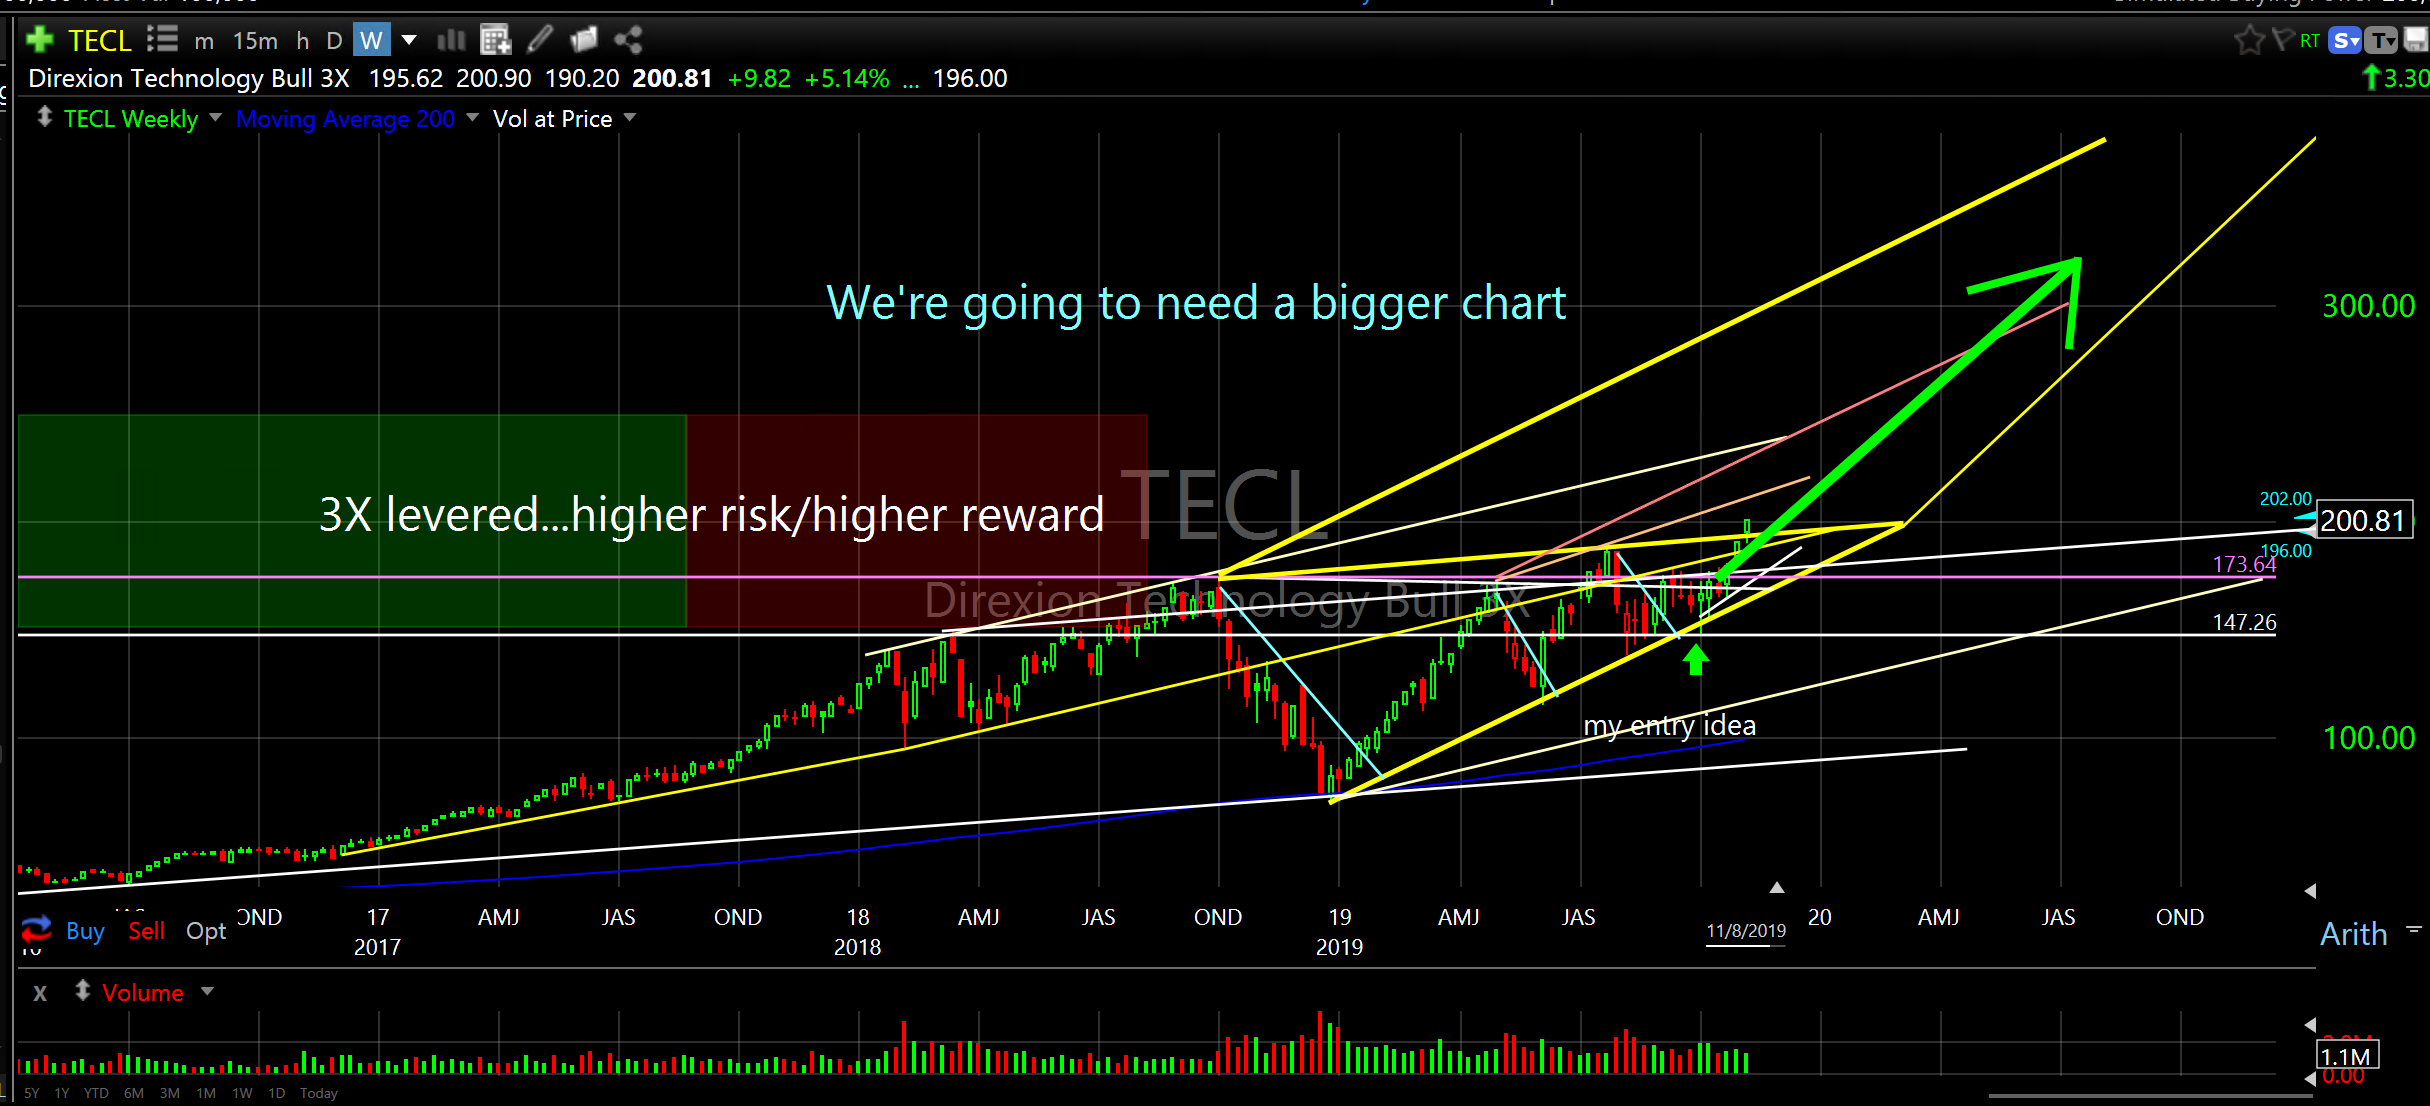
TECL
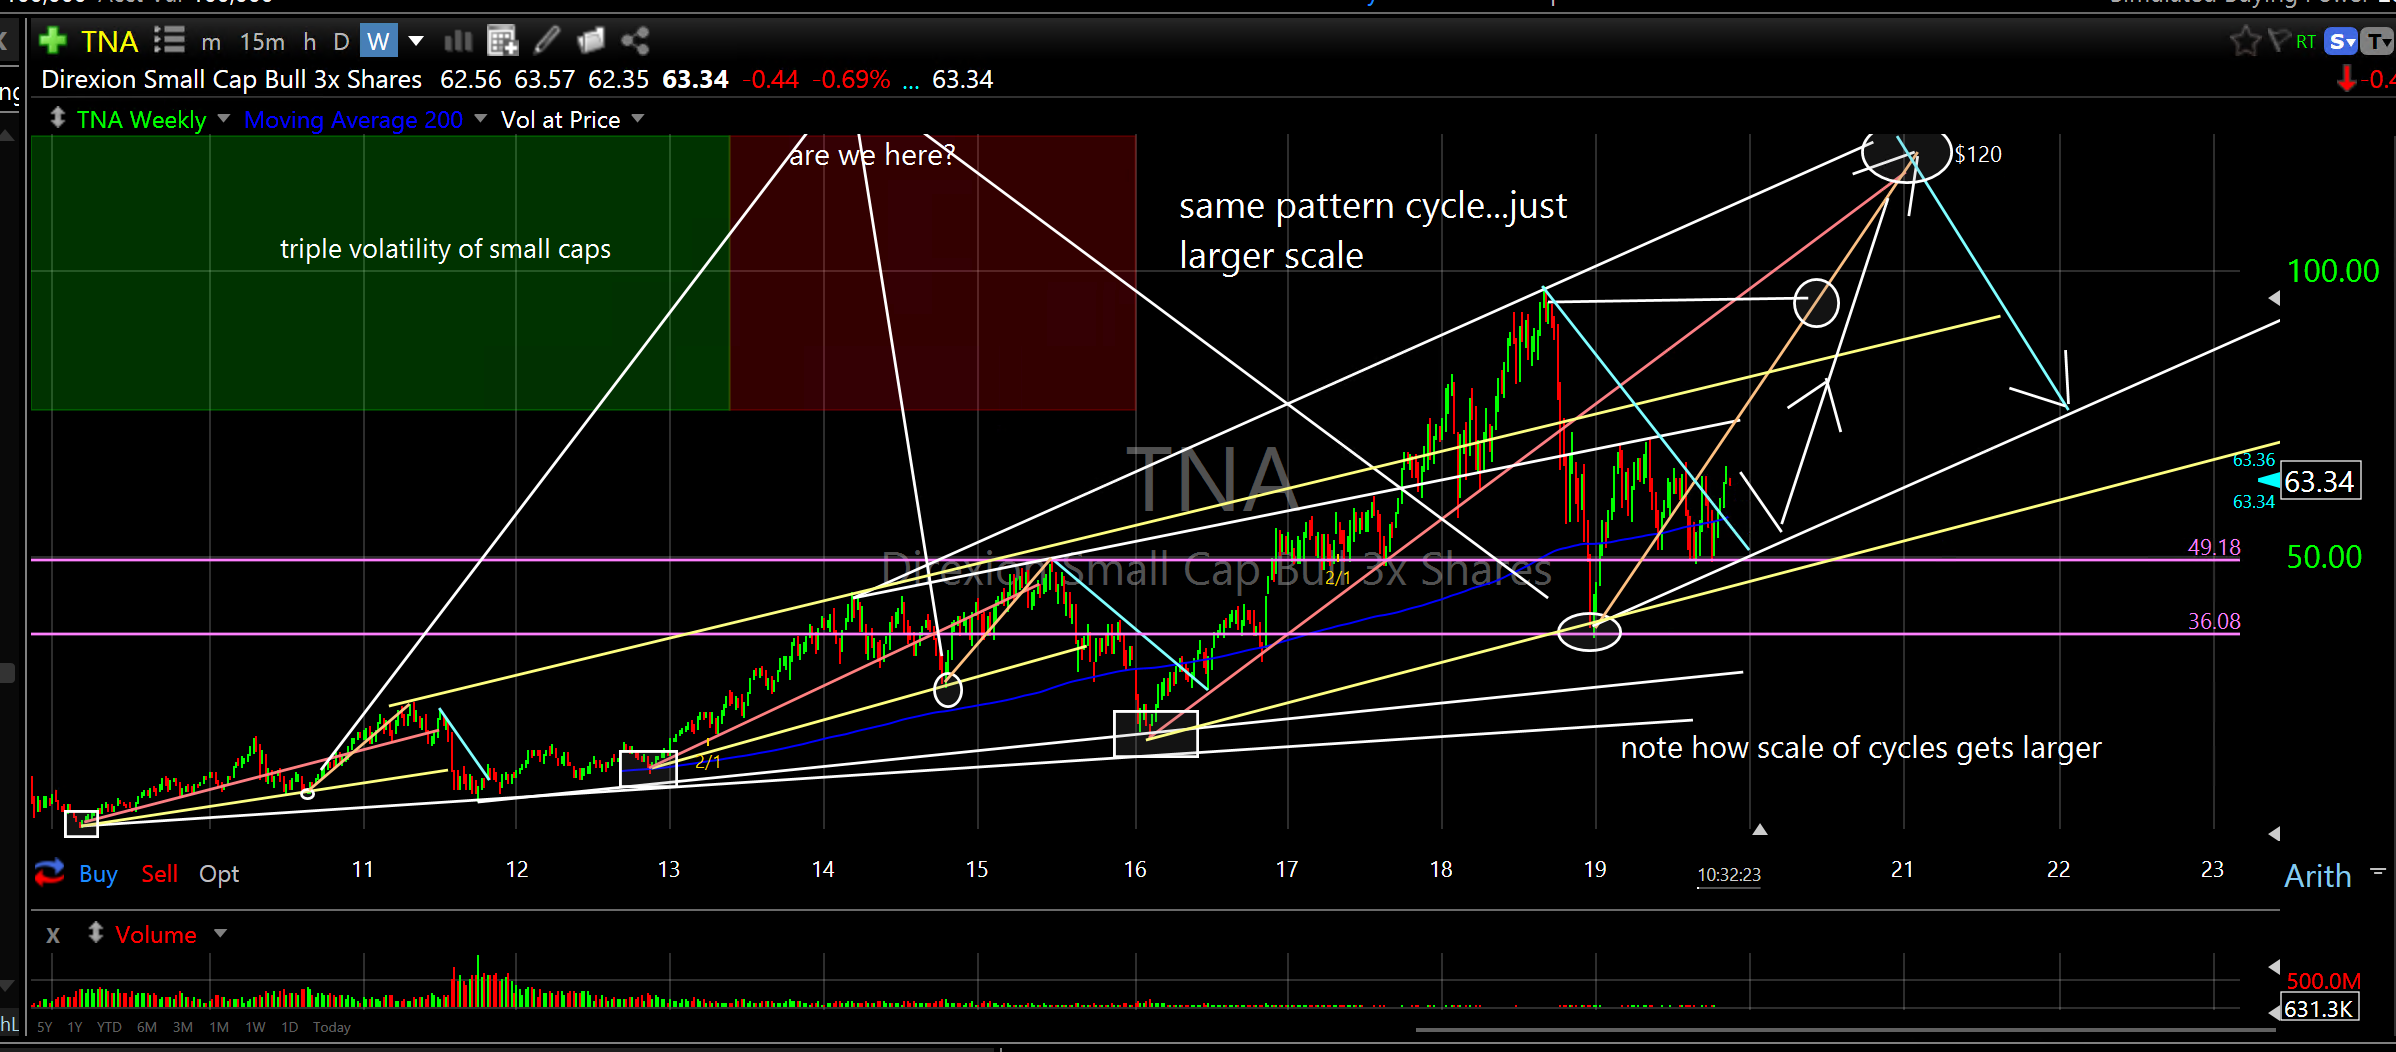
TNA
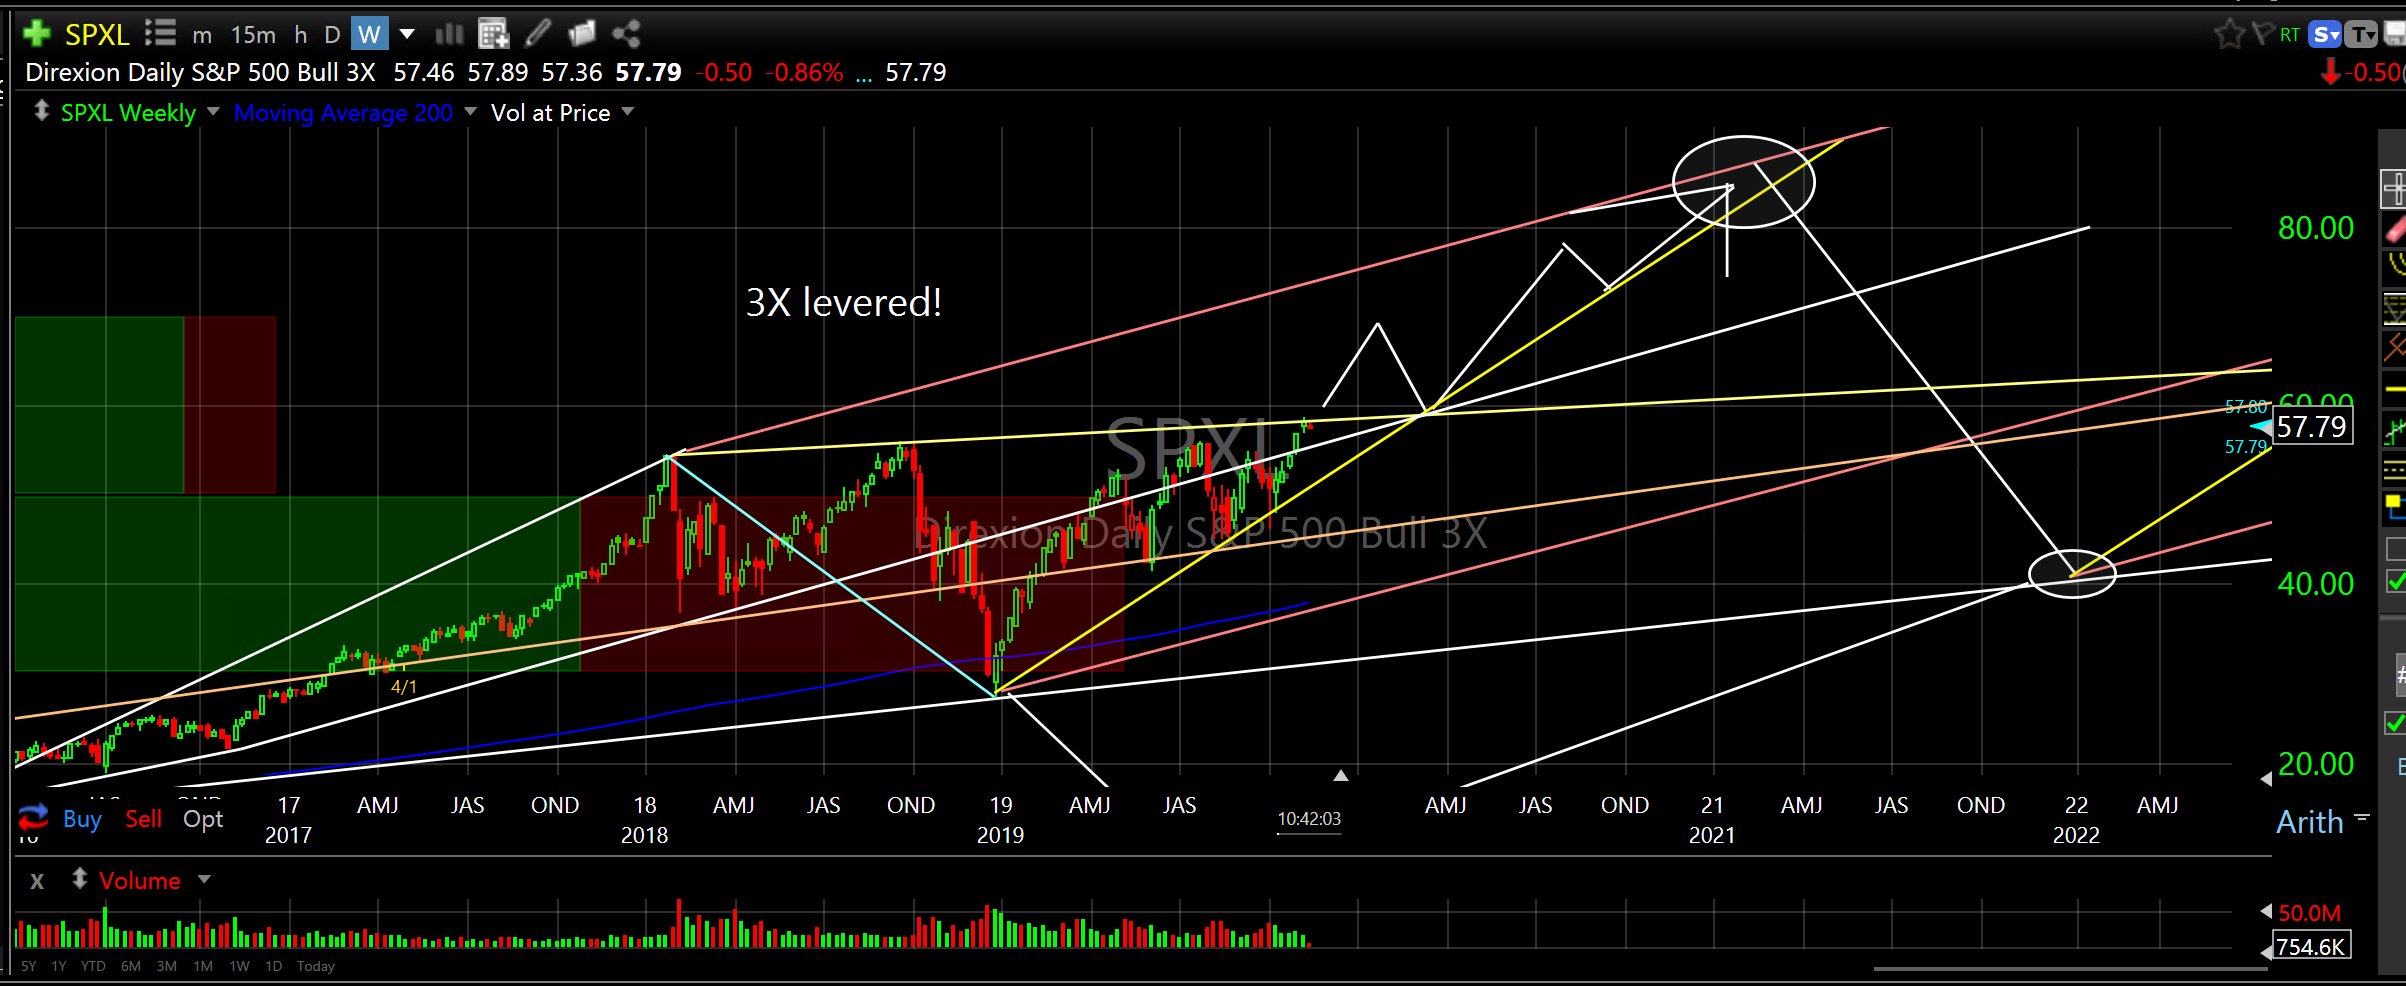
SPXL
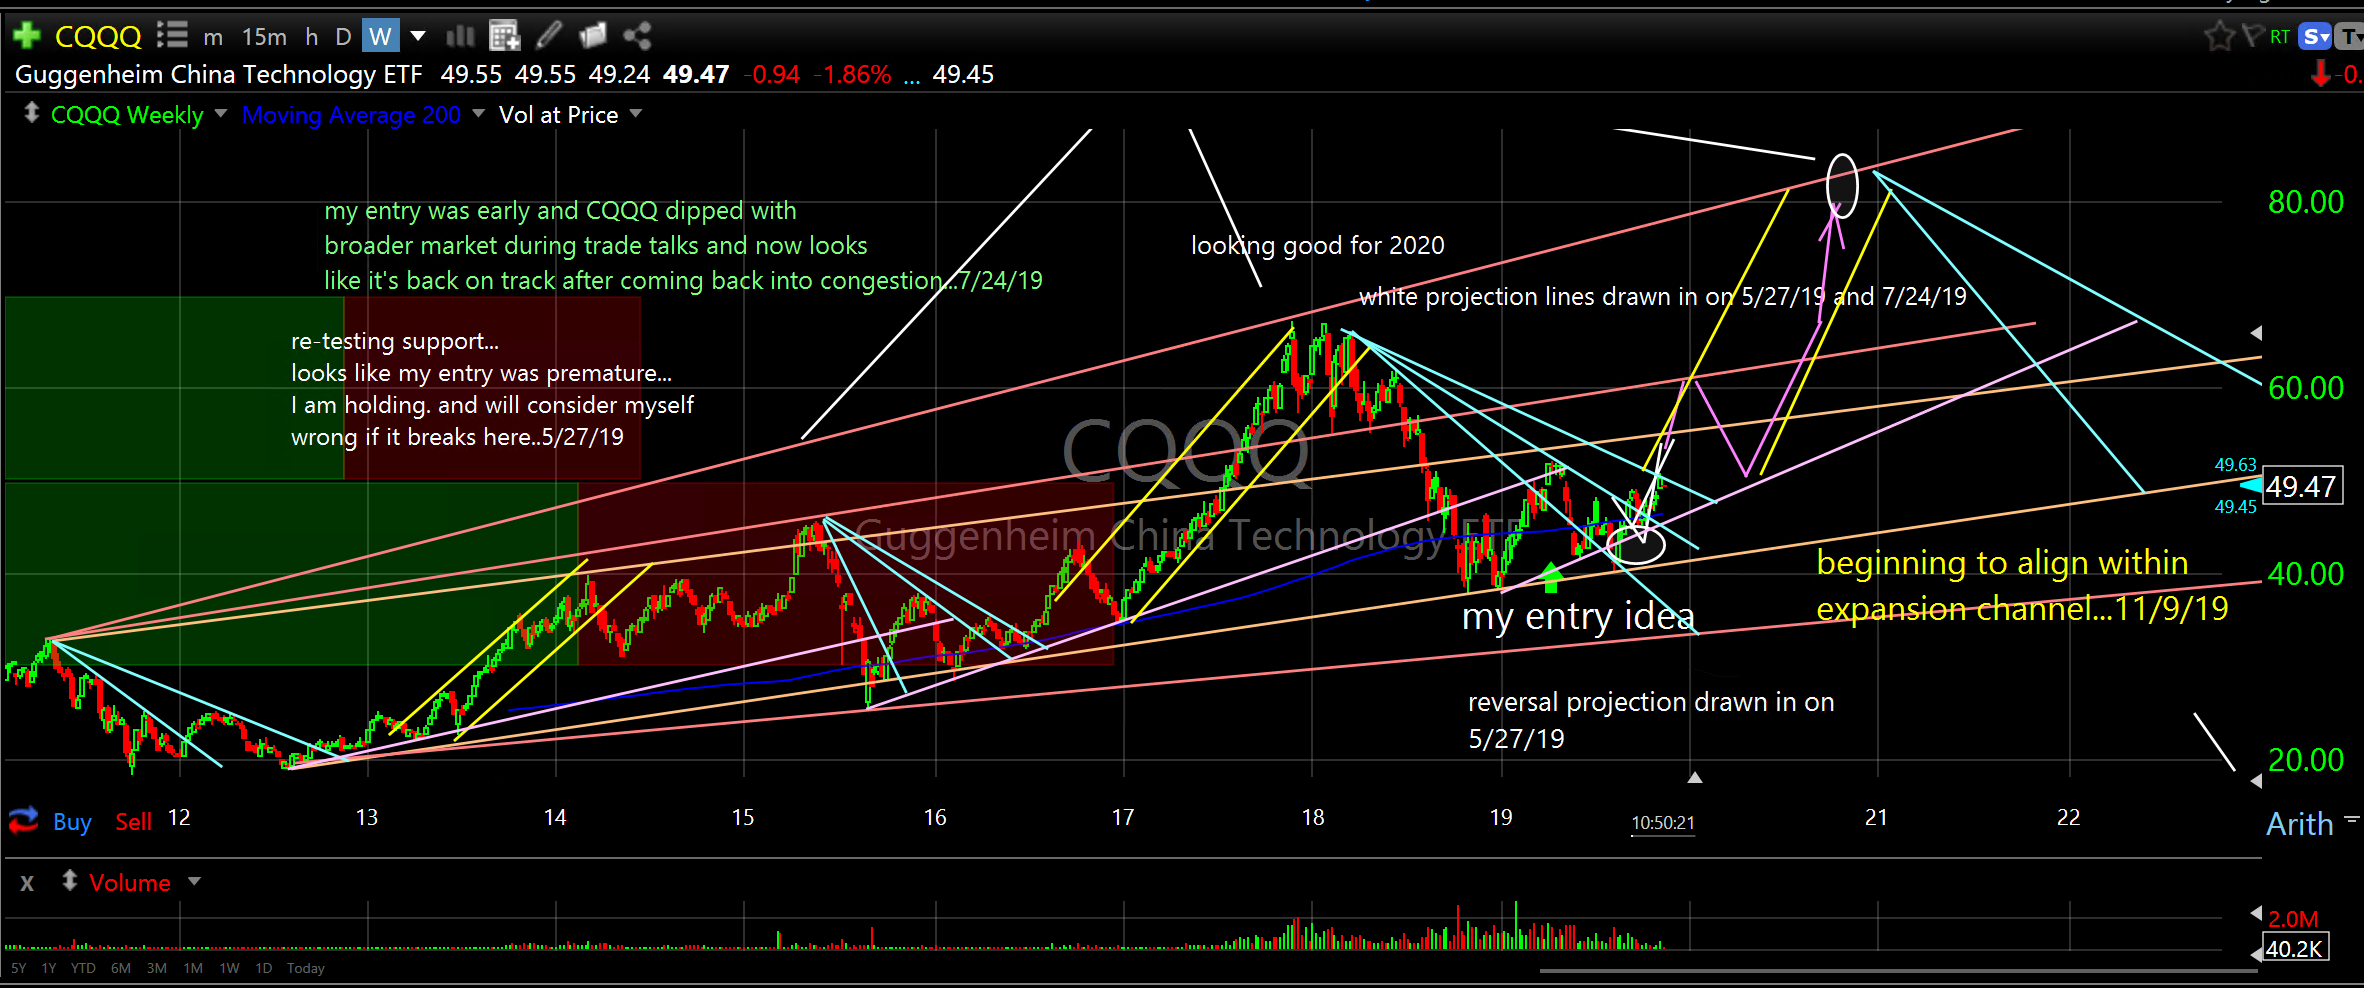
CQQQ
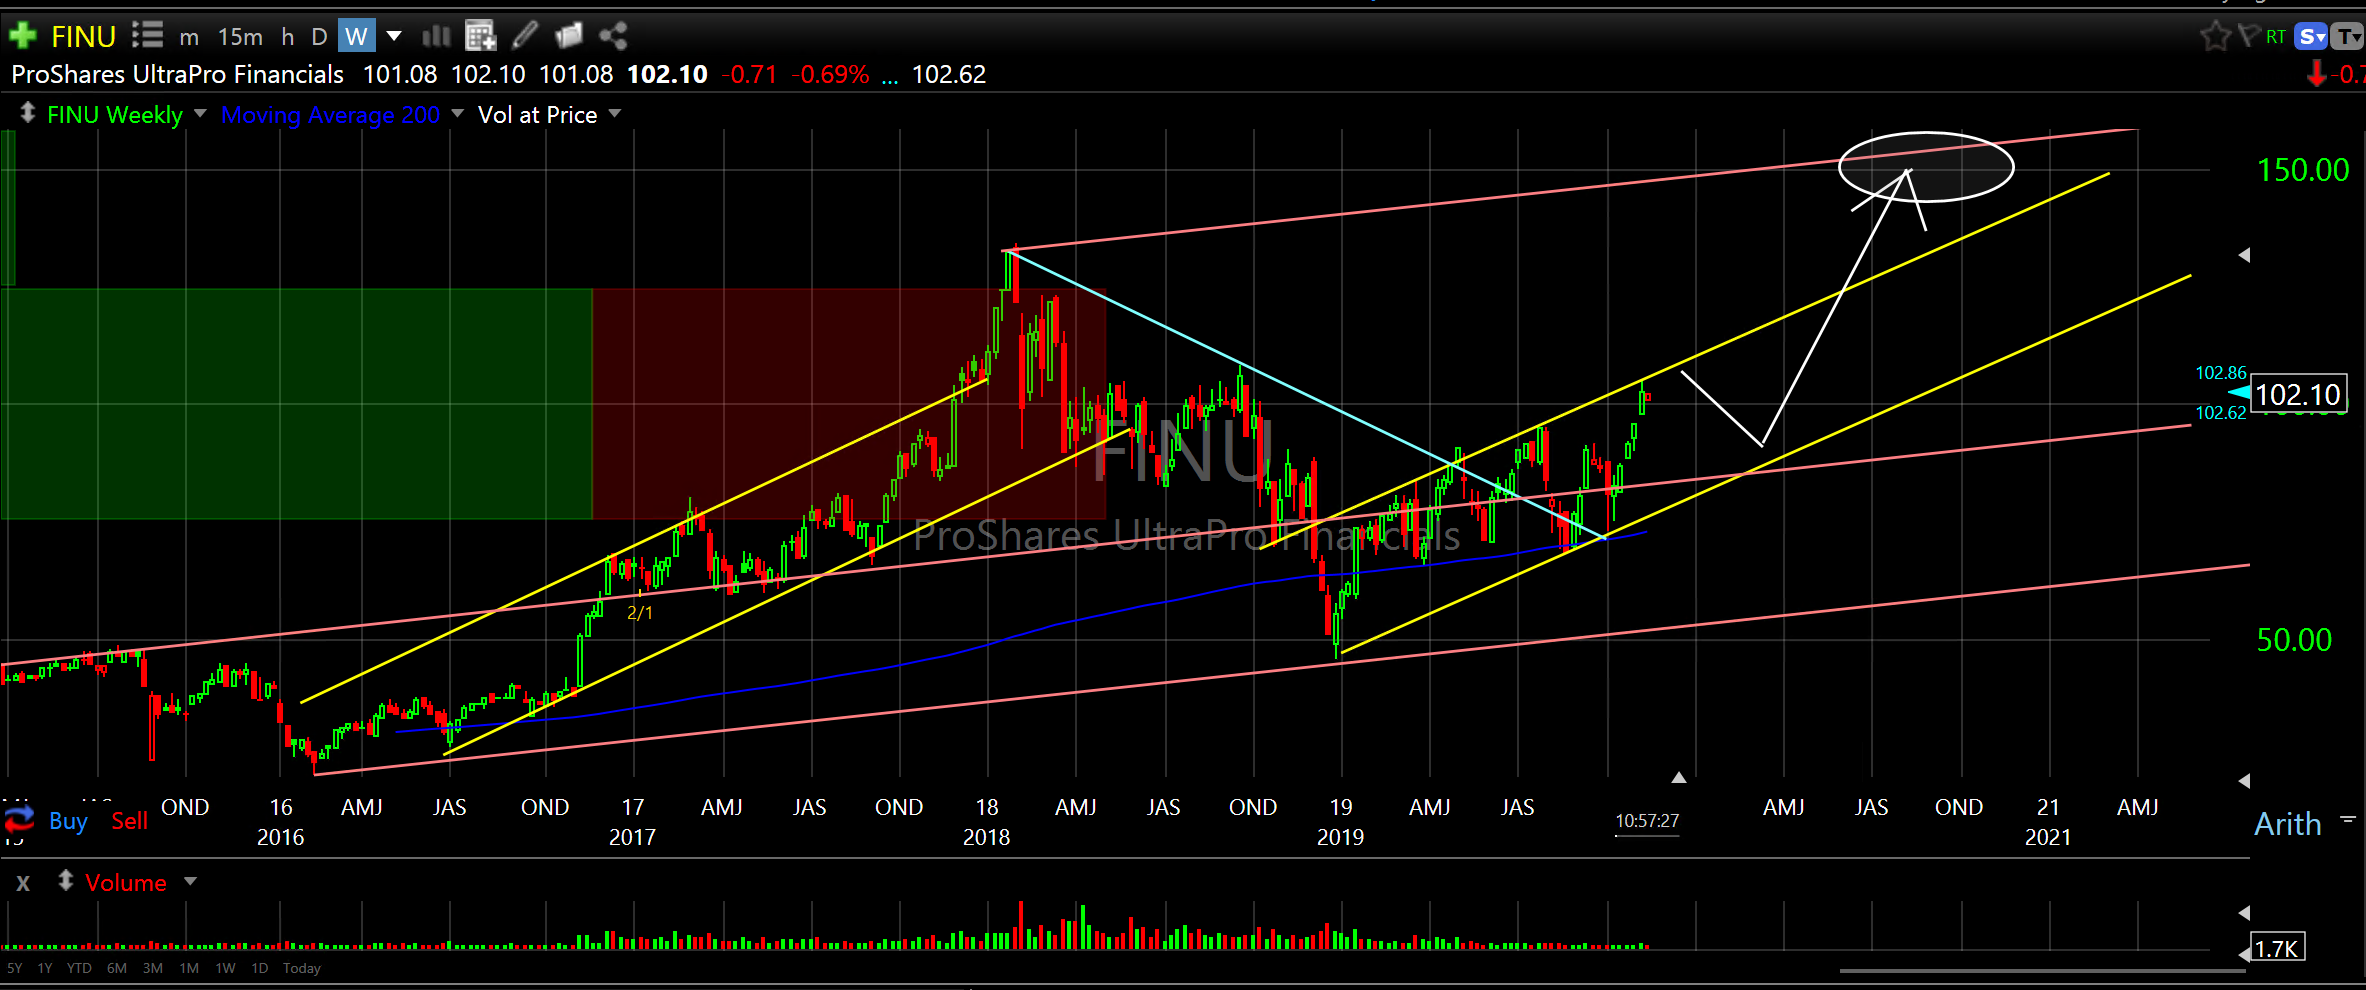
FINU
SOXL
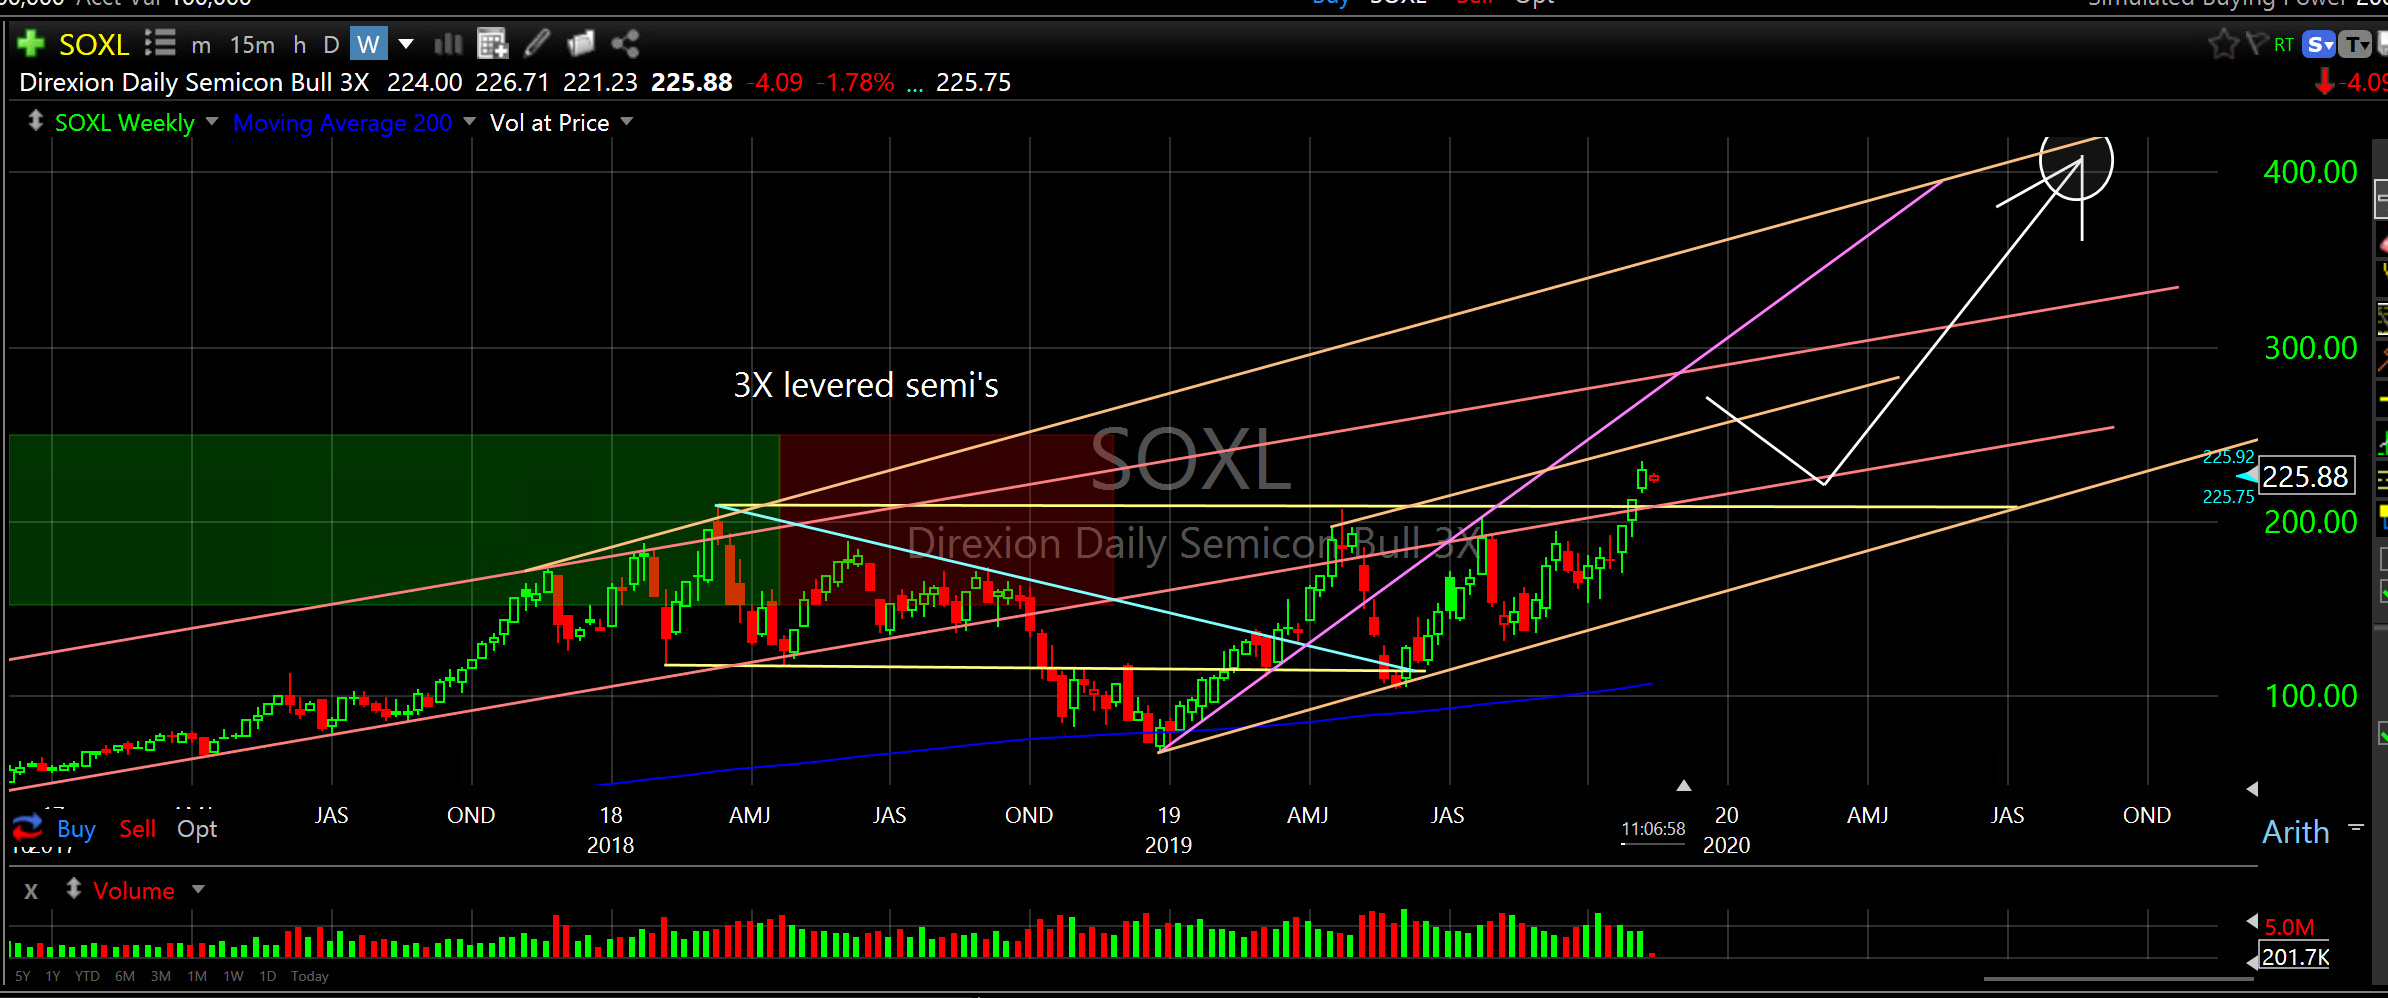
PSJ
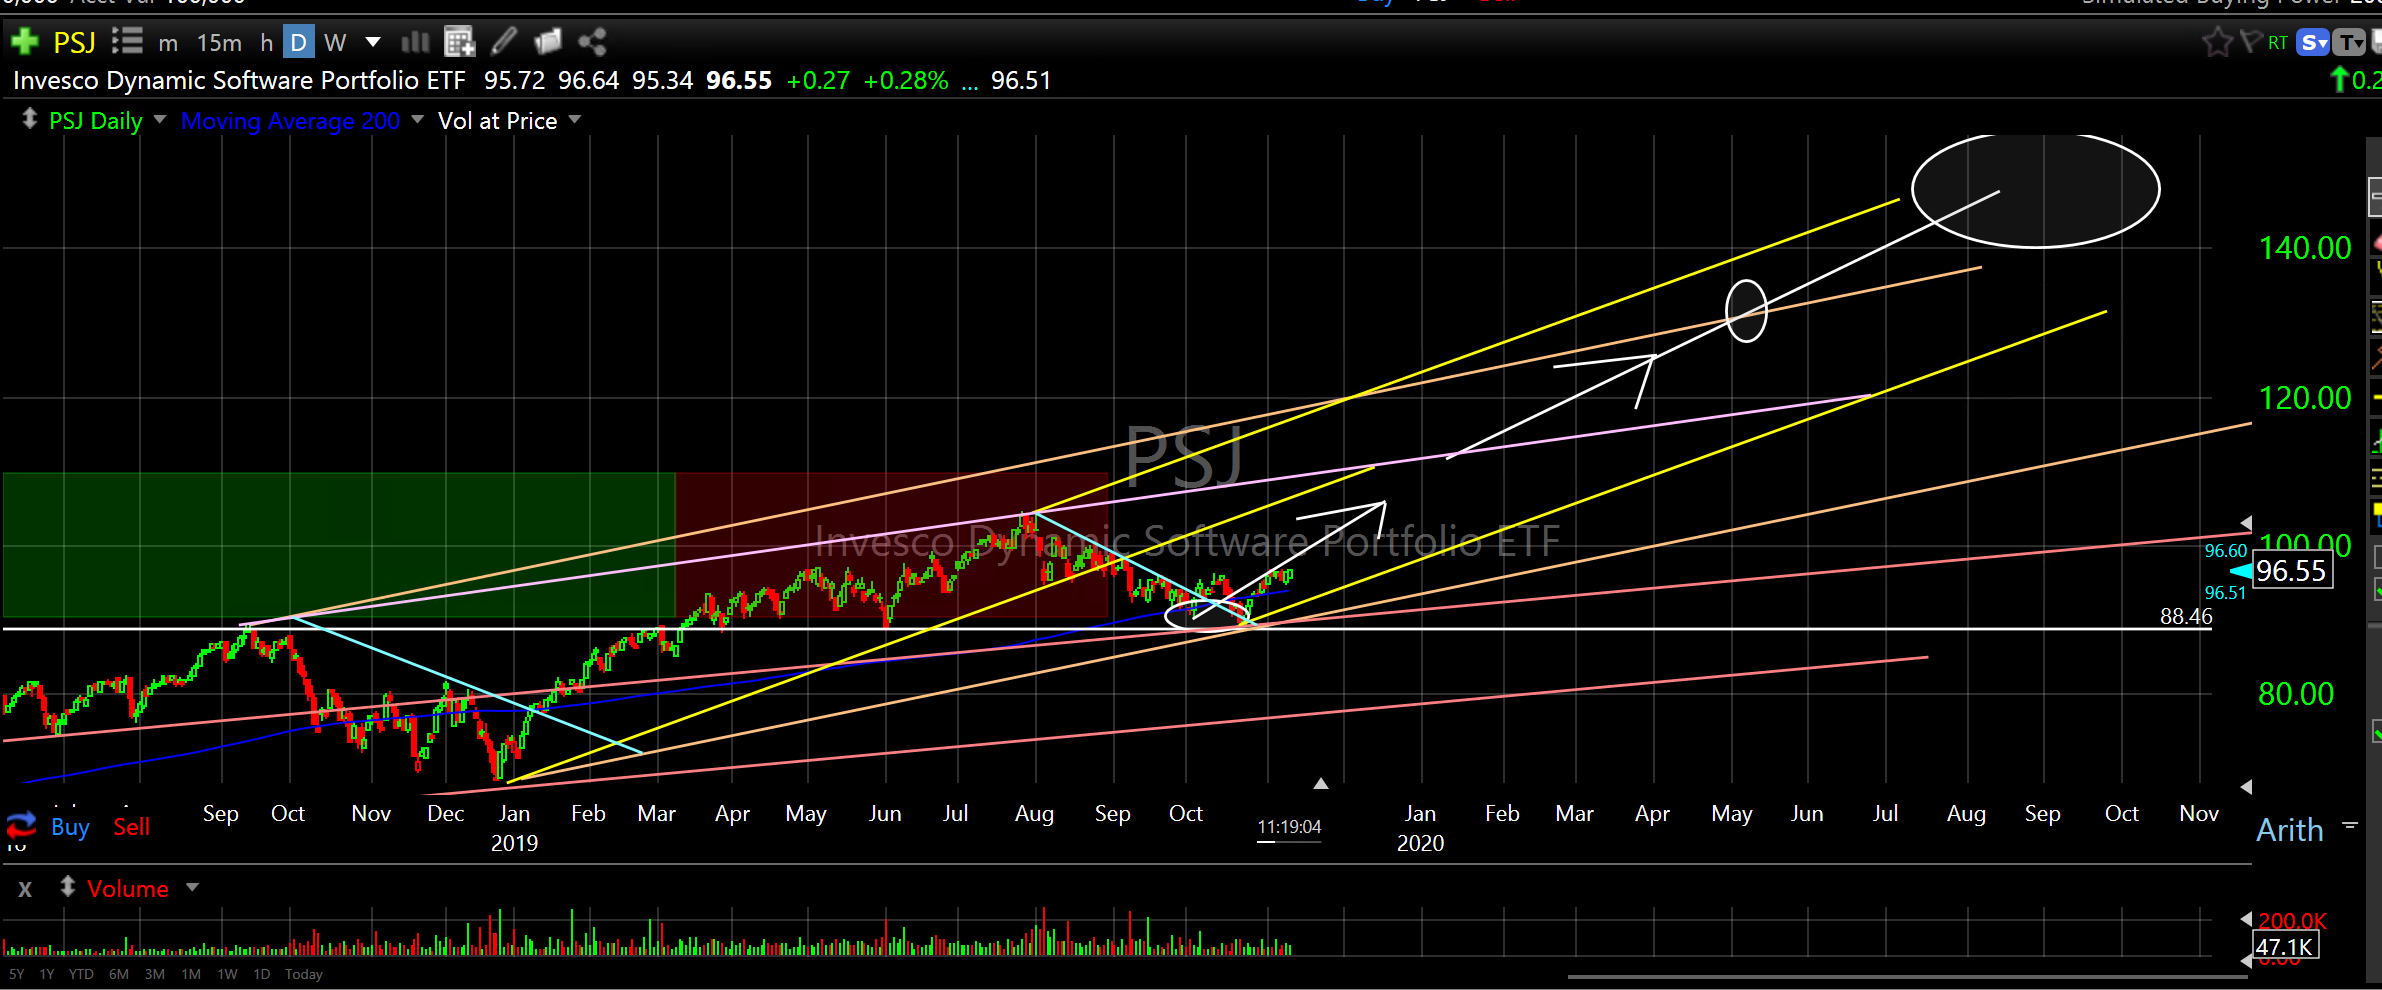
IBB
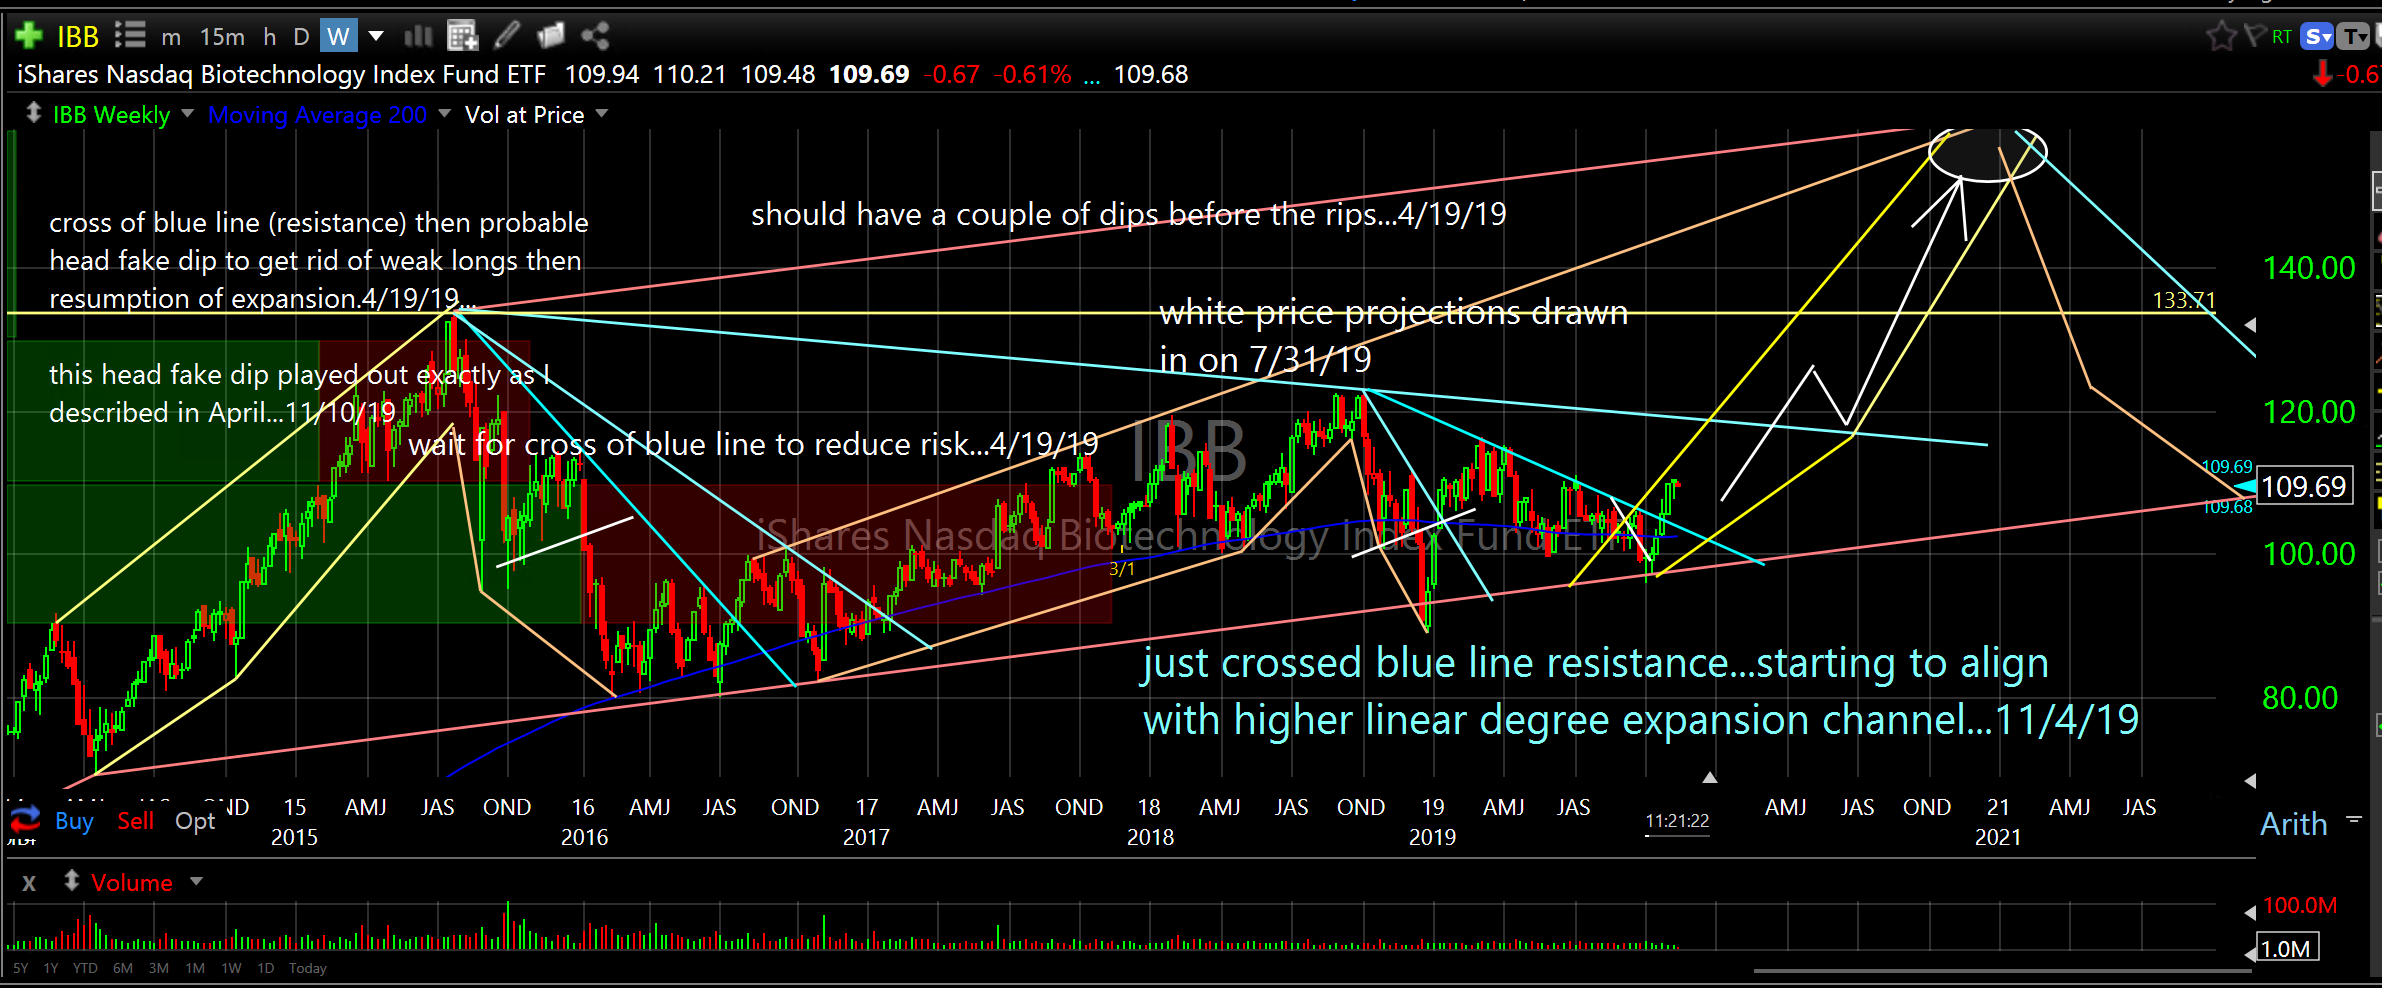
EWJ
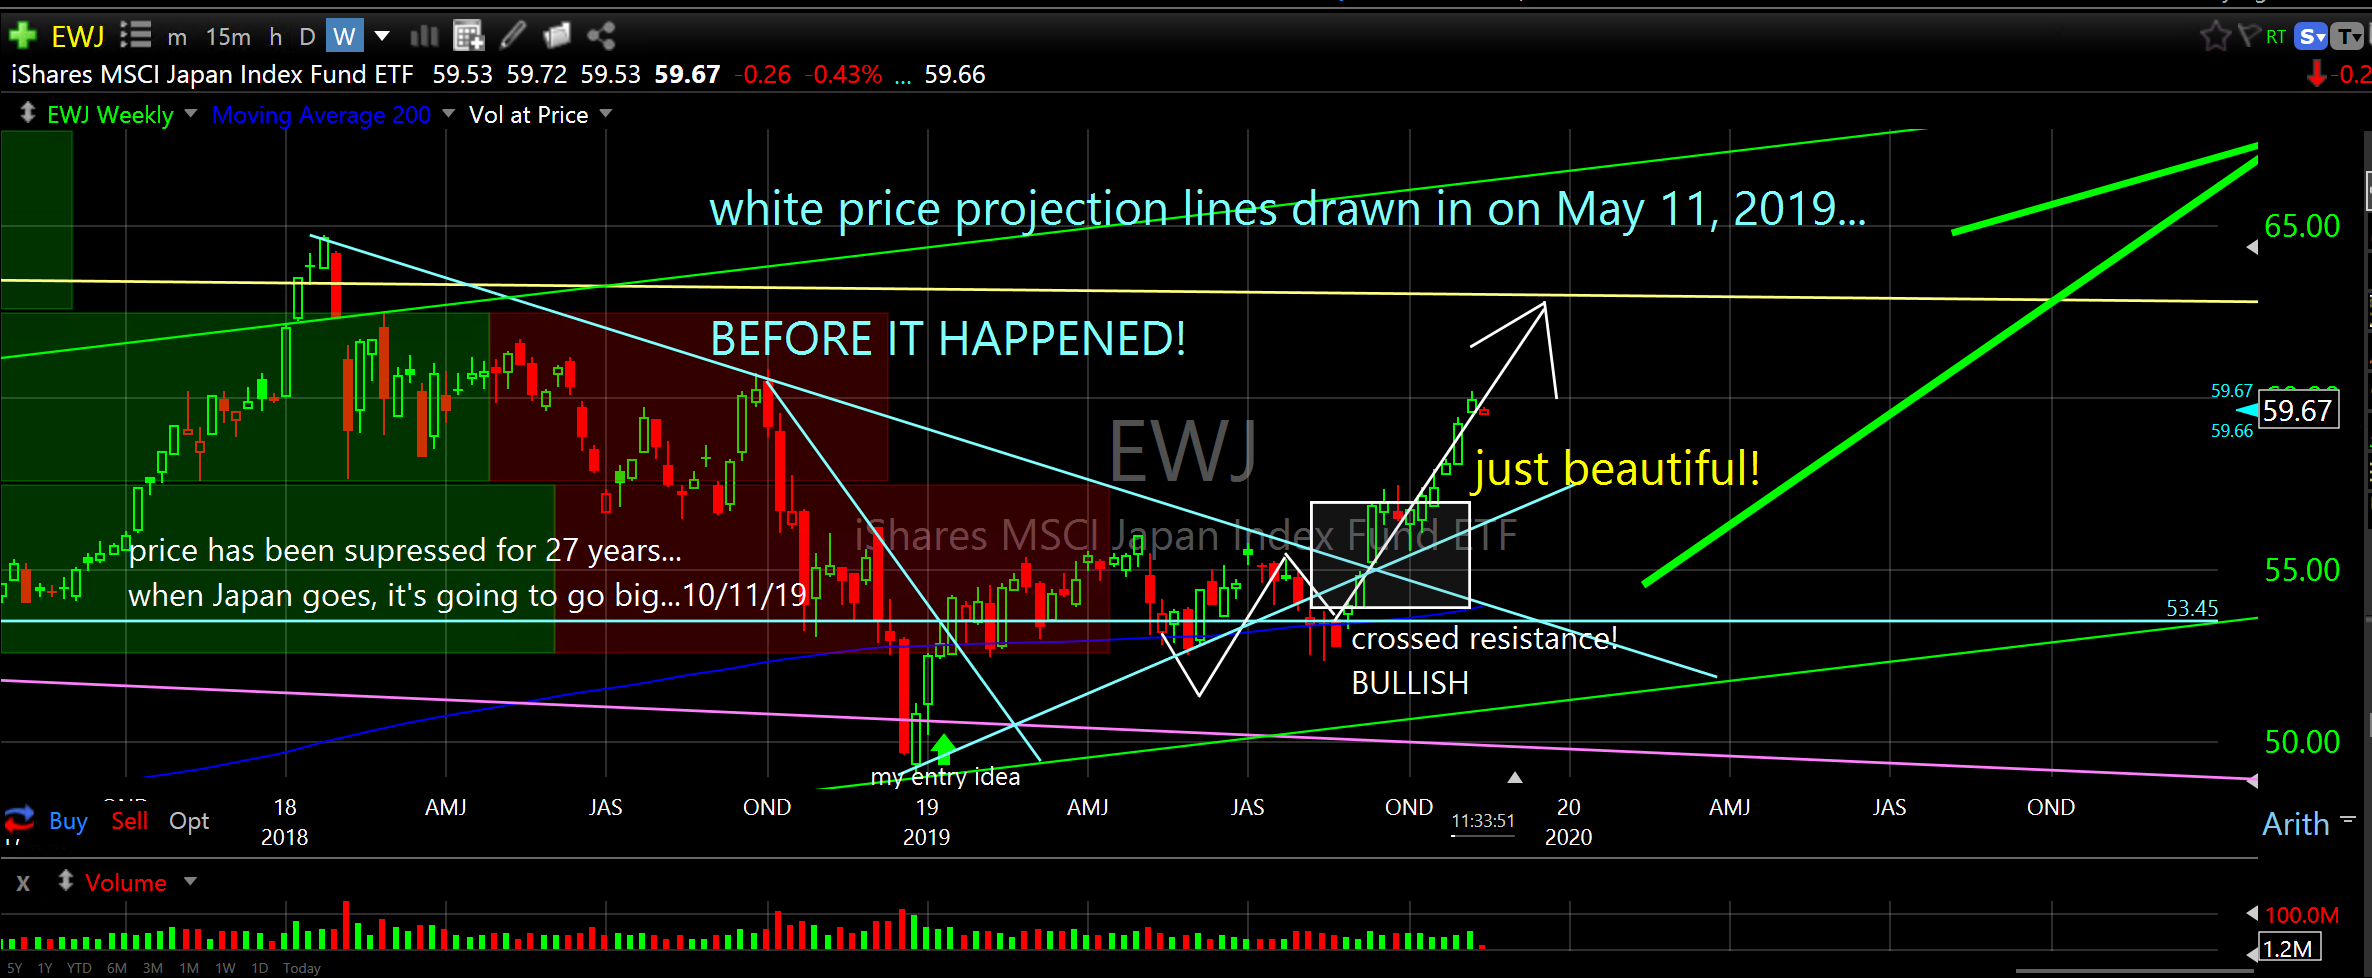
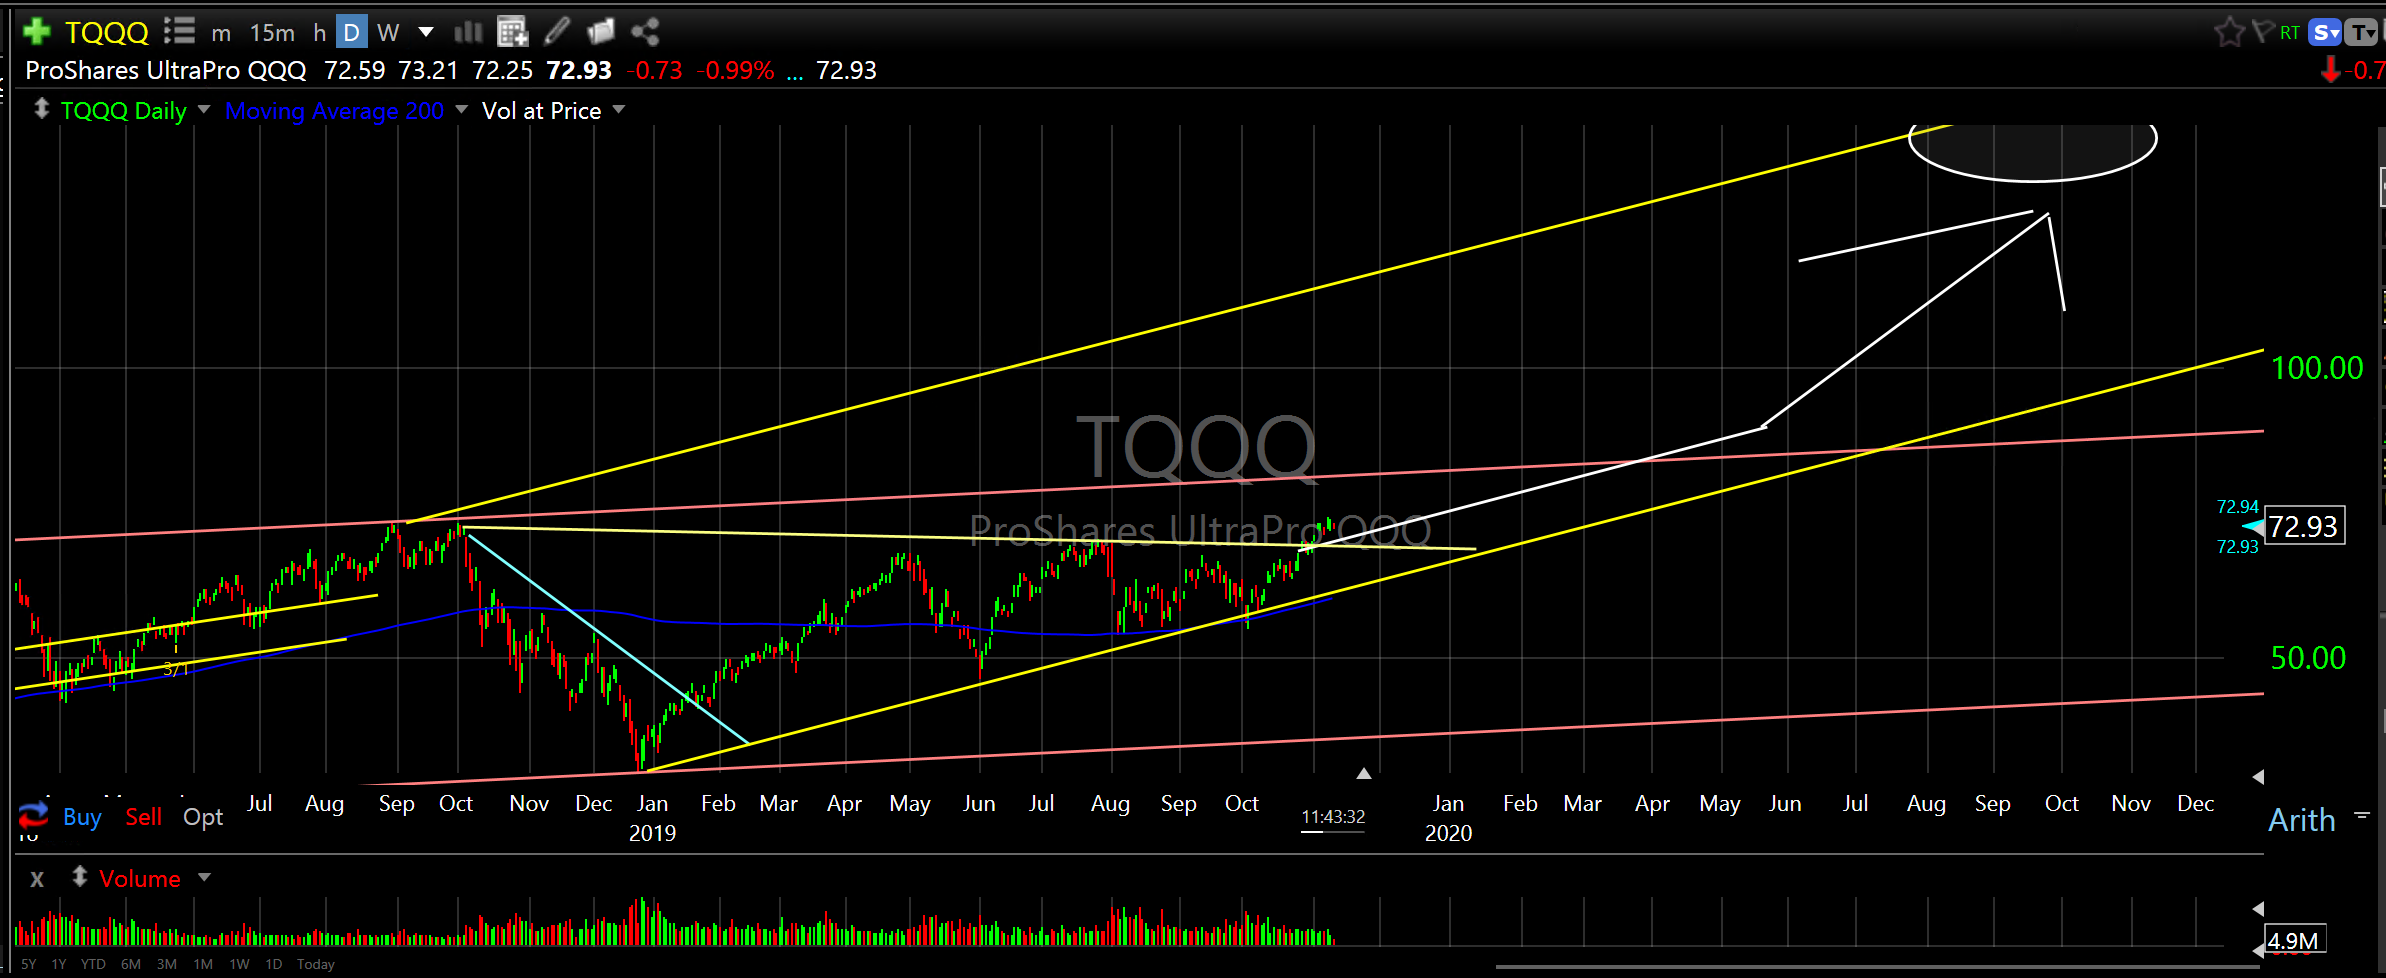
TQQQ
Entries and Exits
While all of these ETF’s are well positioned for low risk/high reward Entries it is the Exits that allow you to either capture gains before the big reversals suck the profit right out of your portfolio or to know when something is wrong so you can limit your losses. Entries are really important. Exits are of utmost importance and in my opinion, charting is absolutely the best way to illuminate these critically important price reversal zones.
You can see how these concepts and practices work in real time by studying and navigating between my Blog page research notes and Trade Alerts page with all Entries and Exits performance history over the past seven years. Just go here.
One more thing. People who say you can’t time the market are flat out WRONG. The proof is here. People who say I don’t need to time the market because I’m long term are wrong on many levels. Tell me again how long your “long term” is when you are 65, 70, 75 years old. Is the market going to magically peak when you happen to retire? Are the stars going to align right when you want to convert your growth assets to income producing assets? Or, would you prefer to understand the natural repeating cycles that can identify the significant reversals that mean so much to the bottom line.
I’ll get a bit more granular next week with individual equities that are positioned for expansion into 2020.
Thank you to all our veterans.
Peace,
Don