Broader Market Review
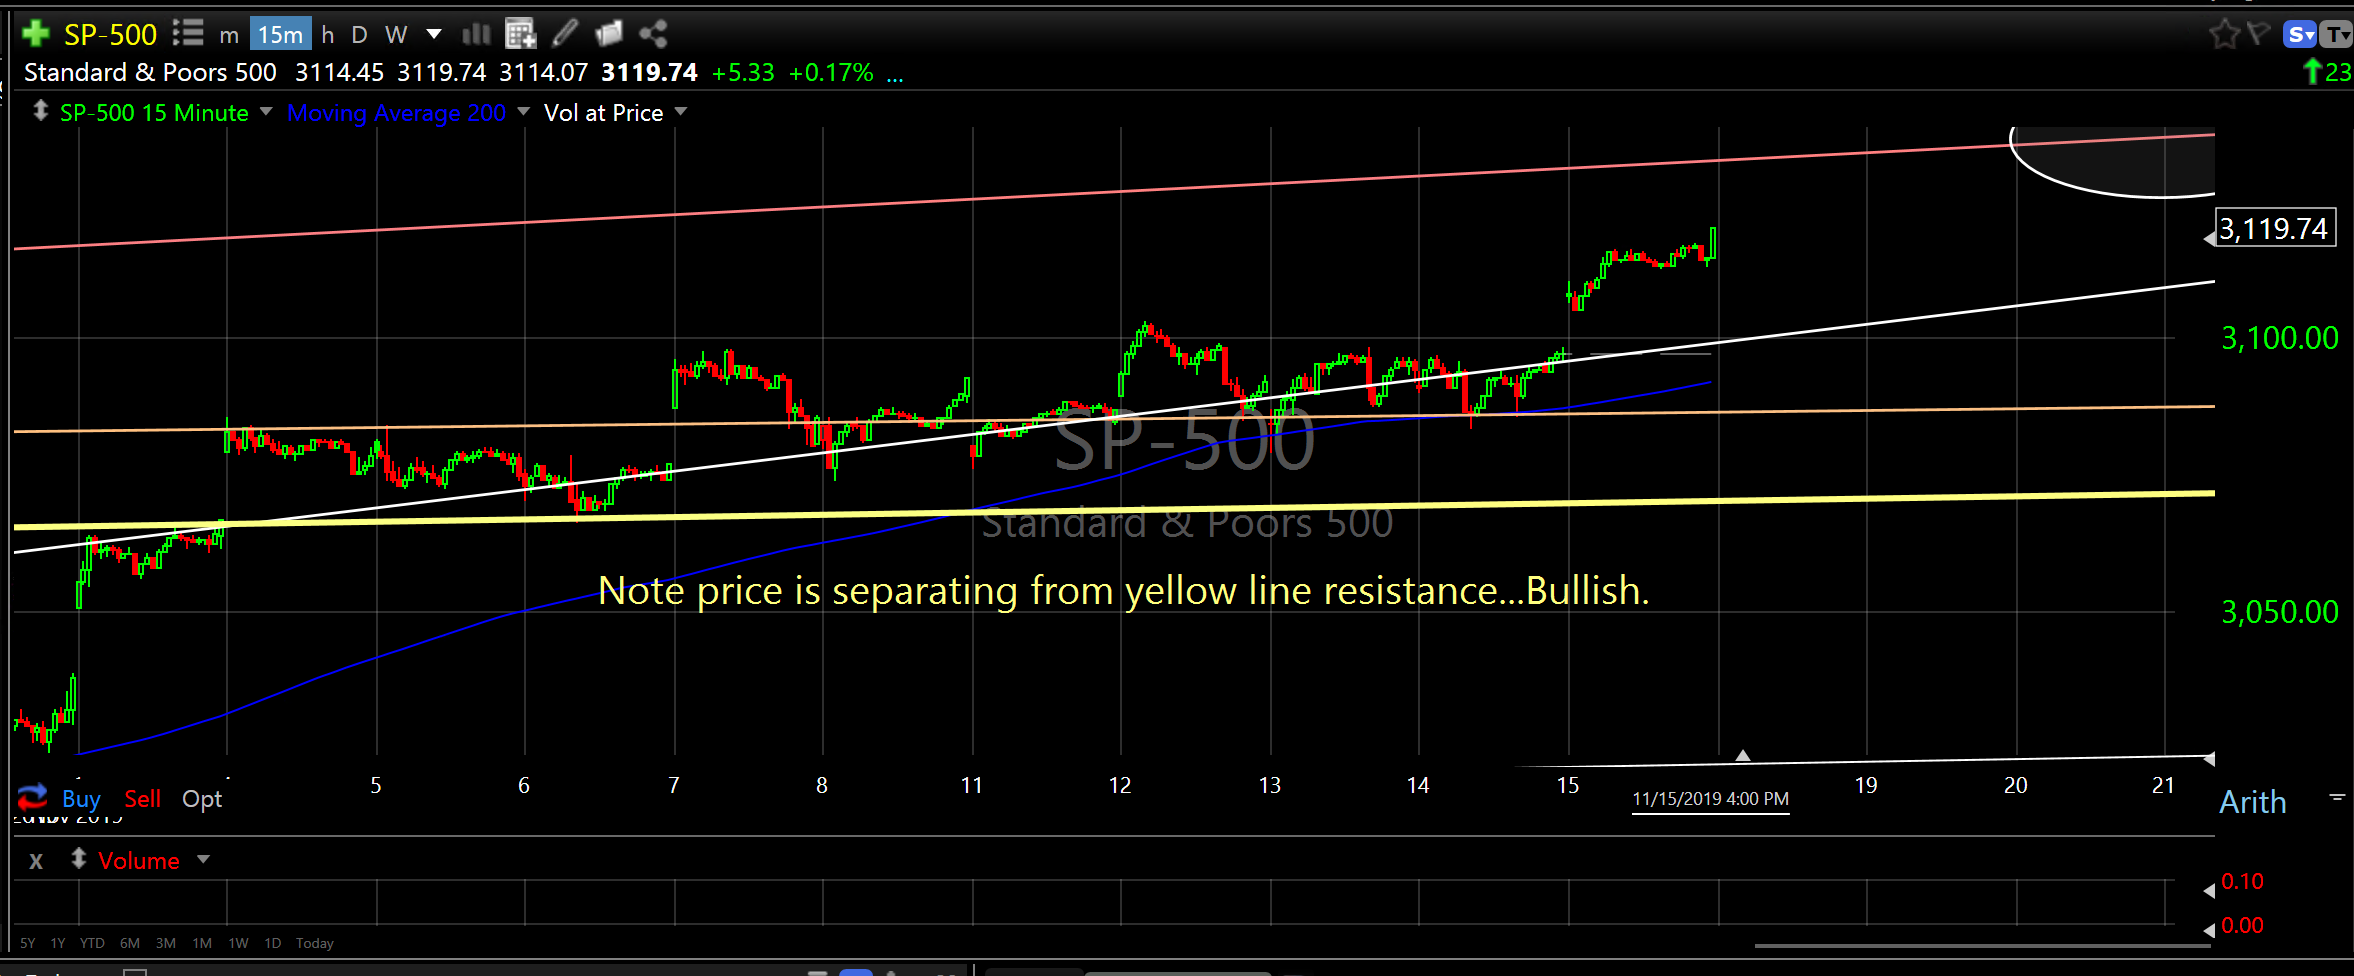
All broader market indexes have crossed over and are separating from their individual ascending yellow line resistance levels (now support) from early 2018 that I have been referencing for most of 2019. This separation is GOOD. It’s exactly what we want to see. The separation is BULLISH. The expansion has finally begun. Price action is right on it’s expected and projected track and the thrust higher in 2020 should catch most people off guard as there aren’t too many (experts or otherwise) that expect the kind of rip roaring expansion that should take the Dow close to 34,000 before the presidential election next year. Let’s begin by focusing in on the crossover and separation chart then moving to a wider lens to get a longer term view.
The three charts below are:
1. A close up look at the crossover and separation (SP-500 index).
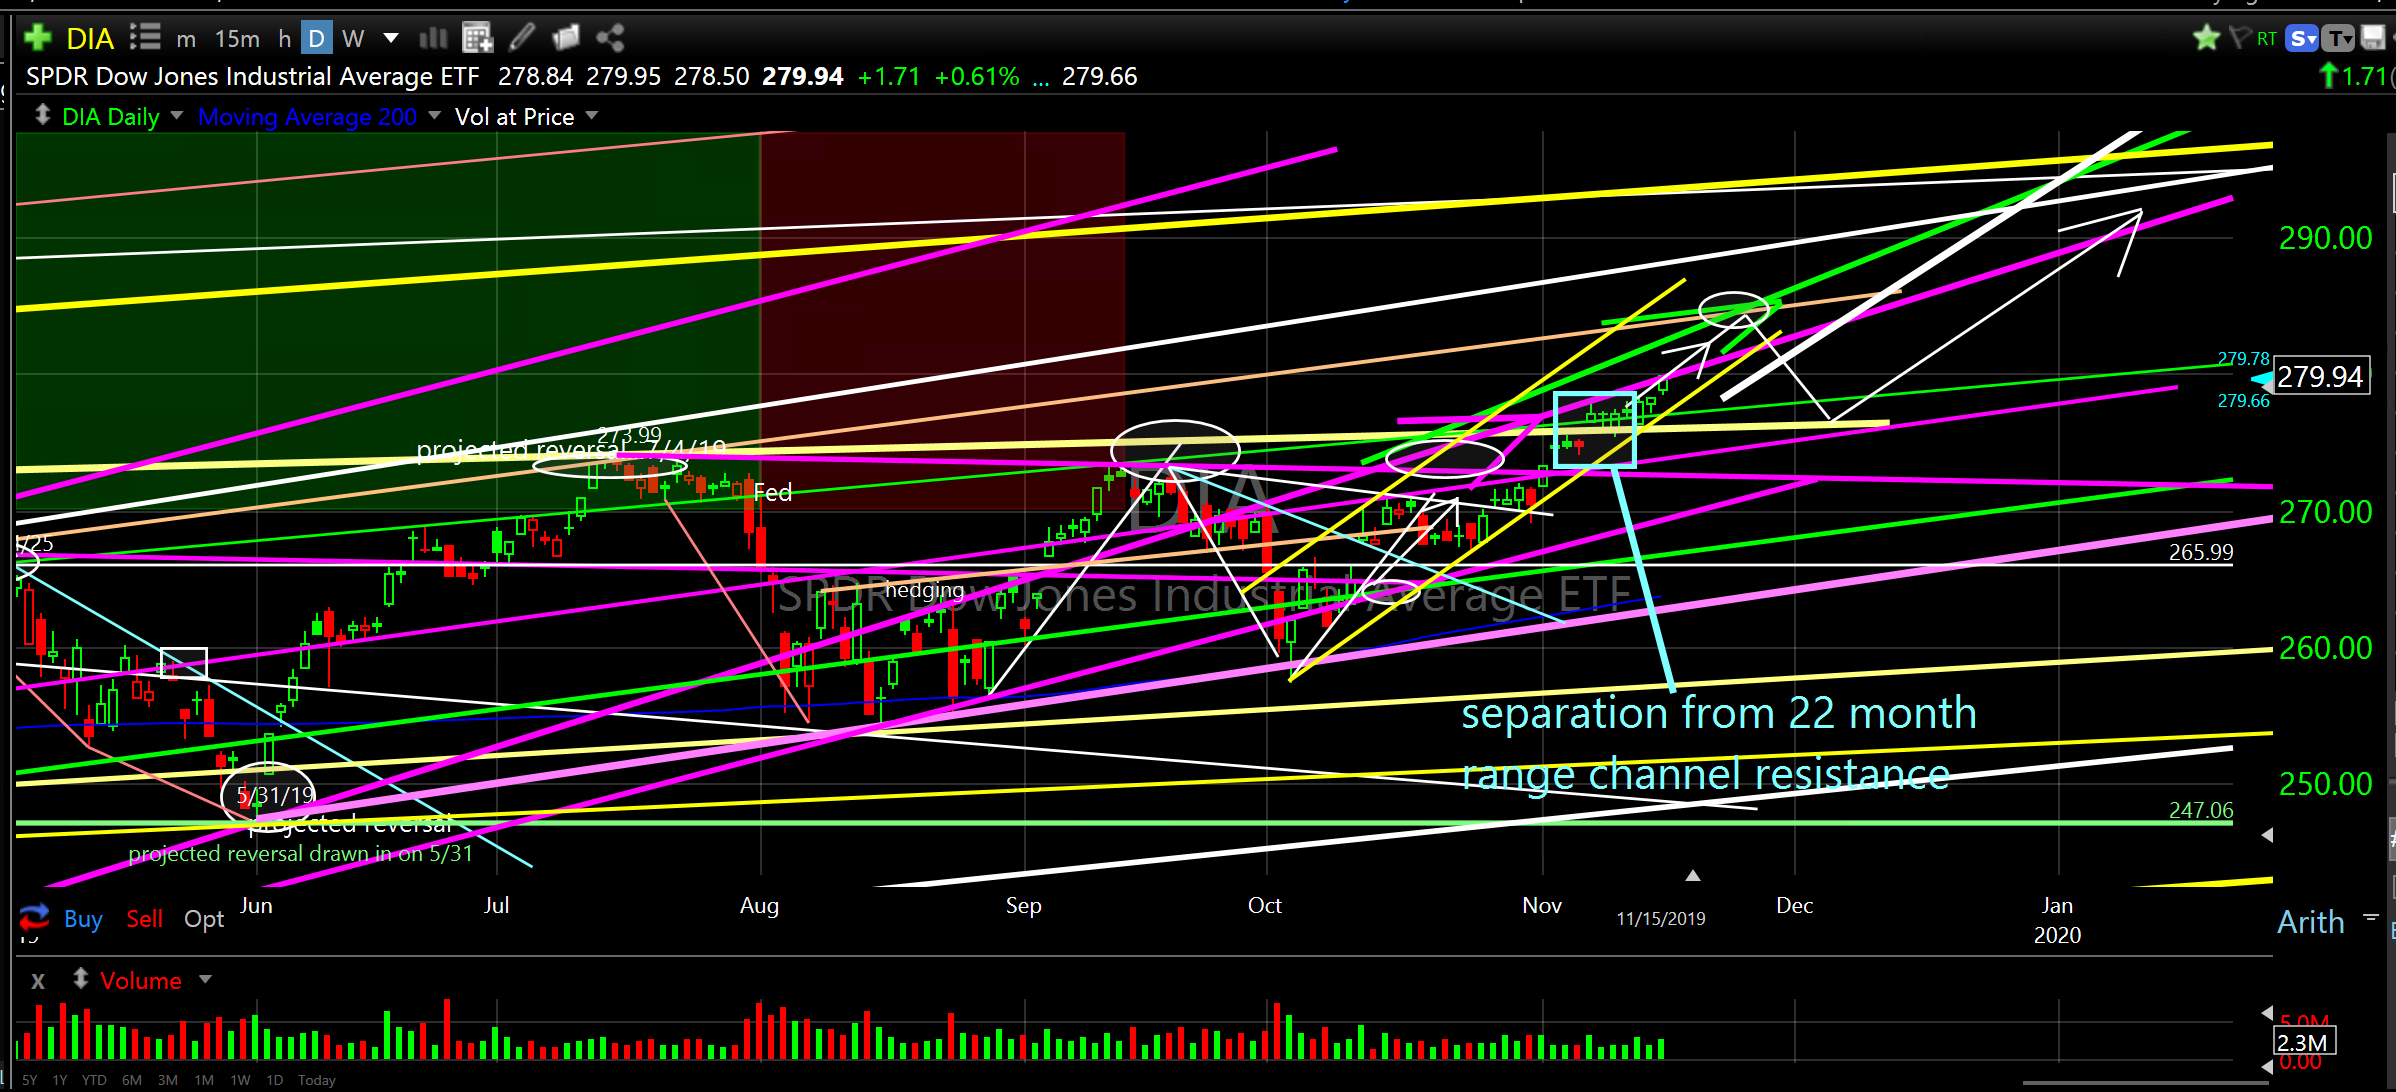
2. Dow Jones Industrial Average ETF (DIA) year end price projection.
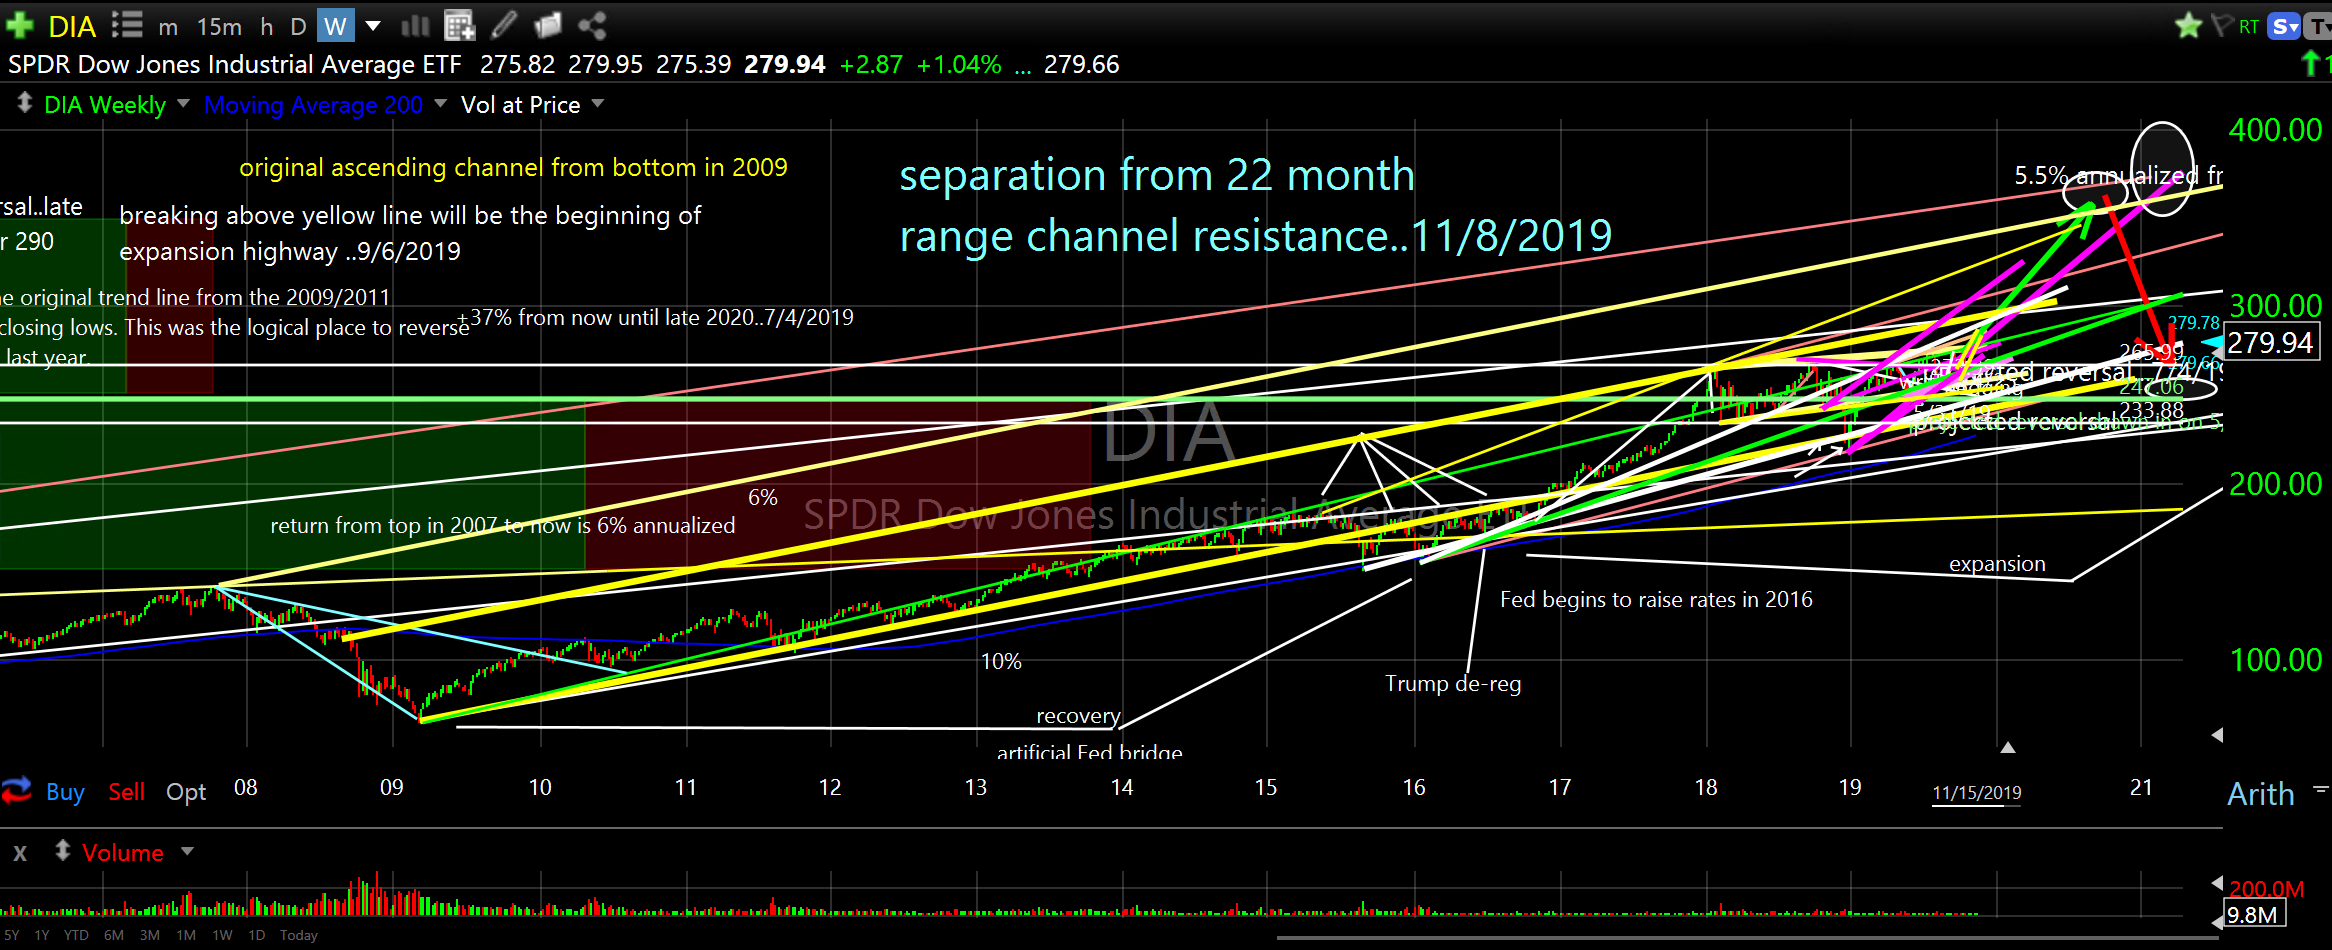
3. DIA 2020 projection…2006-2021
Standard & Poors 500 (SP-500 index) crossover and separation
SPDR Dow Jones Industrial Average ETF (DIA) daily year end price projection
SPDR Dow Jones Industrial Average ETF (DIA) weekly 2020 projection…2006-2021
This does not mean we won’t have choppy price action. We are always vulnerable at resistance levels. In fact, the broader market is on track to run into another ascending resistance level over the course of the next couple of weeks. It would not be surprising or out of the ordinary to get a pullback soon. What I do not expect is anything too deep. See DIA year end price projection chart for expected depth of next dip which might be a re-test of the yellow line ascending resistance level recently crossed over. This is now ascending support. I expect it to hold (at worst a slight dip below) and propel price higher leaving “most” everyone scratching their heads in disbelief and coming up with “reasons” to explain why. Where the heck were they six months ago when they were all crying “yield inversion! recession…recession!”
There are hundreds of individual stocks, subsector ETF’s and sector ETF’s that are aligning into their expansion channels positioning the broader market for the 2020 ramp higher. See my post from last week here to review these sector and subsector ETF’s. This week I will highlight some individual stocks that are either in their expansion channel or about to reverse, align and expand.
But first, let’s take another look at the CBOE 10 Year Treasury Yield Index and how it correlates to broader equity market expansion and collapse cycles. Equity expansions begin when the 10 Year is at the bottom. We are at the bottom NOW. Please note I projected the bottom (circle) in August…before the reversal higher occured. So, in addition to individual stocks, sectors, subsectors and broader market indexes aligning into their higher linear degree expansion channels we have yields in position to do the same thing. This is BULLISH. This is exactly what we want to see happen. How can so many people get this wrong..every time?!?!
CBOE 10 Year Treasury Yield Index (TNX-X) weekly
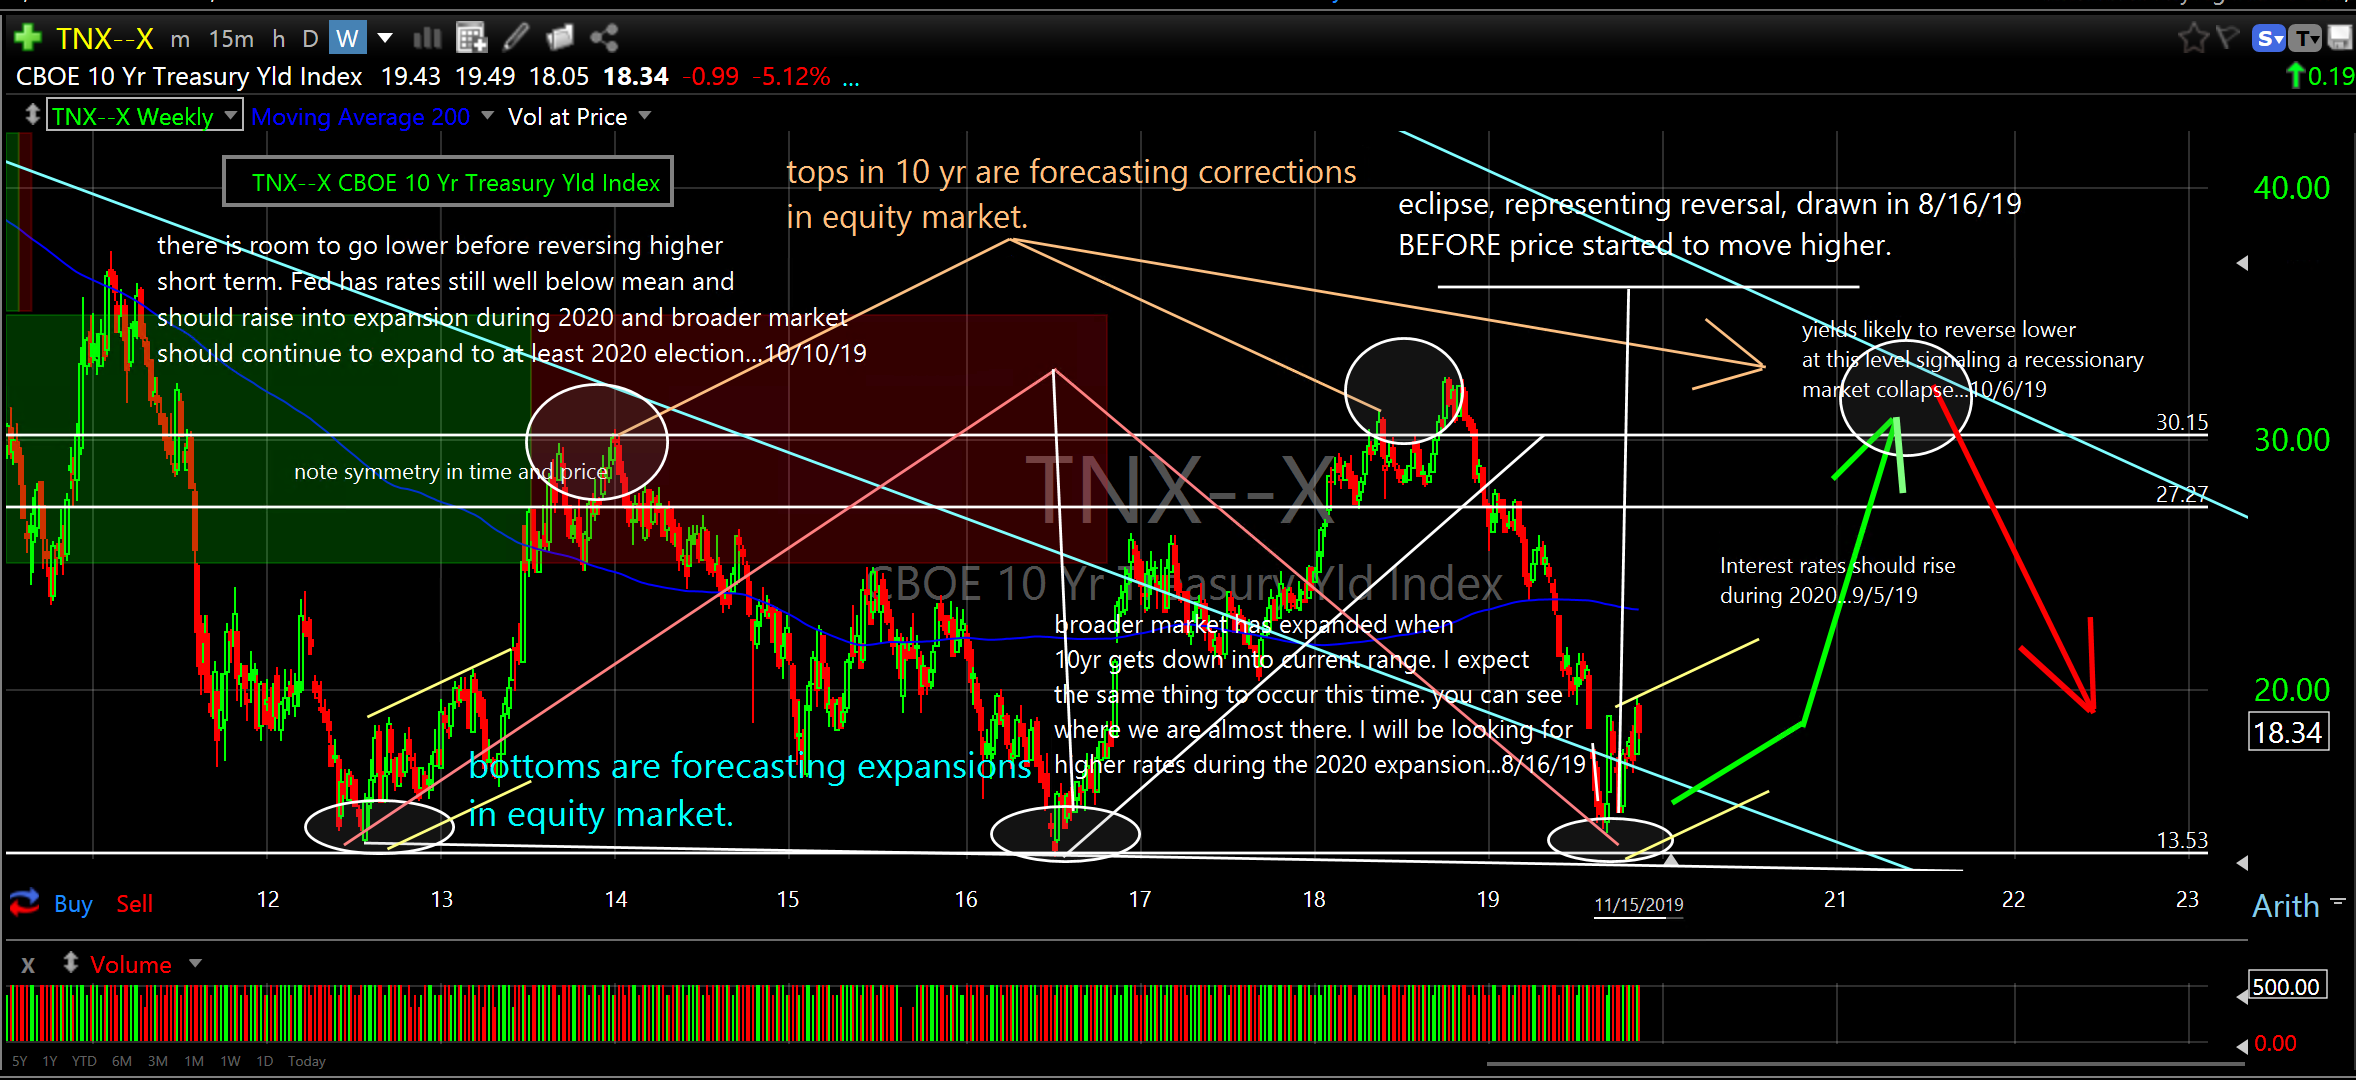
CBOE 10 Year Treasury Yield Index (TNX-X) weekly
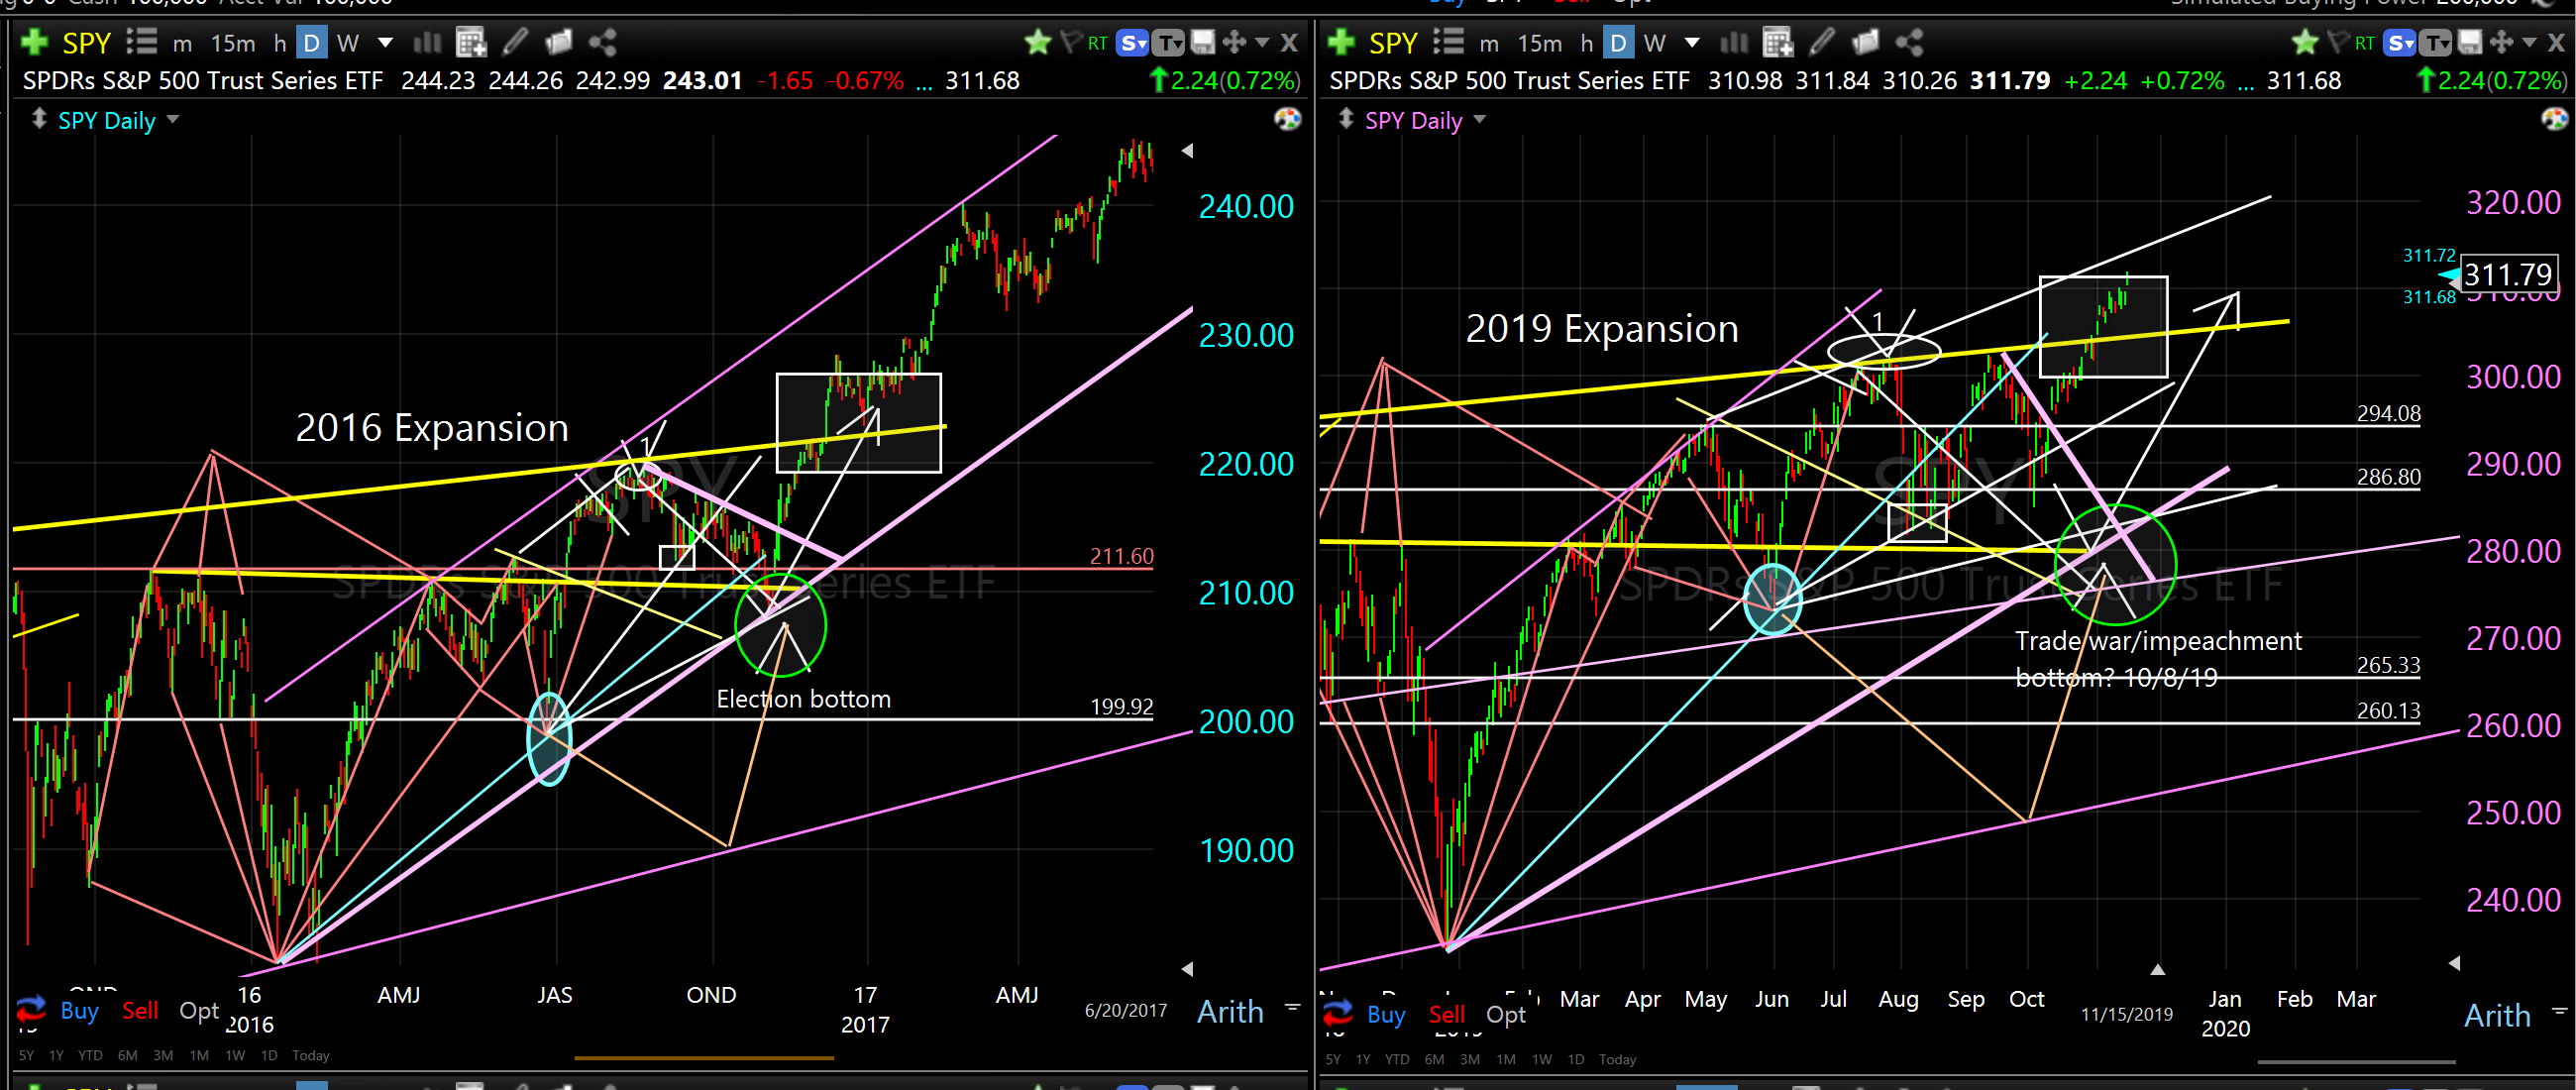
Also, look at the similarities between the 2016/2017 expansion and now. One, this should make you sit up and say “Holy Crap Batman”. Two, need I say more? We measure human behavior that is revealed in raw price data because it repeats in quantifiable characteristics. Human behavior in investing is driven by fear and greed. Both emotions produce poor decision making. I try and eliminate emotion or “what I think” from the equation. The more I can do this the better. This can’t be done with fundamental analysis as there isn’t enough correlation with anything that comes close to identifying reversals the way charting can. Identifying reversals is the holy grail. That’s why most active managers or research analysts can’t trade their way out of a day old wet paper bag.
SPY expansion comparison…2016 and 2019…daily
Individual Stocks
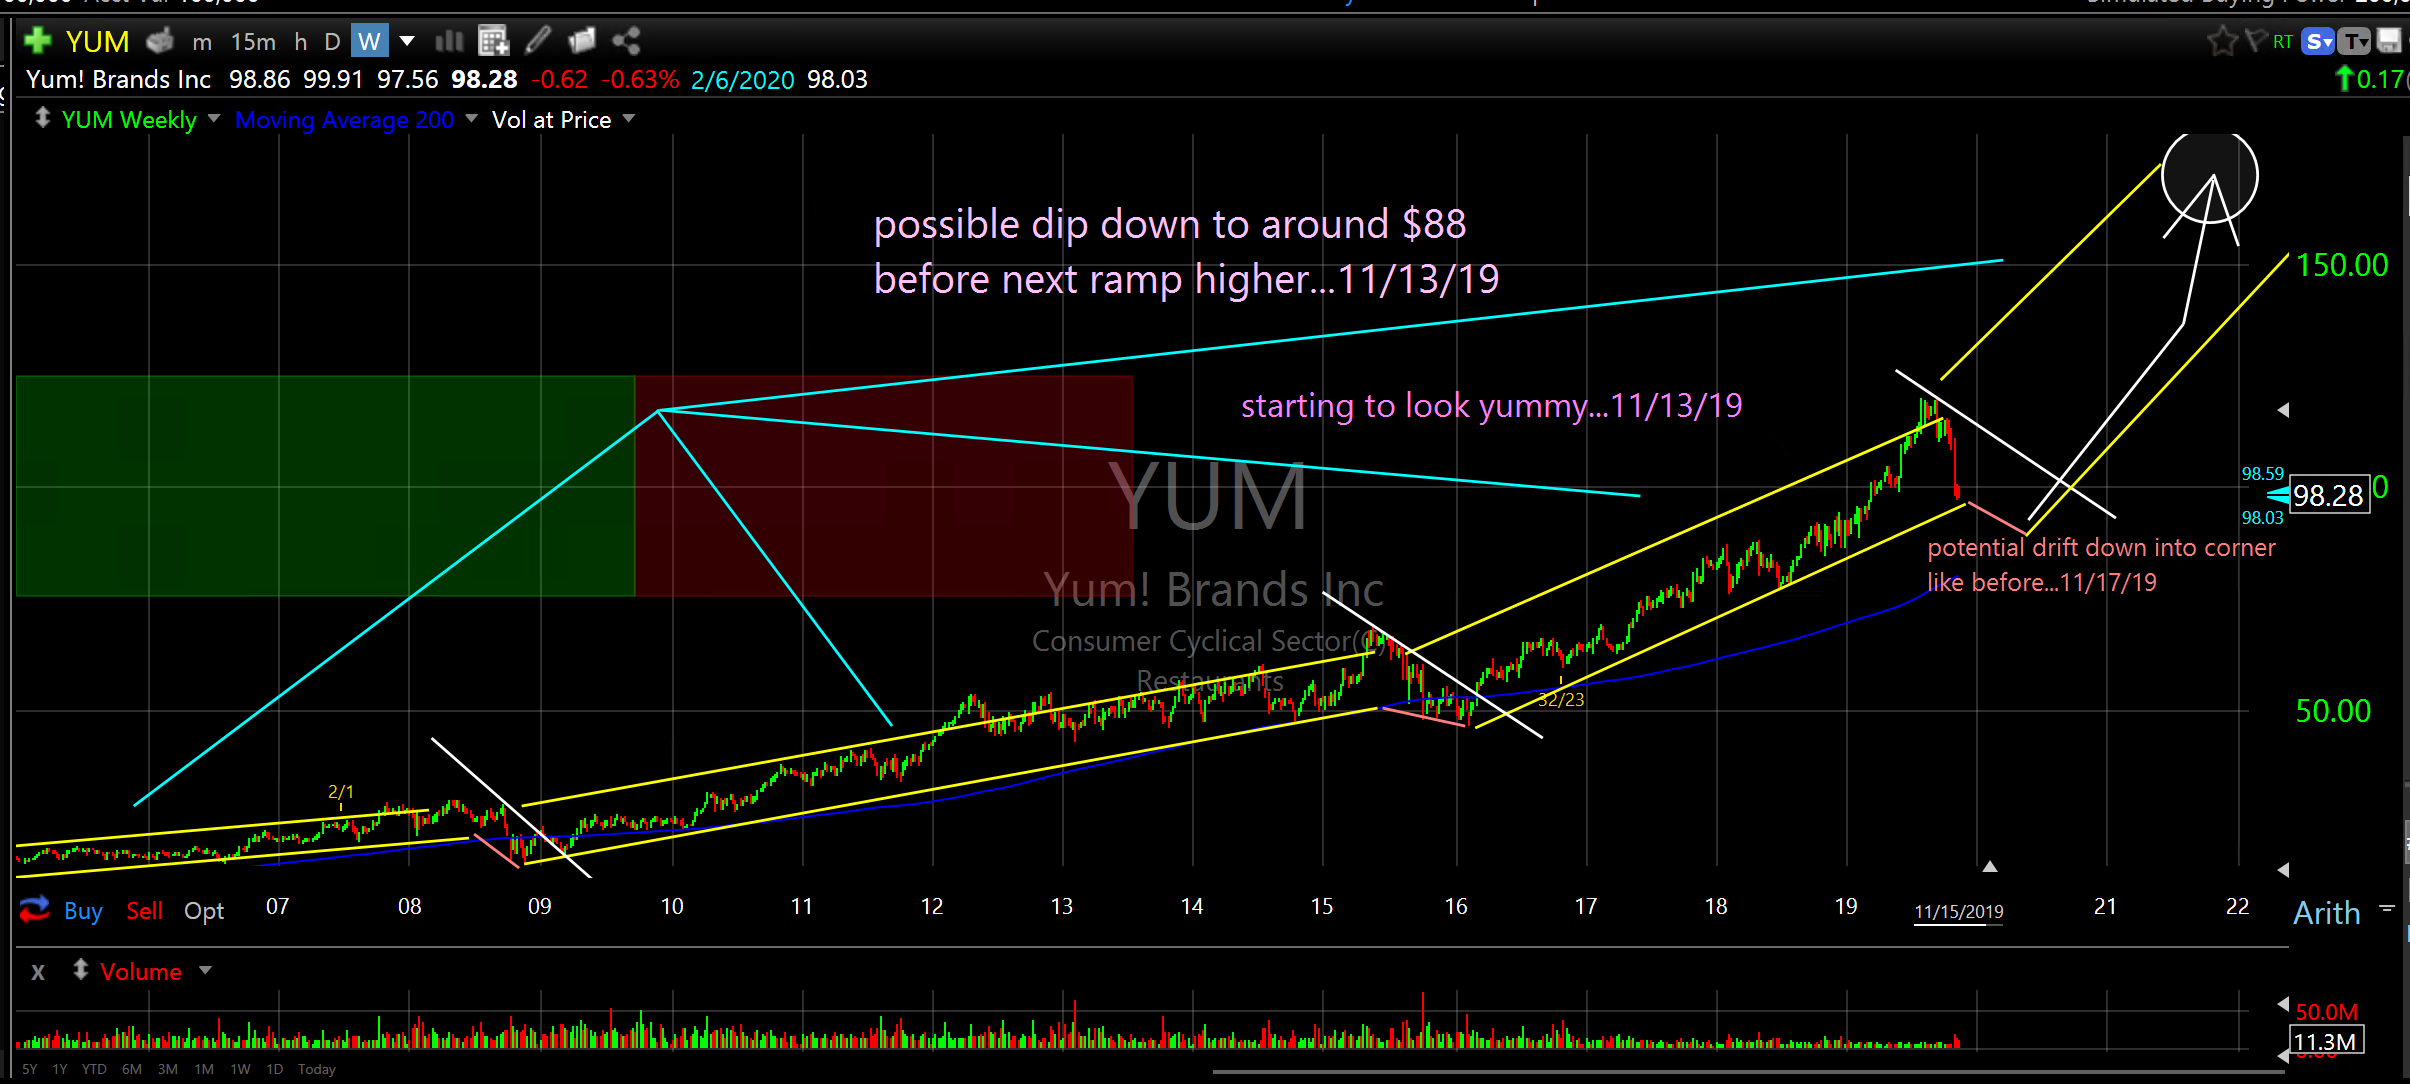
Yum! Brands Inc (YUM) weekly
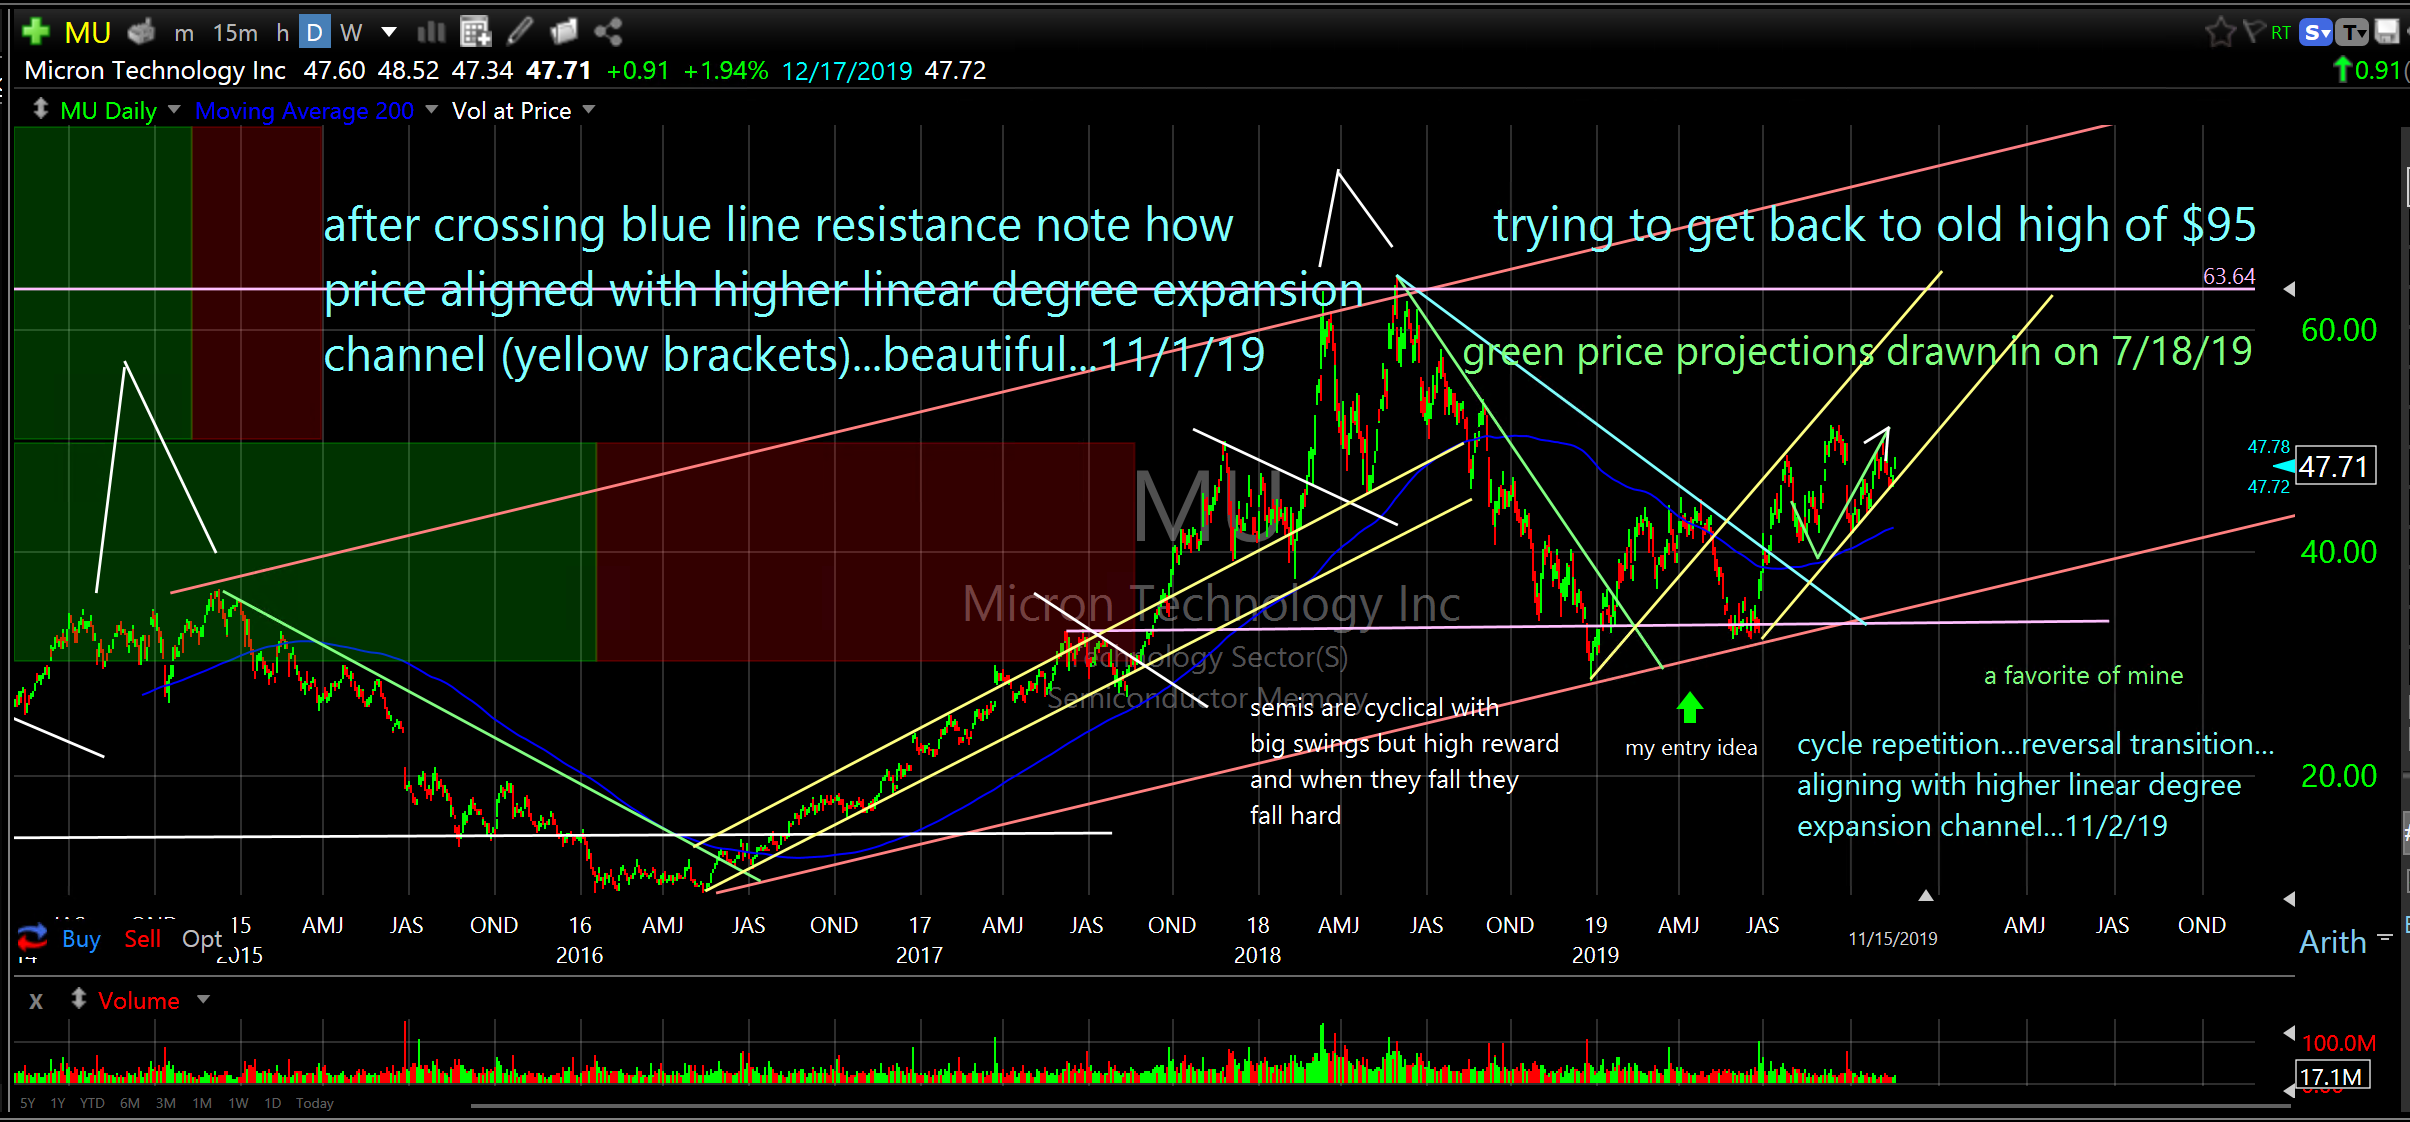
Micron Technology Inc (MU) daily
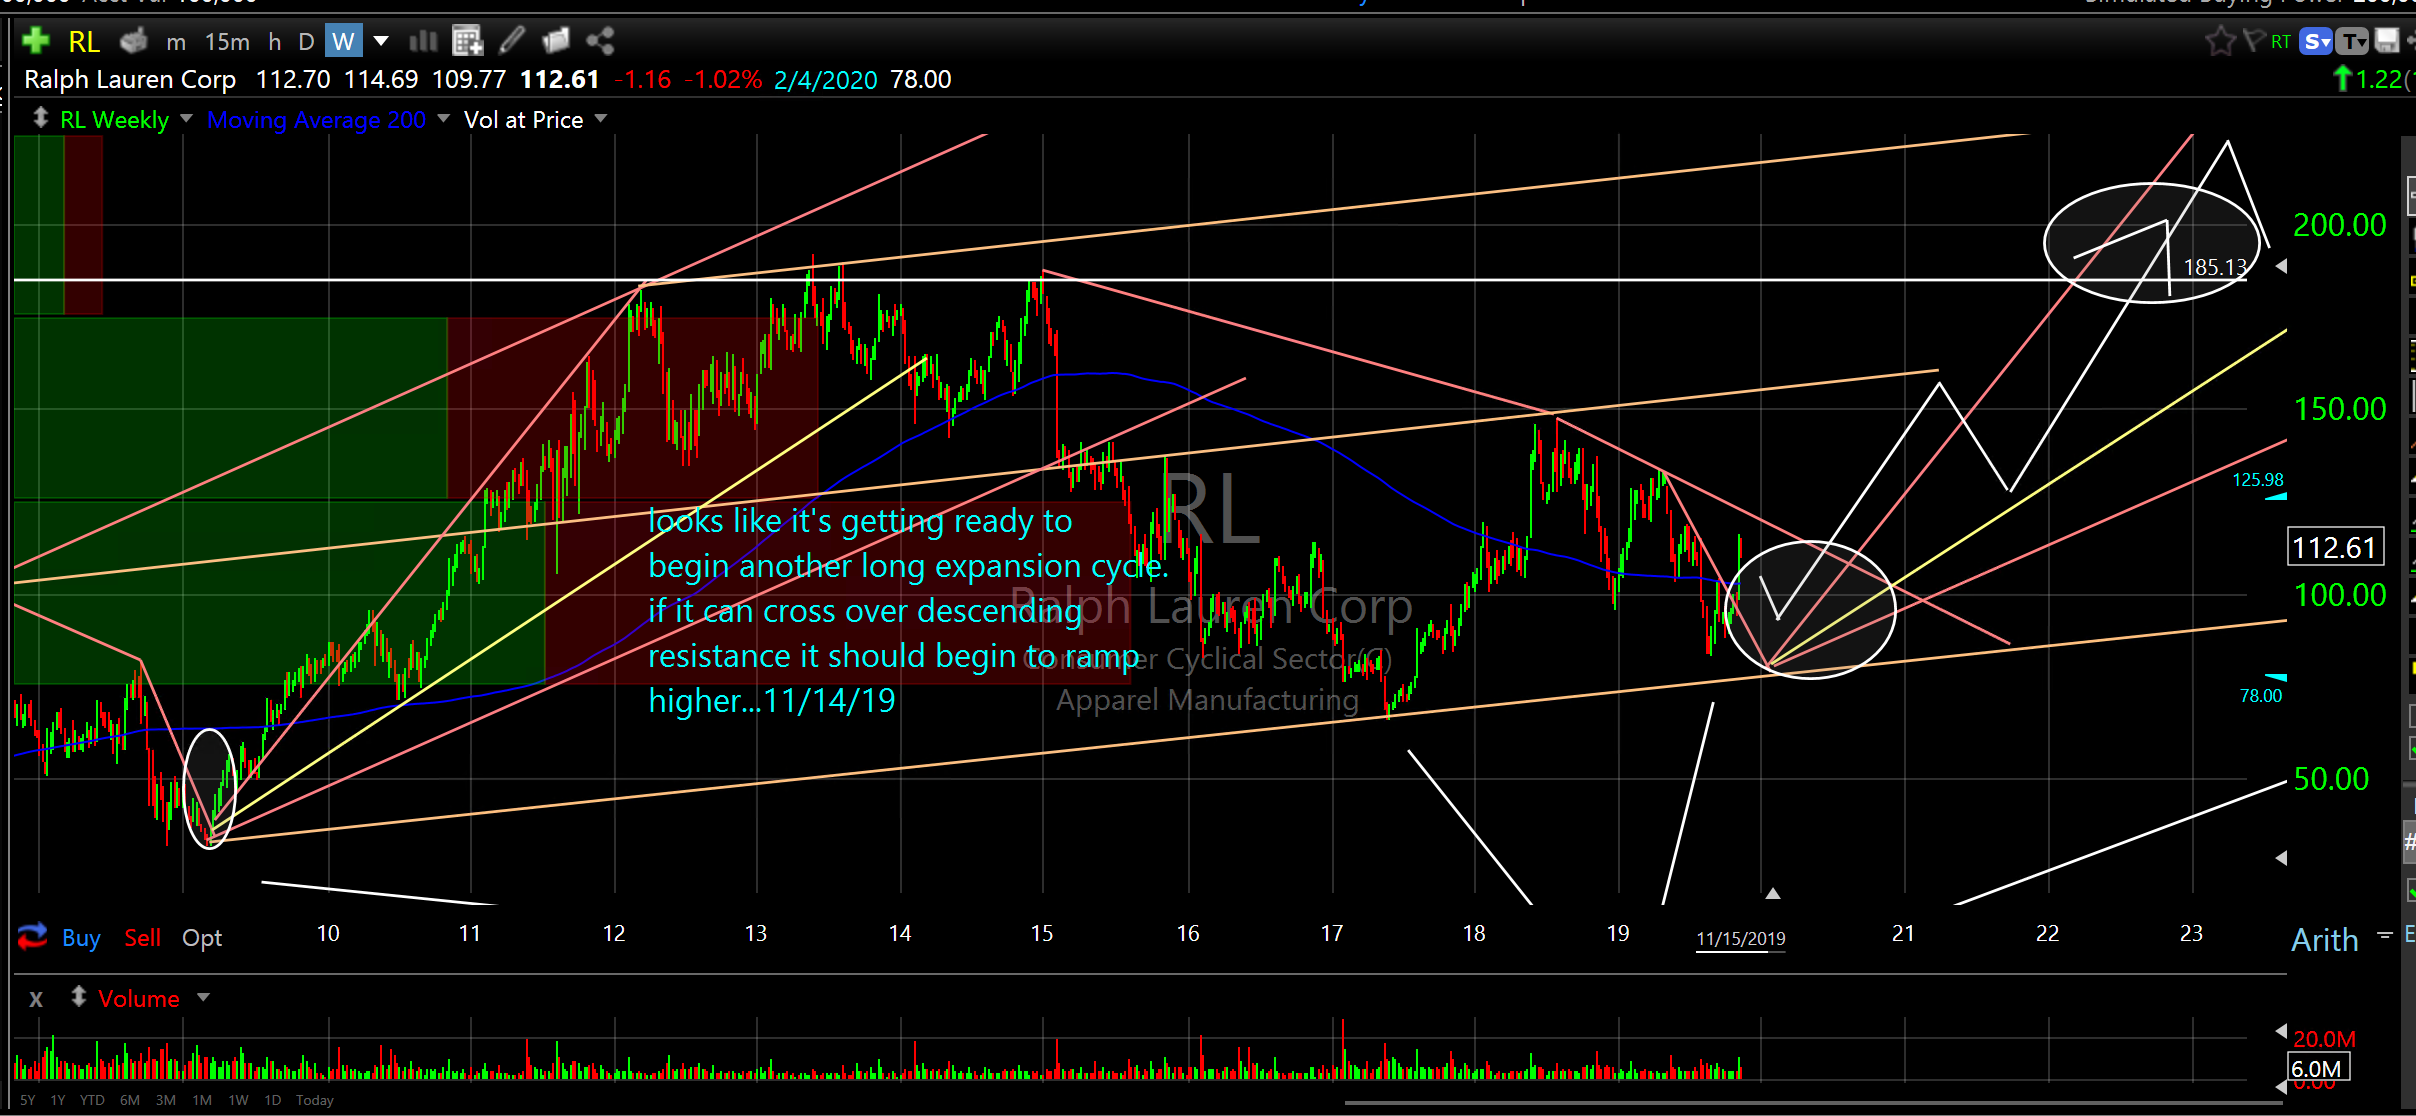
Ralph Lauren Corp (RL) weekly
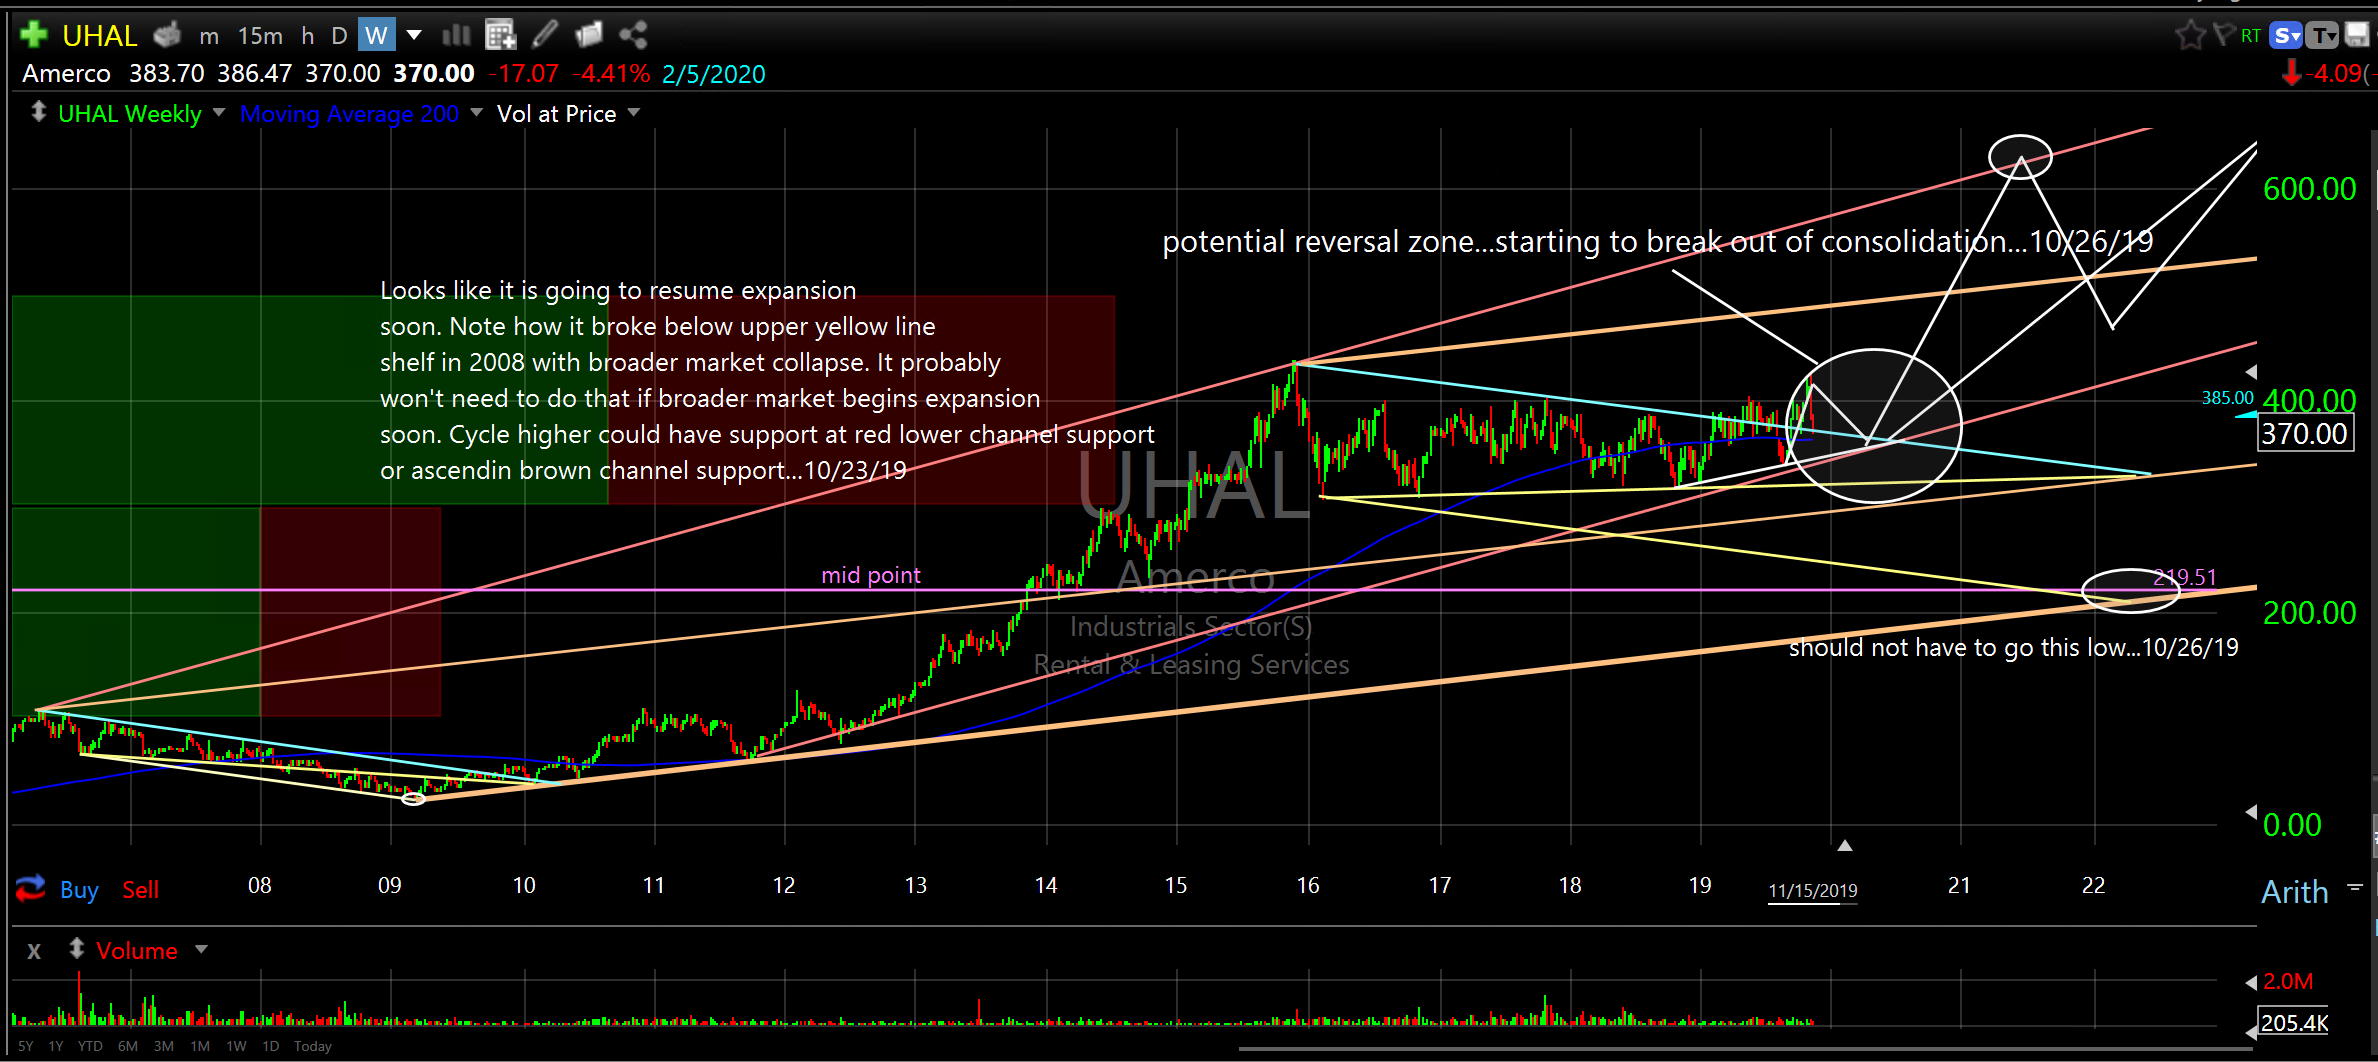
Amerco (UHAL) weekly
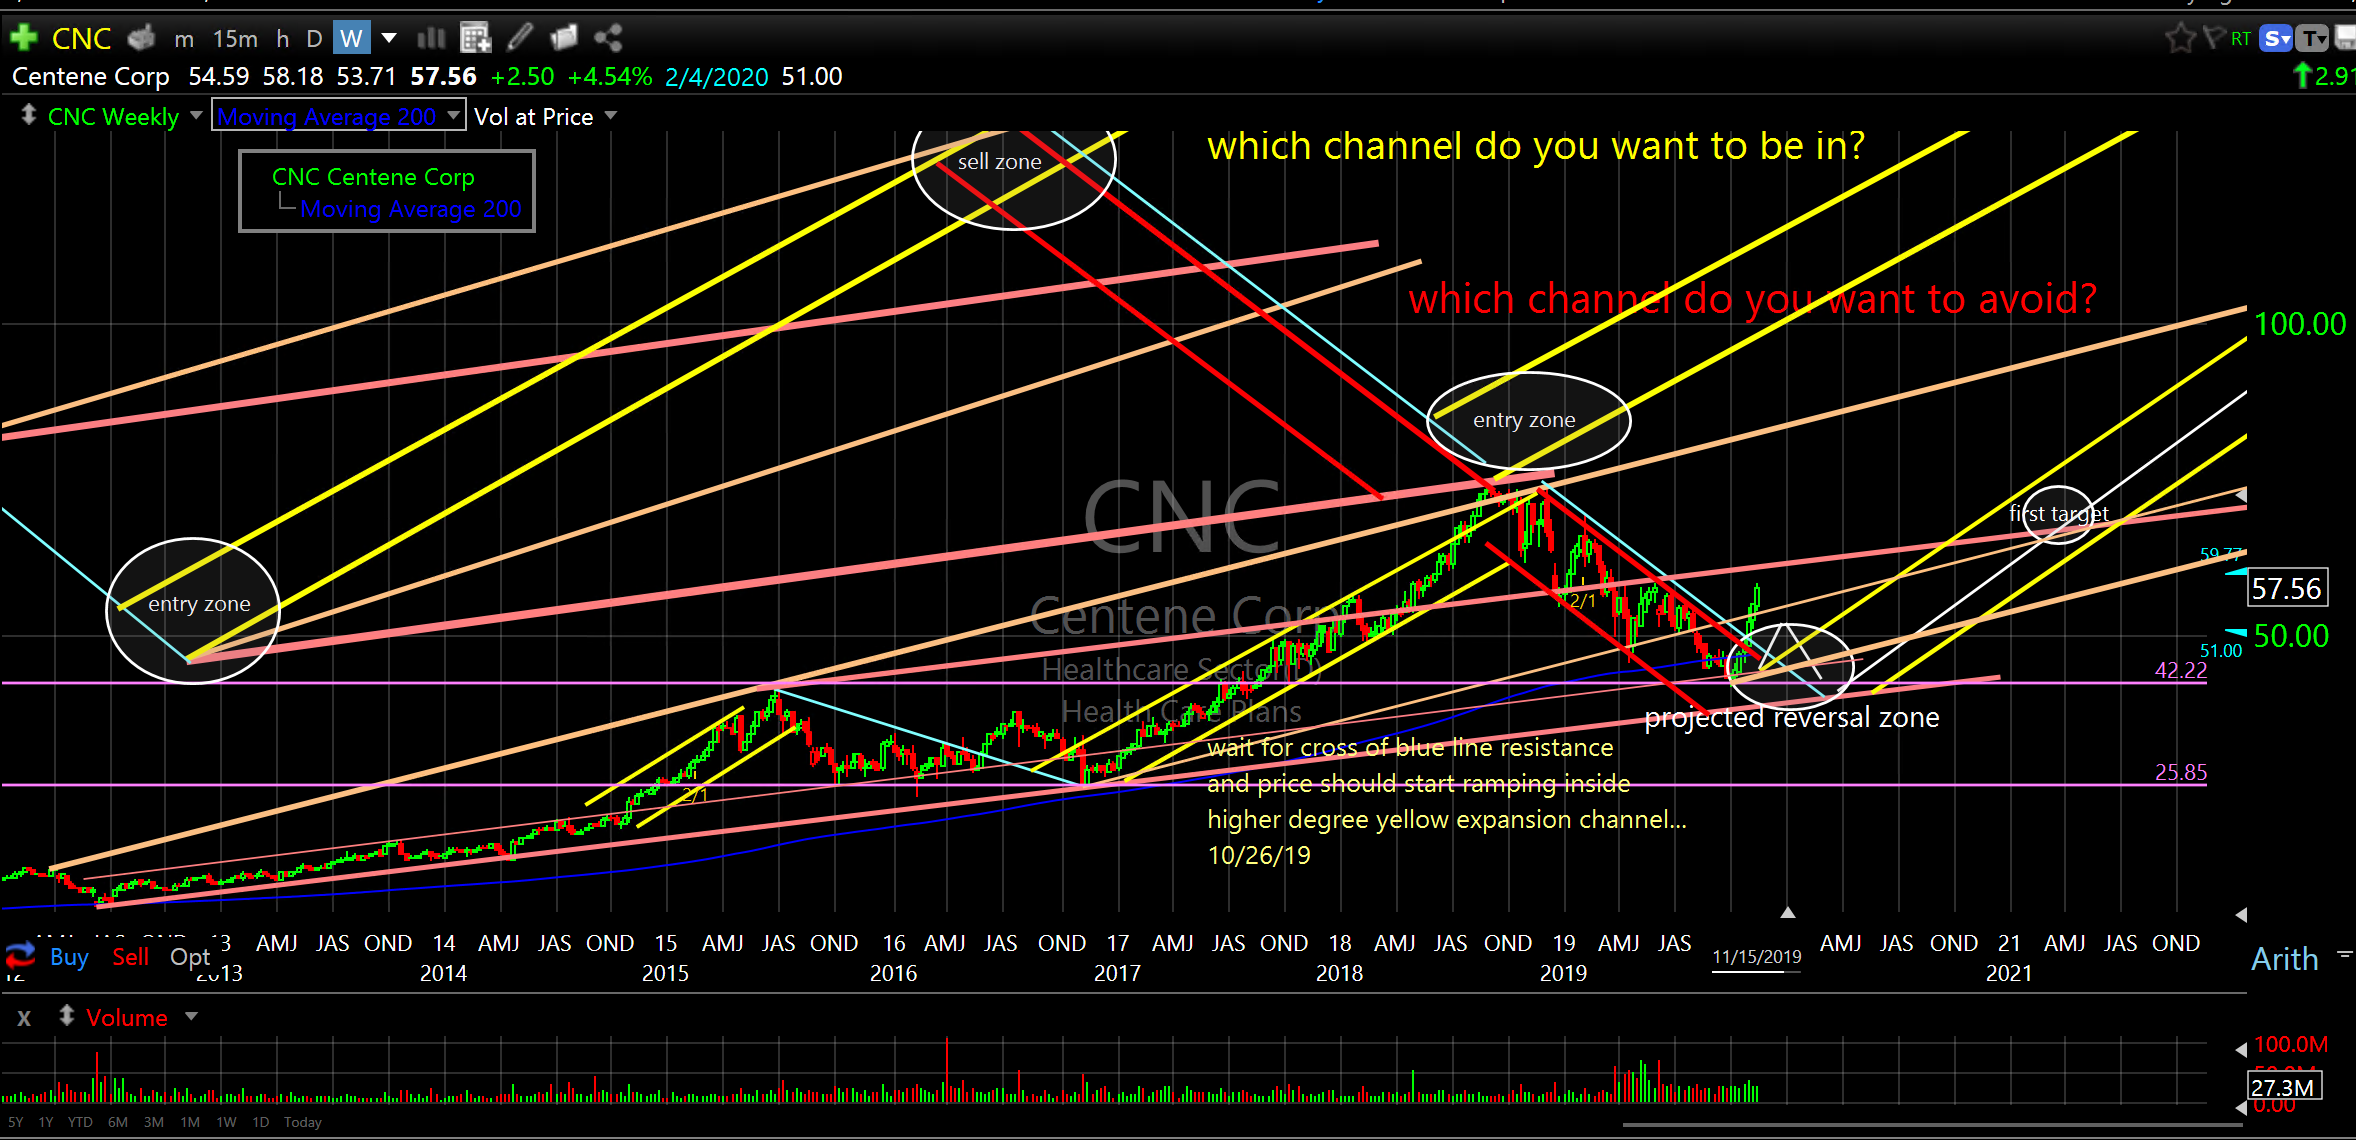
Centene Corp (CNC) weekly
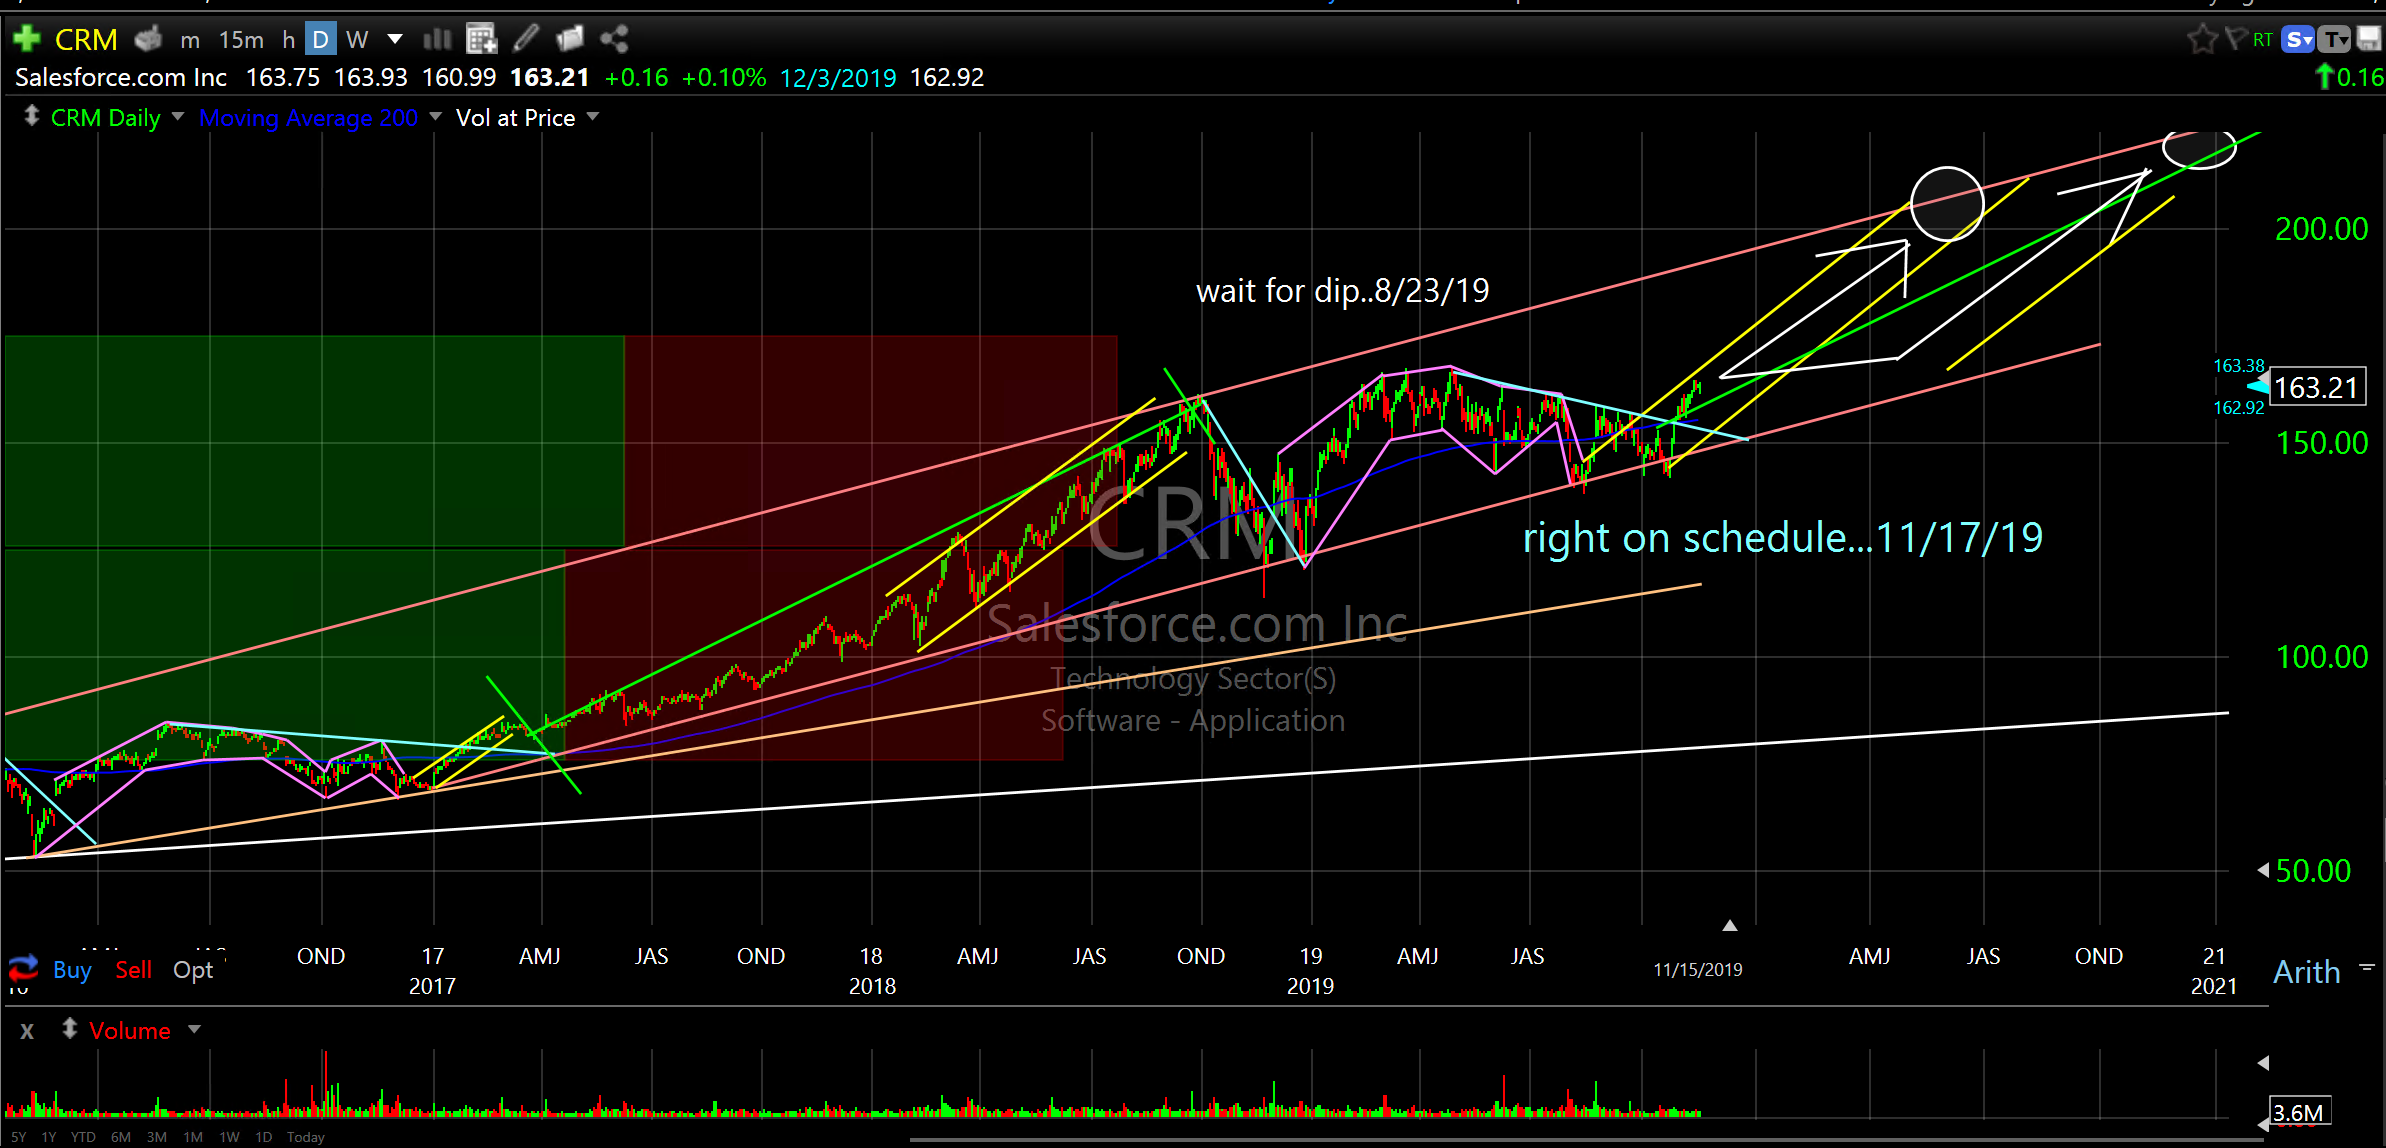
Salesforce.com Inc (CRM) daily
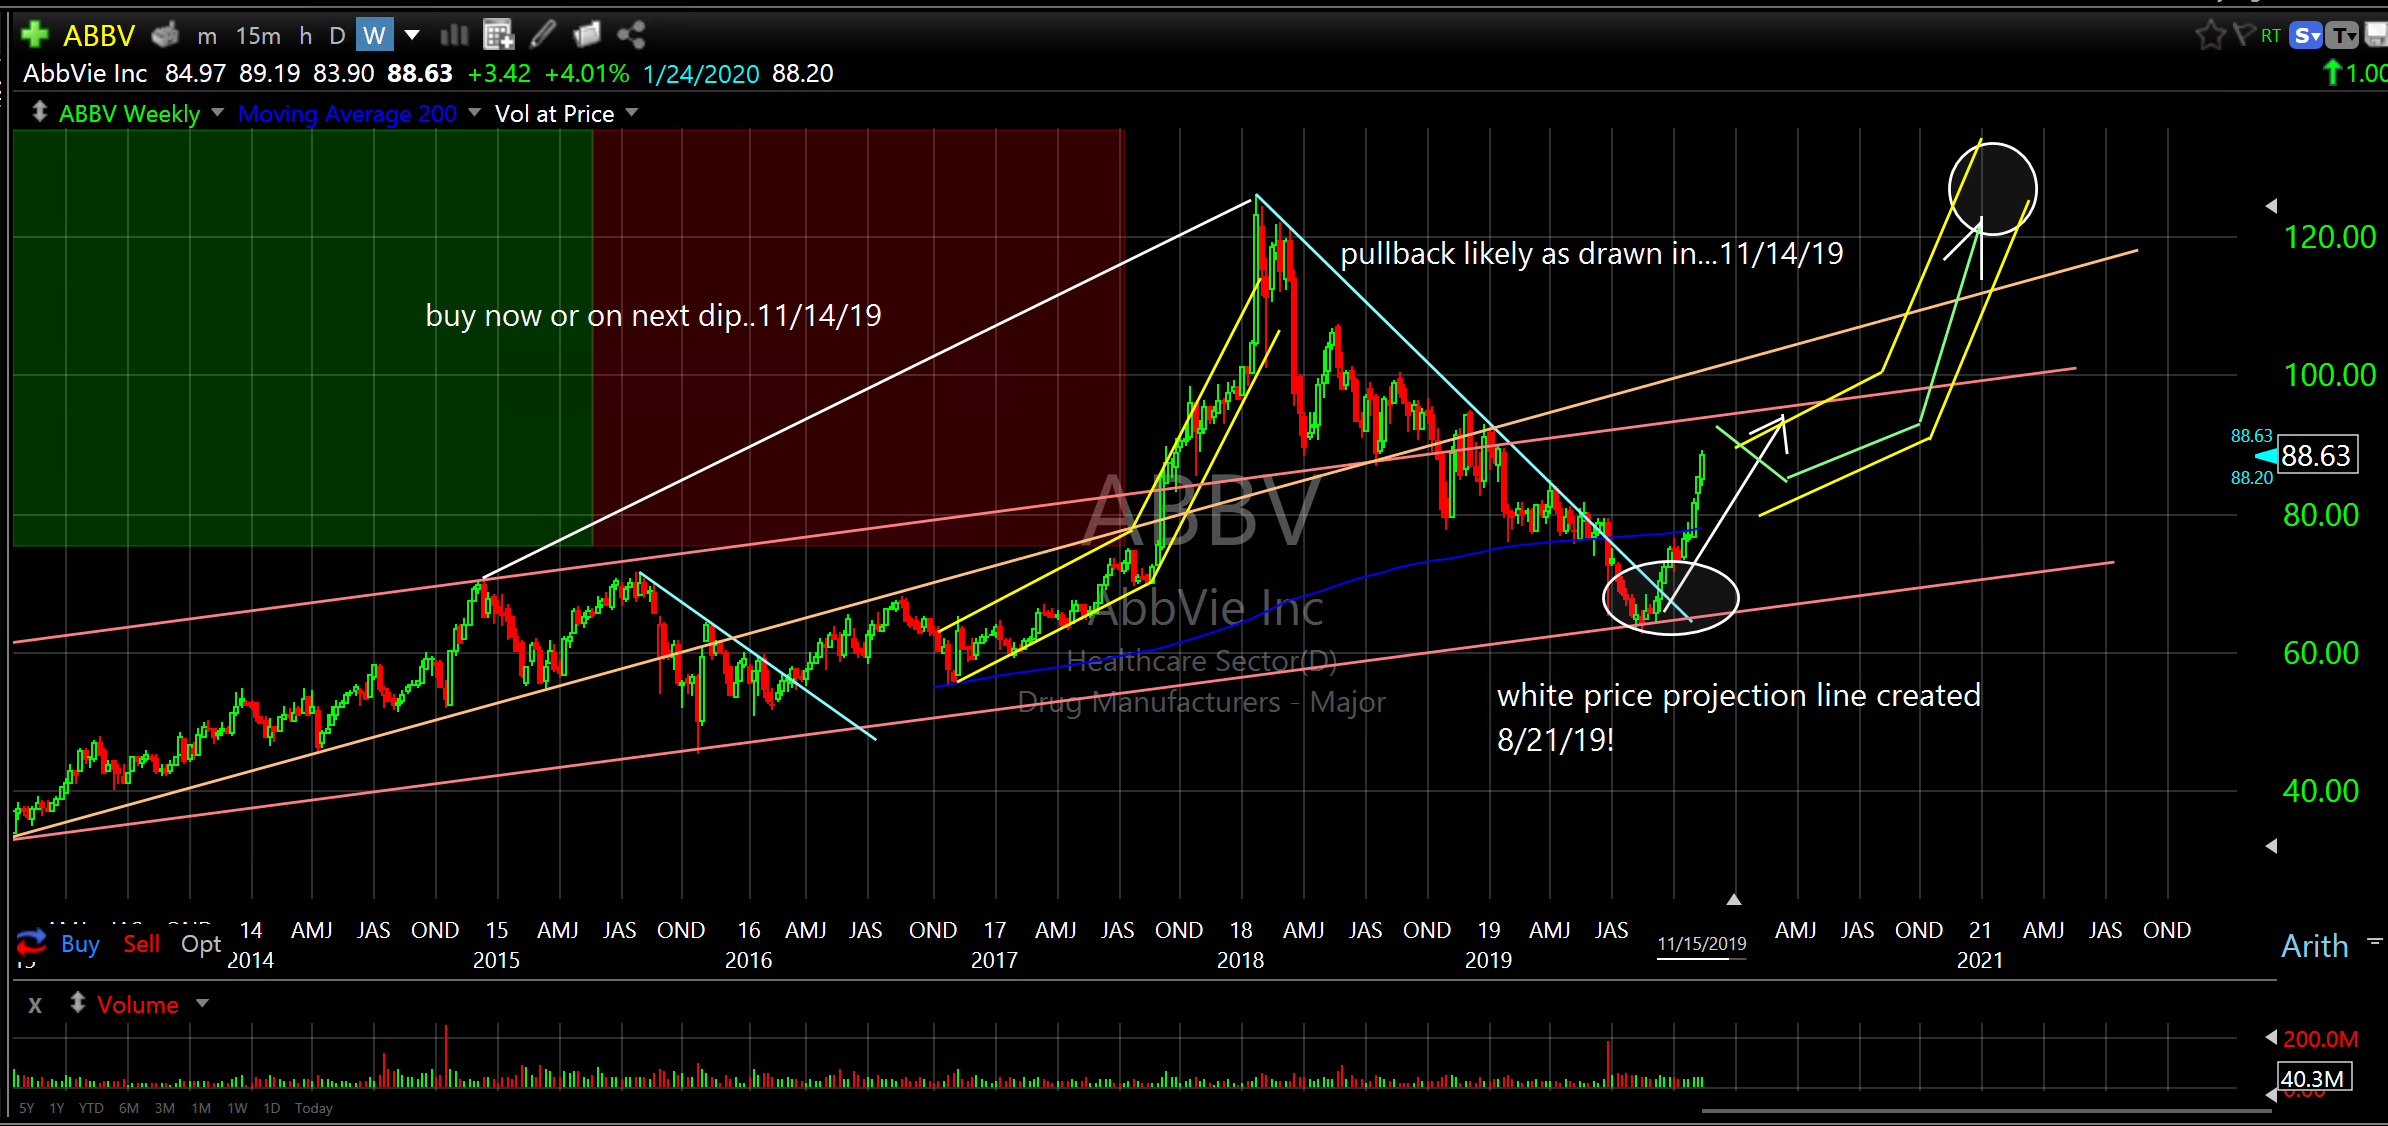
AbbVie Inc (ABBV) daily
This will be posted and archived on my website this week for reference and easier reading. There are approximately eight years of archived research, charts and trade performance on the website for your review.
Illuminating equity reversals to identify entries and exits, one chart at a time. Way beyond buy and hold.
Happy Monday!
Don