Broader Market Review
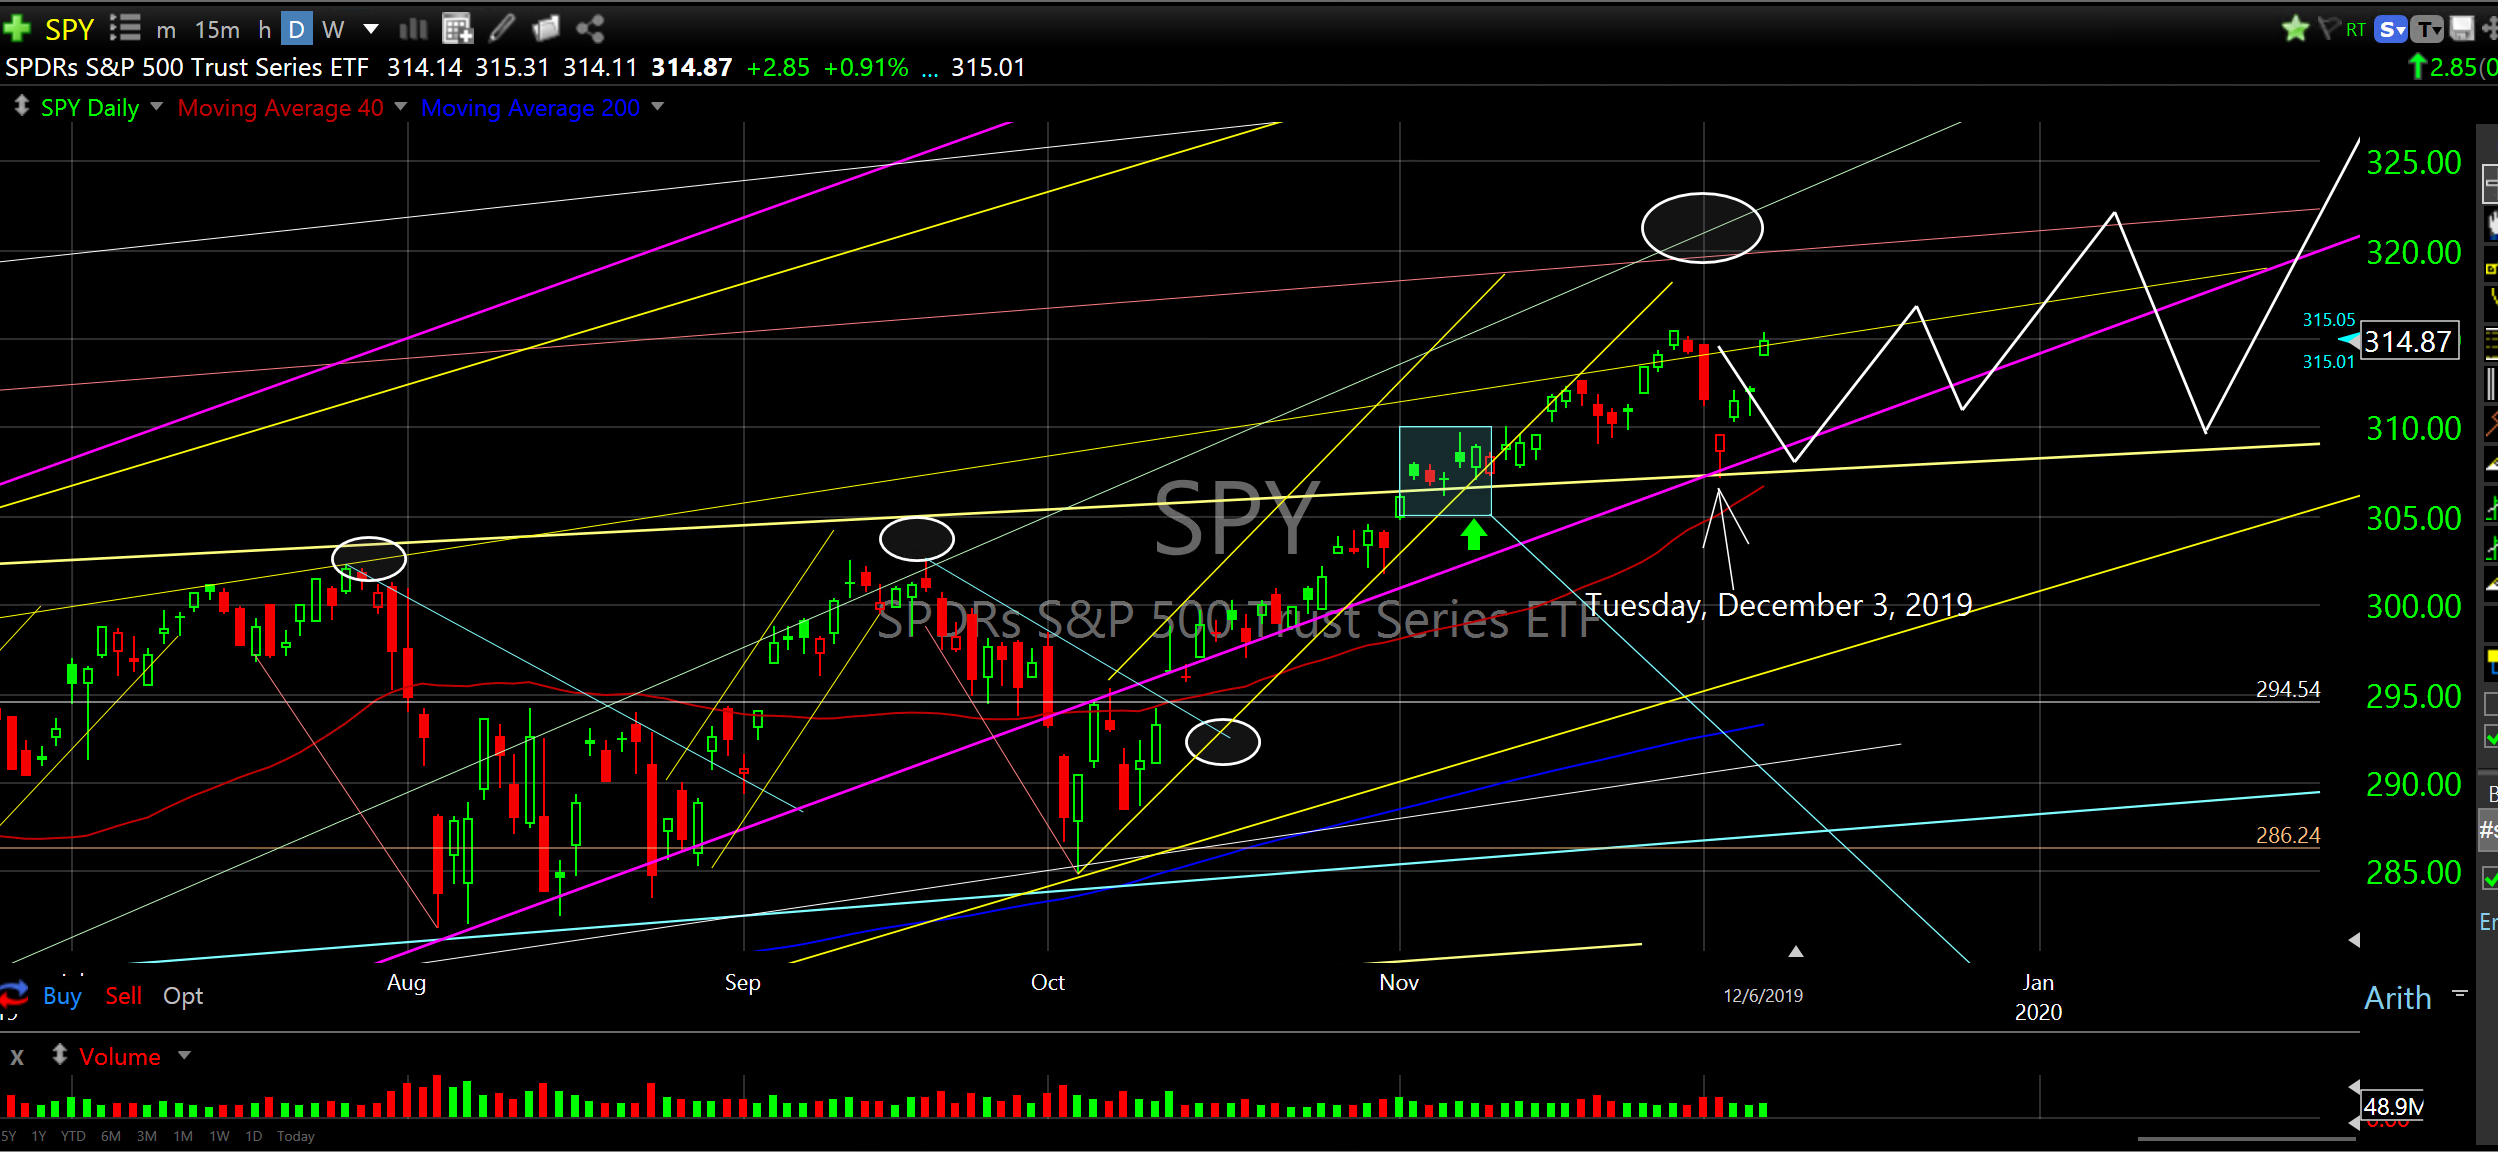
Broader market indexes, sectors, subsectors, bonds, and commodities are all behaving exactly as expected. They are positioned where they should be on an absolute and relative basis. The Dow, S&P 500 and Nasdaq have all released above, separated from and have now re-tested their 22-month resistance (yellow line that is now supported) with positive results. As you can see from the daily chart of SPY, the ETF for the S&P 500 index, as soon as price touched the yellow line (which was established in October 2018 as resistance) it didn’t just bounce; it was thrust higher with gusto as were the Dow and Nasdaq. This is precisely what we are looking for; strength off support, buyers stepping in at this level and Trump tweeting right on cue.
SPY
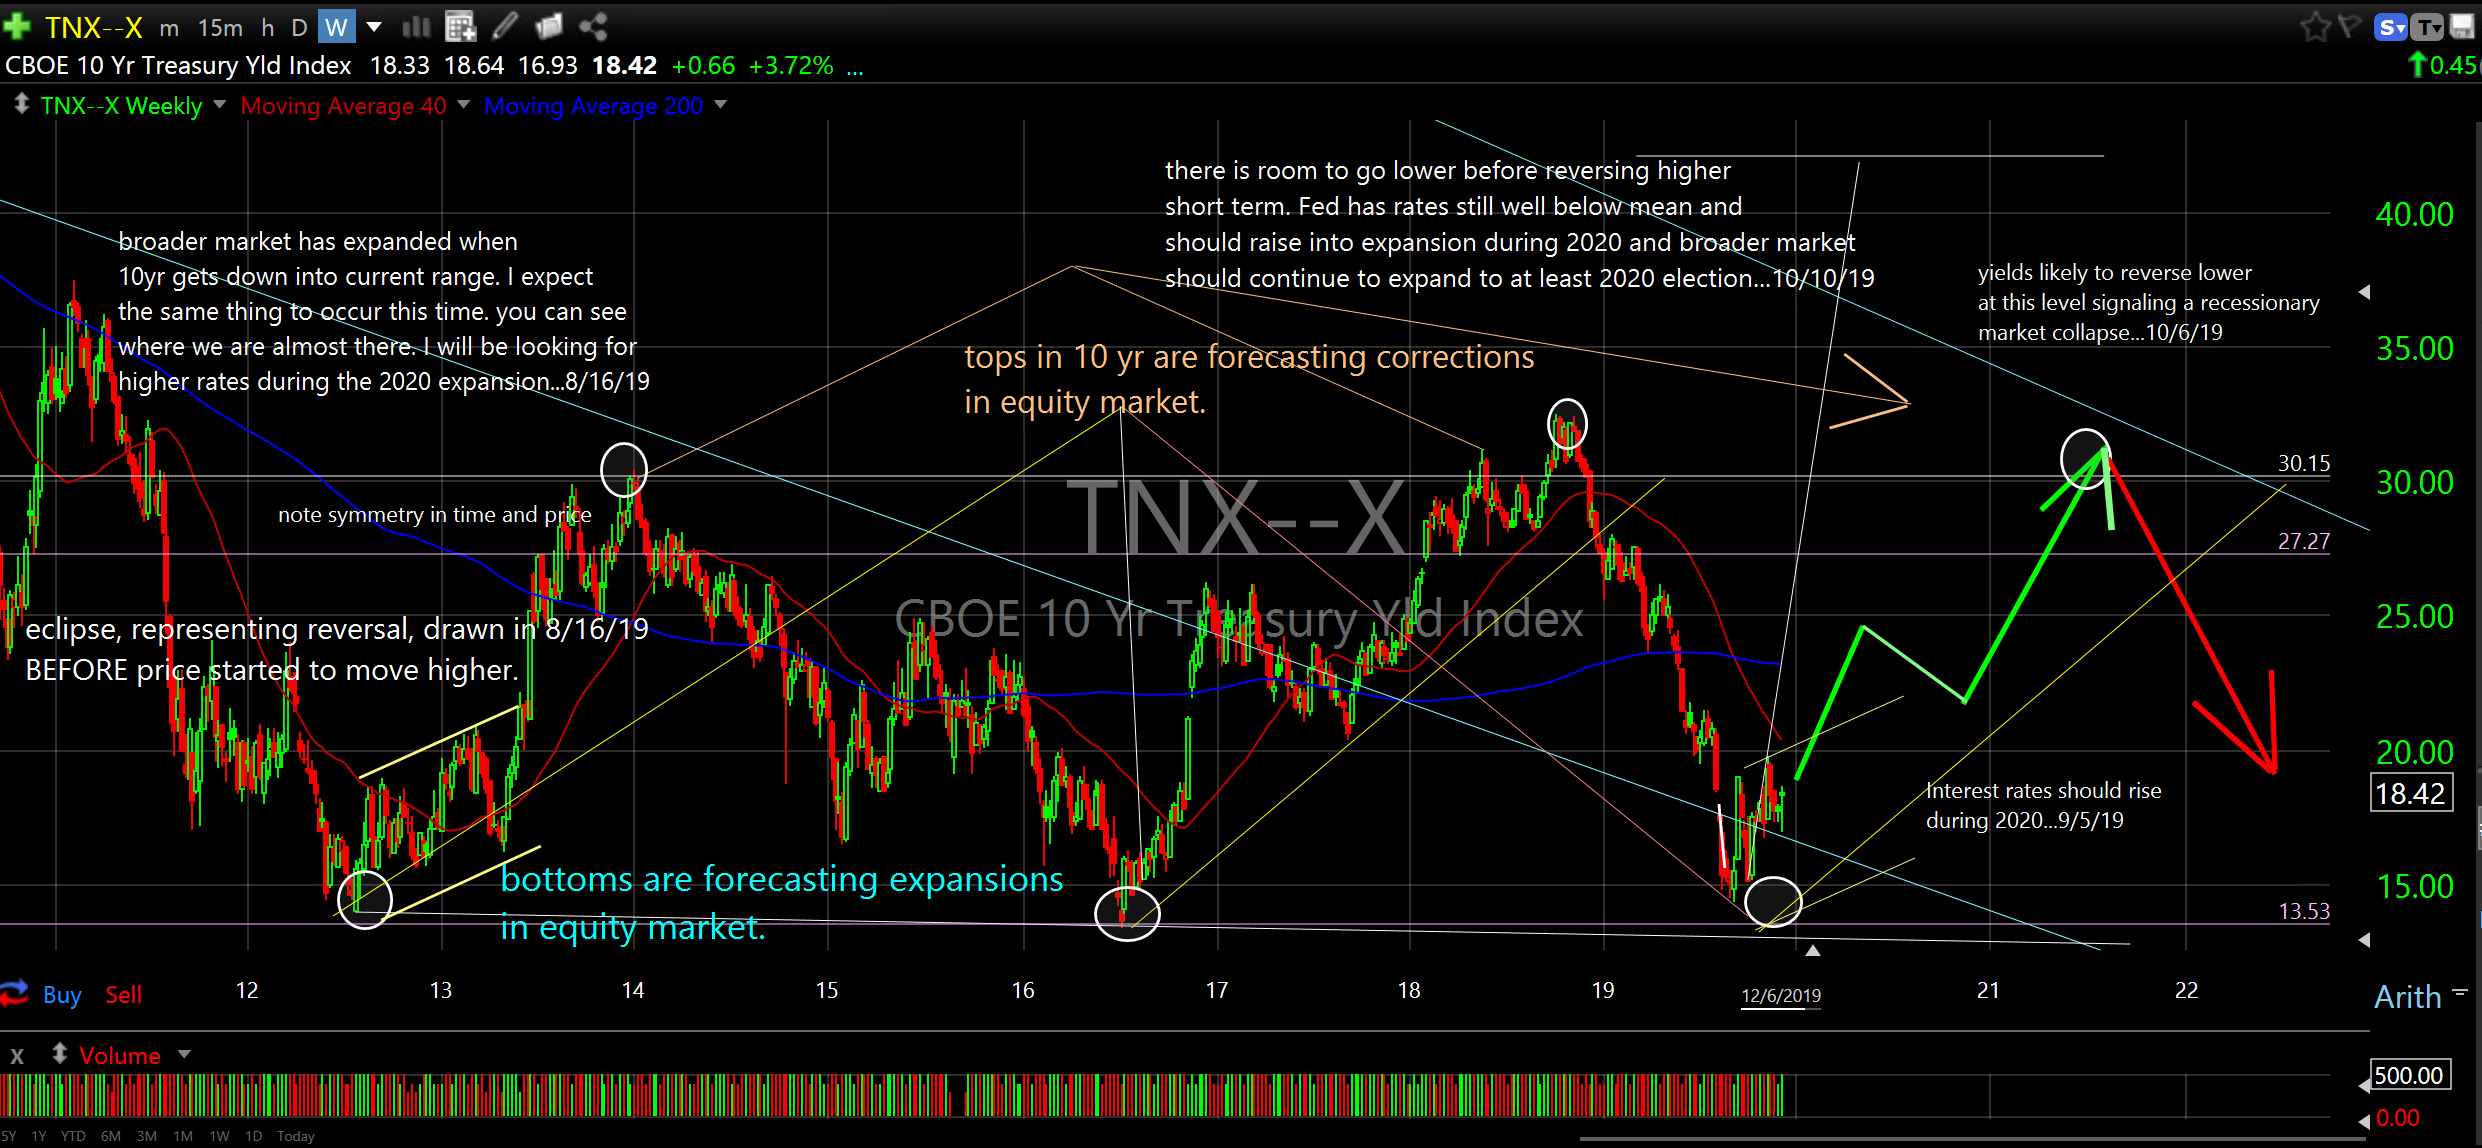
Yields should continue to drift higher as bond prices should fade during the 2020 equity expansion while gold and oil are likely to underperform during this time period. It all makes perfect sense. The expansion theme is playing out and hitting all the right notes. This is what I have been waiting for. This is what the current cycle positioning should look like. While there may be some choppy price action into February as the market absorbs the expansion thesis (think bewildered head-scratching on CNBC), this pause provides a perfect window of opportunity to begin pushing all the chips in while all of Goldman Sachs private equity clients prepare for a recession.
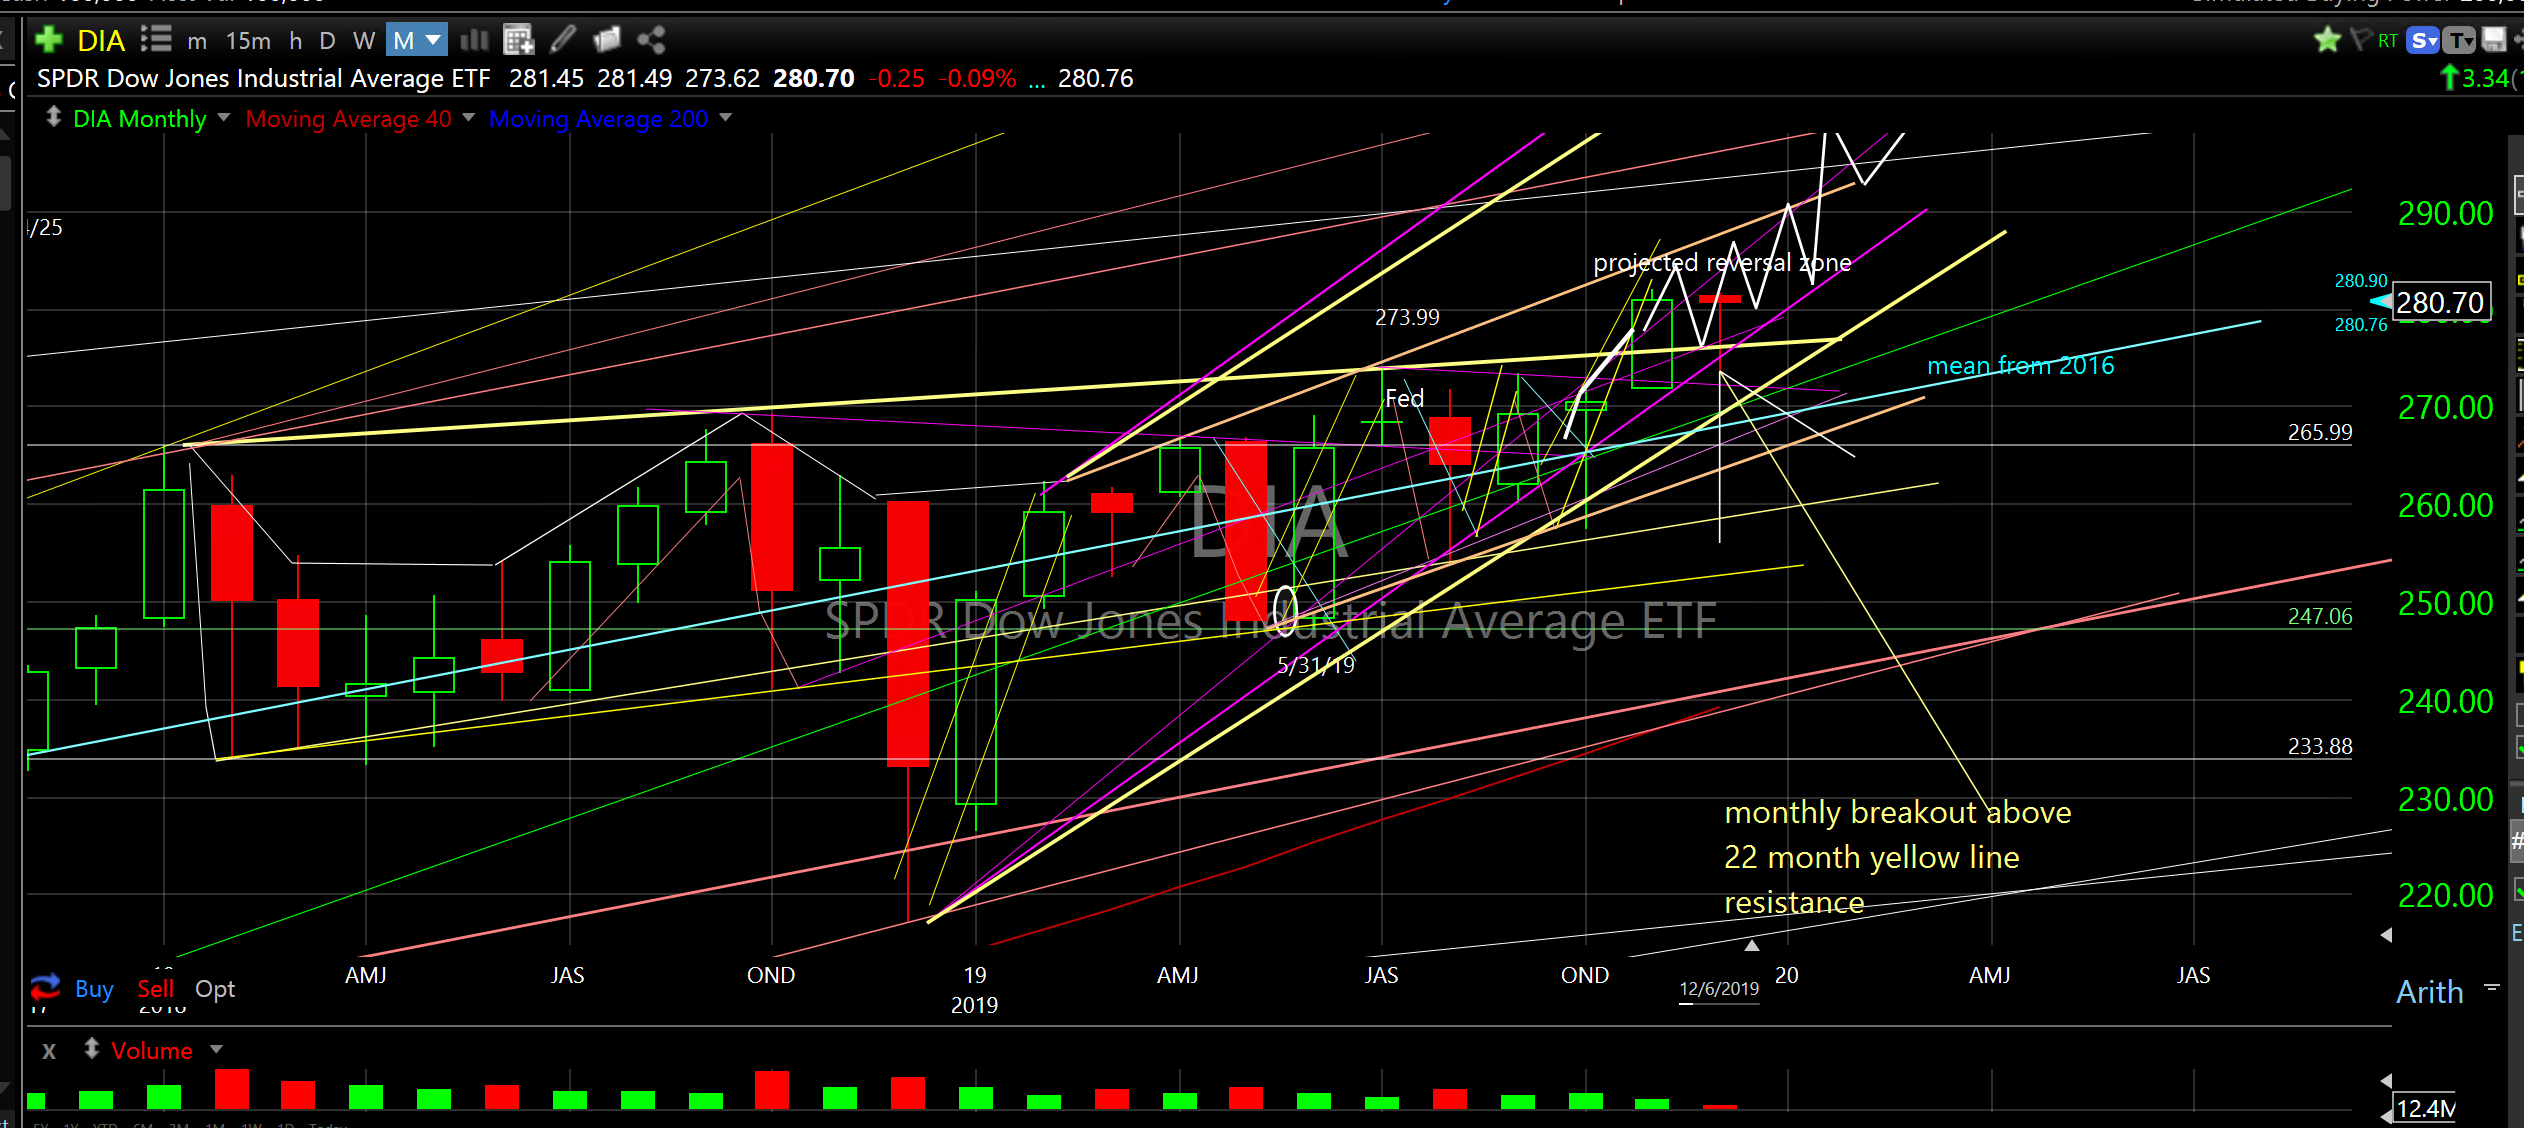
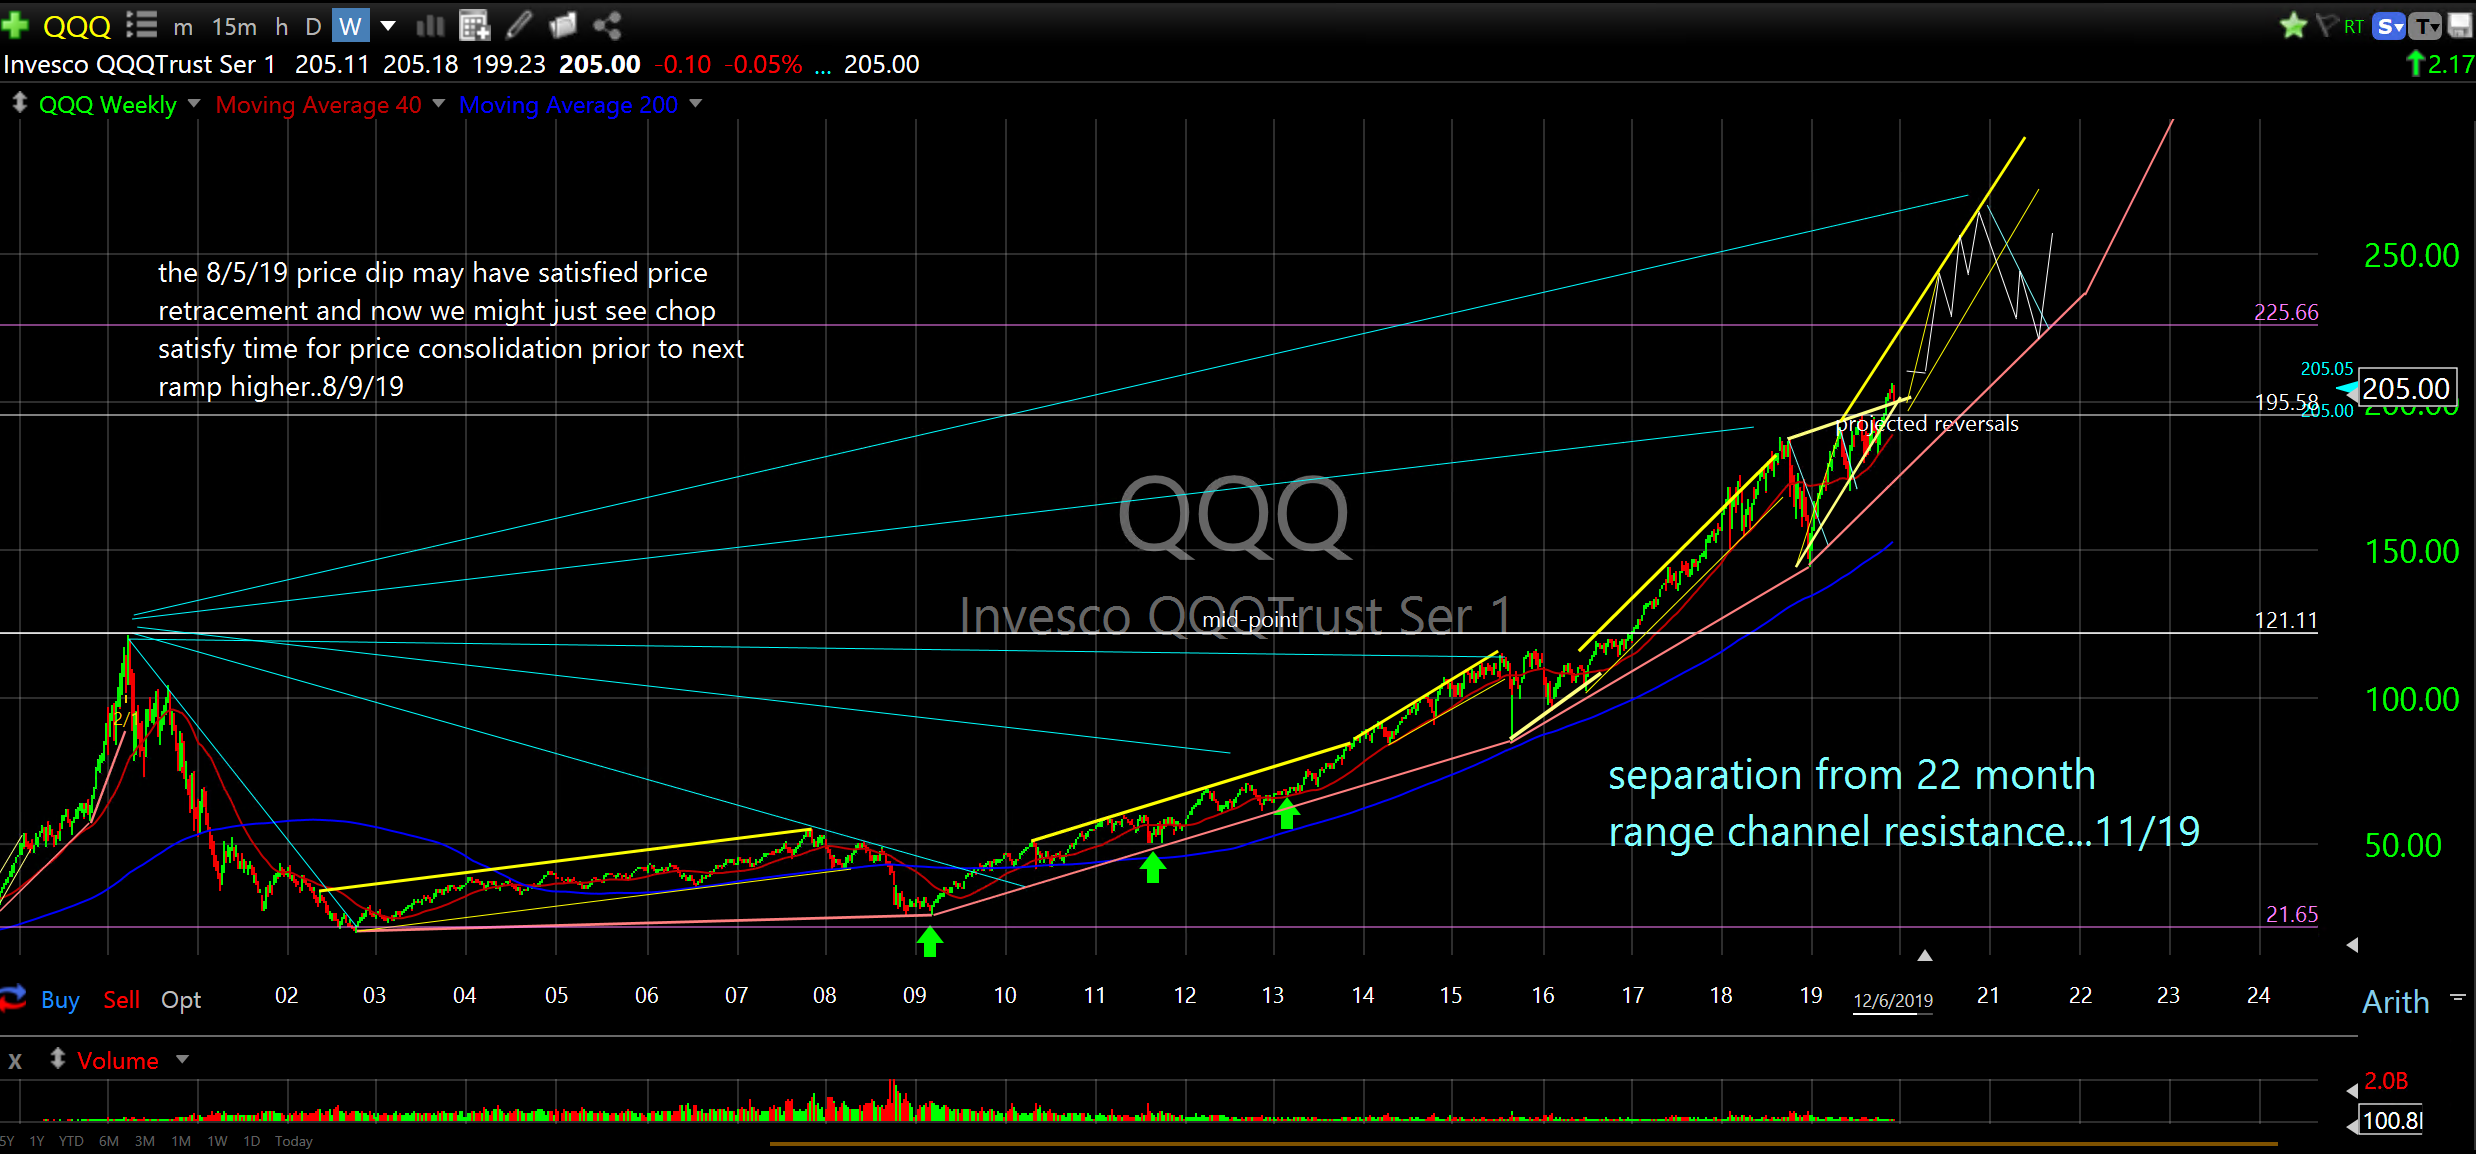
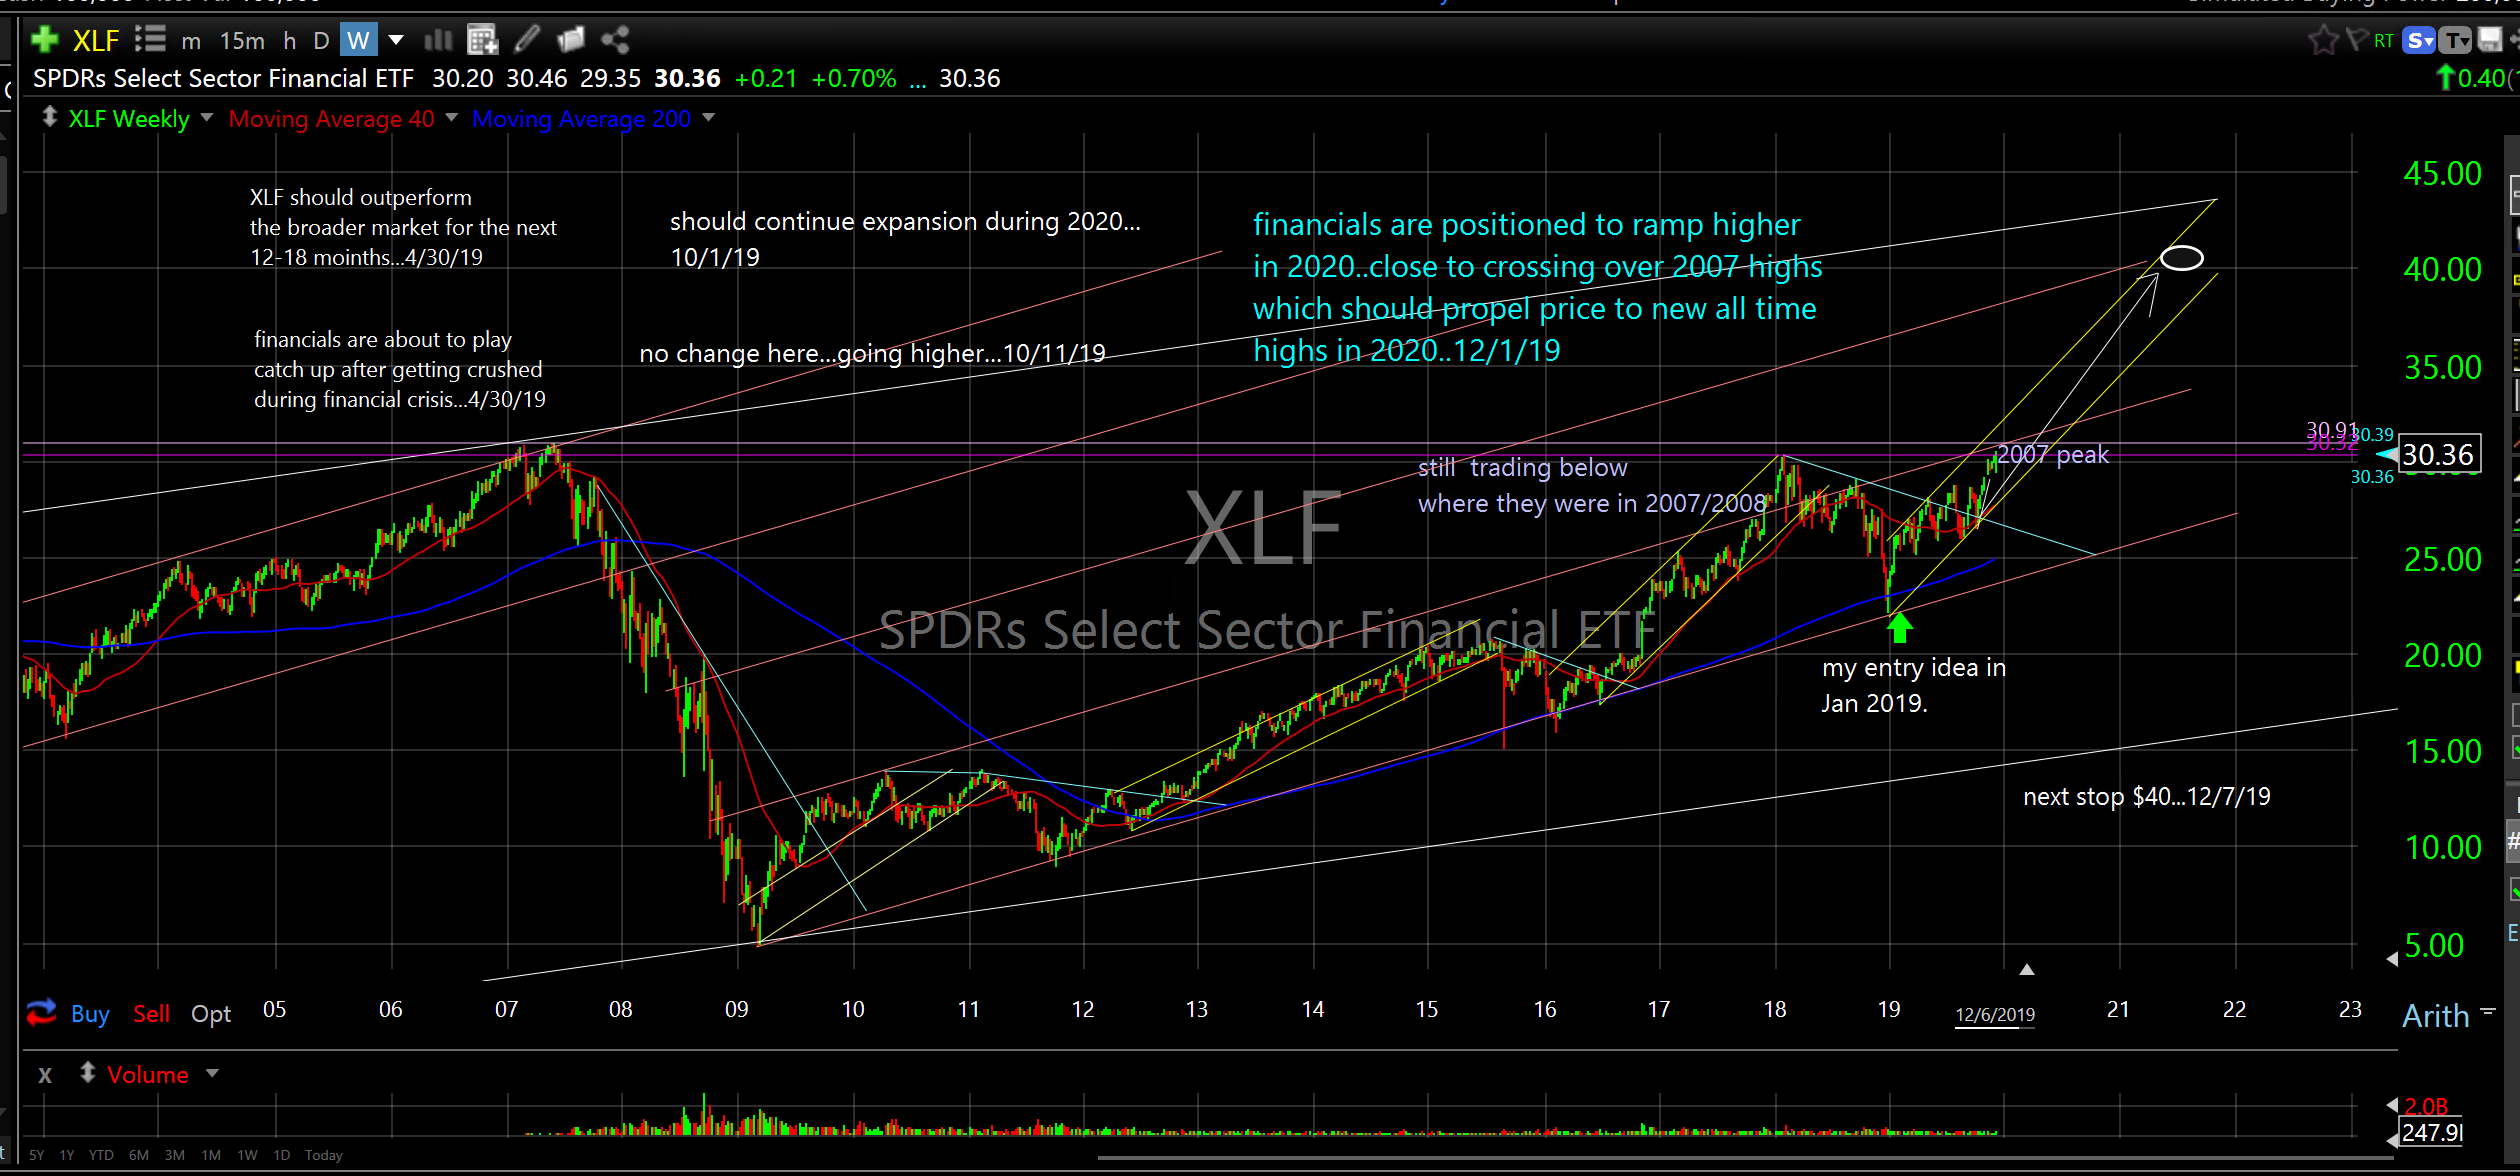
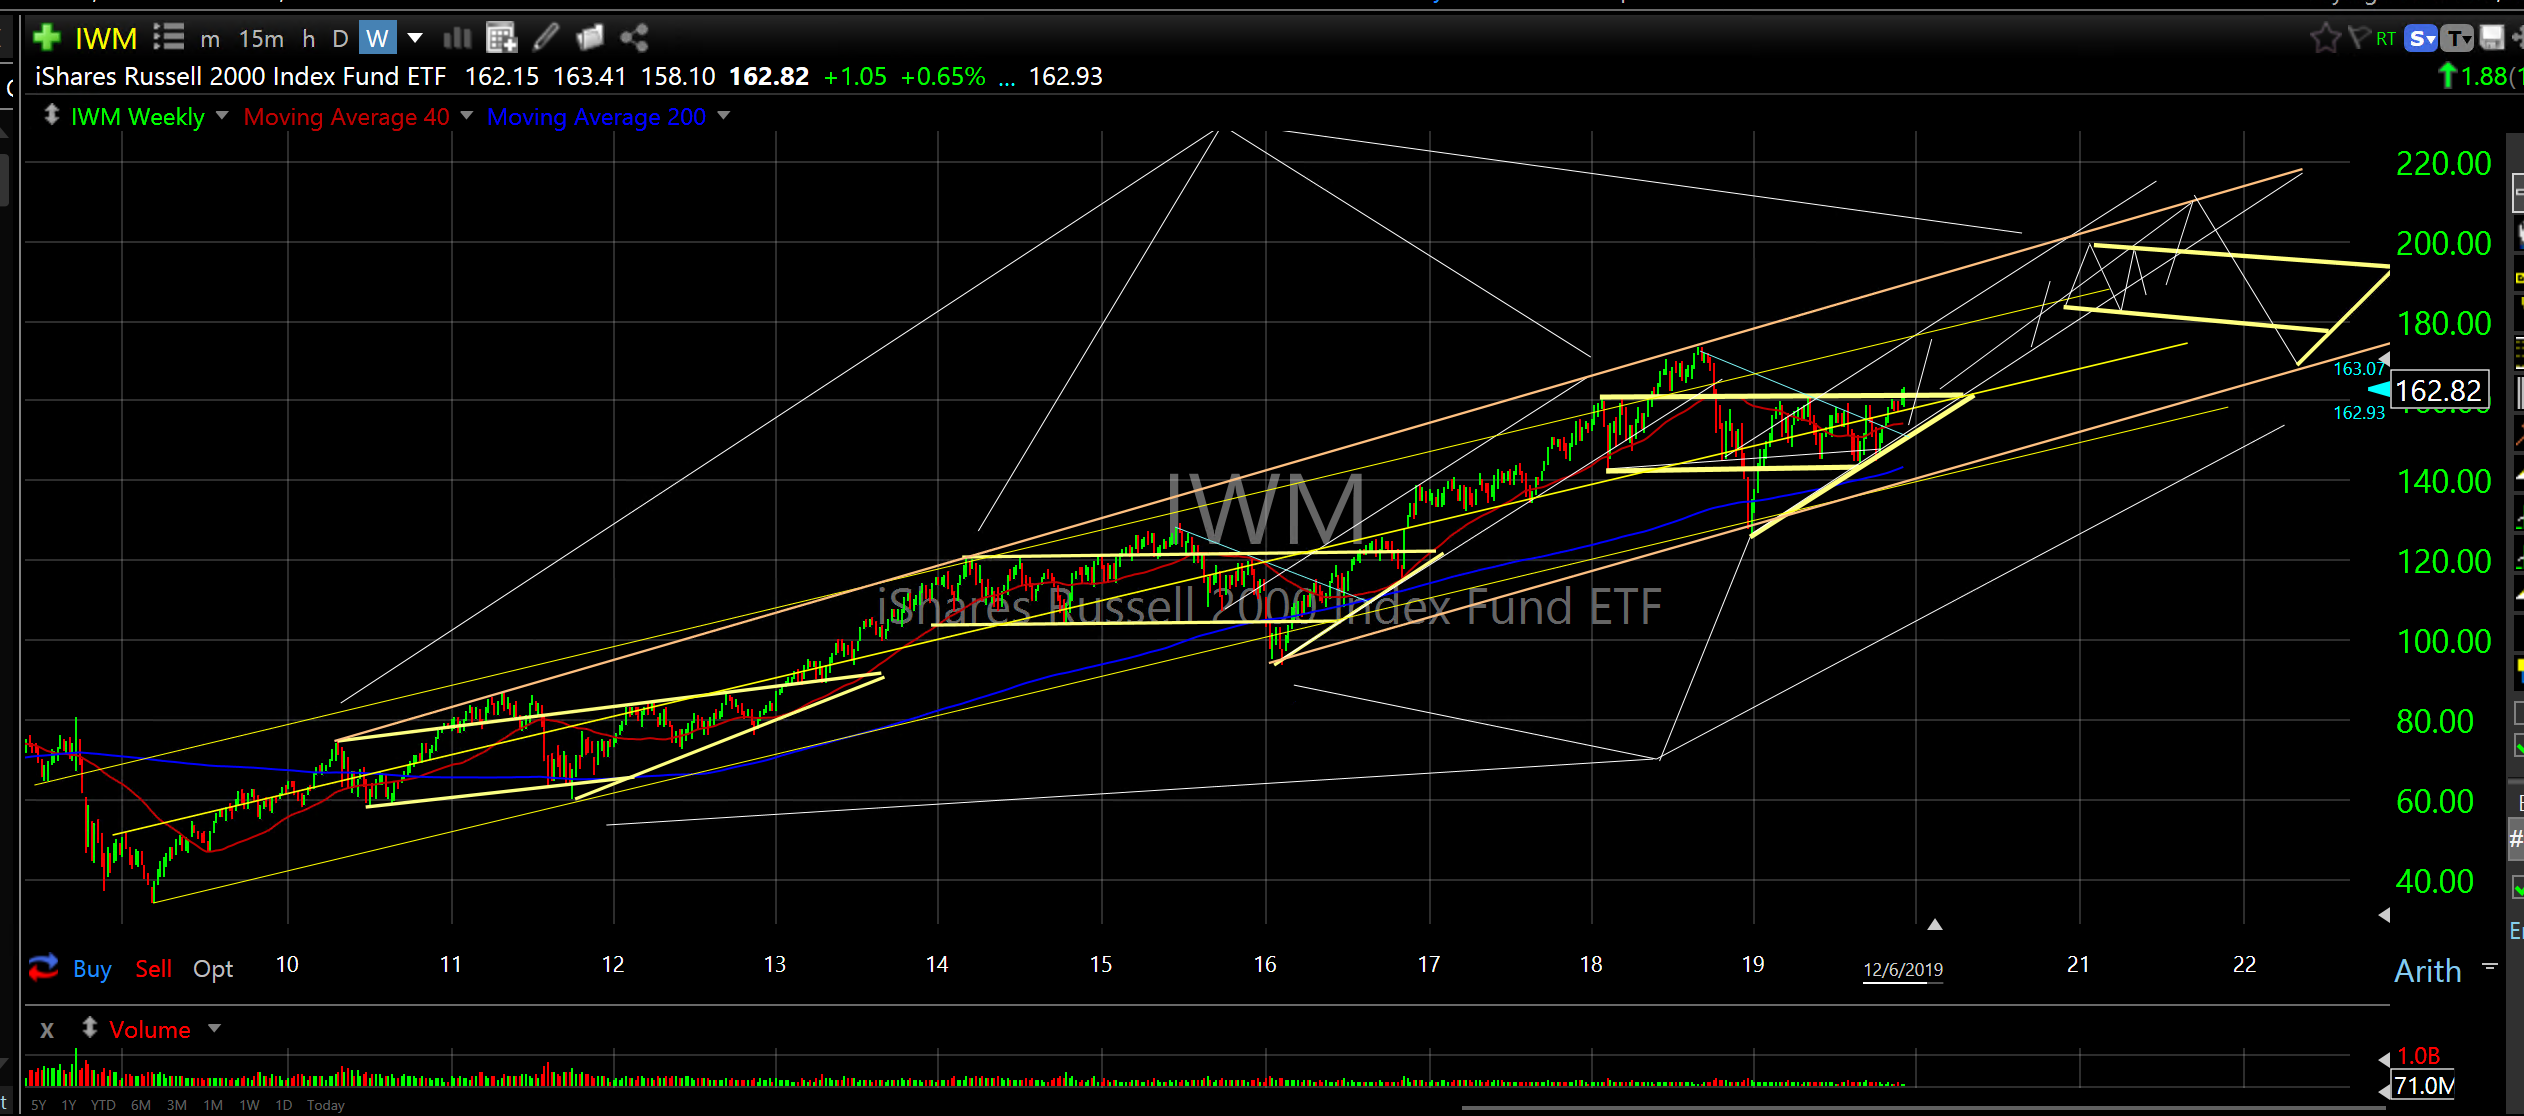
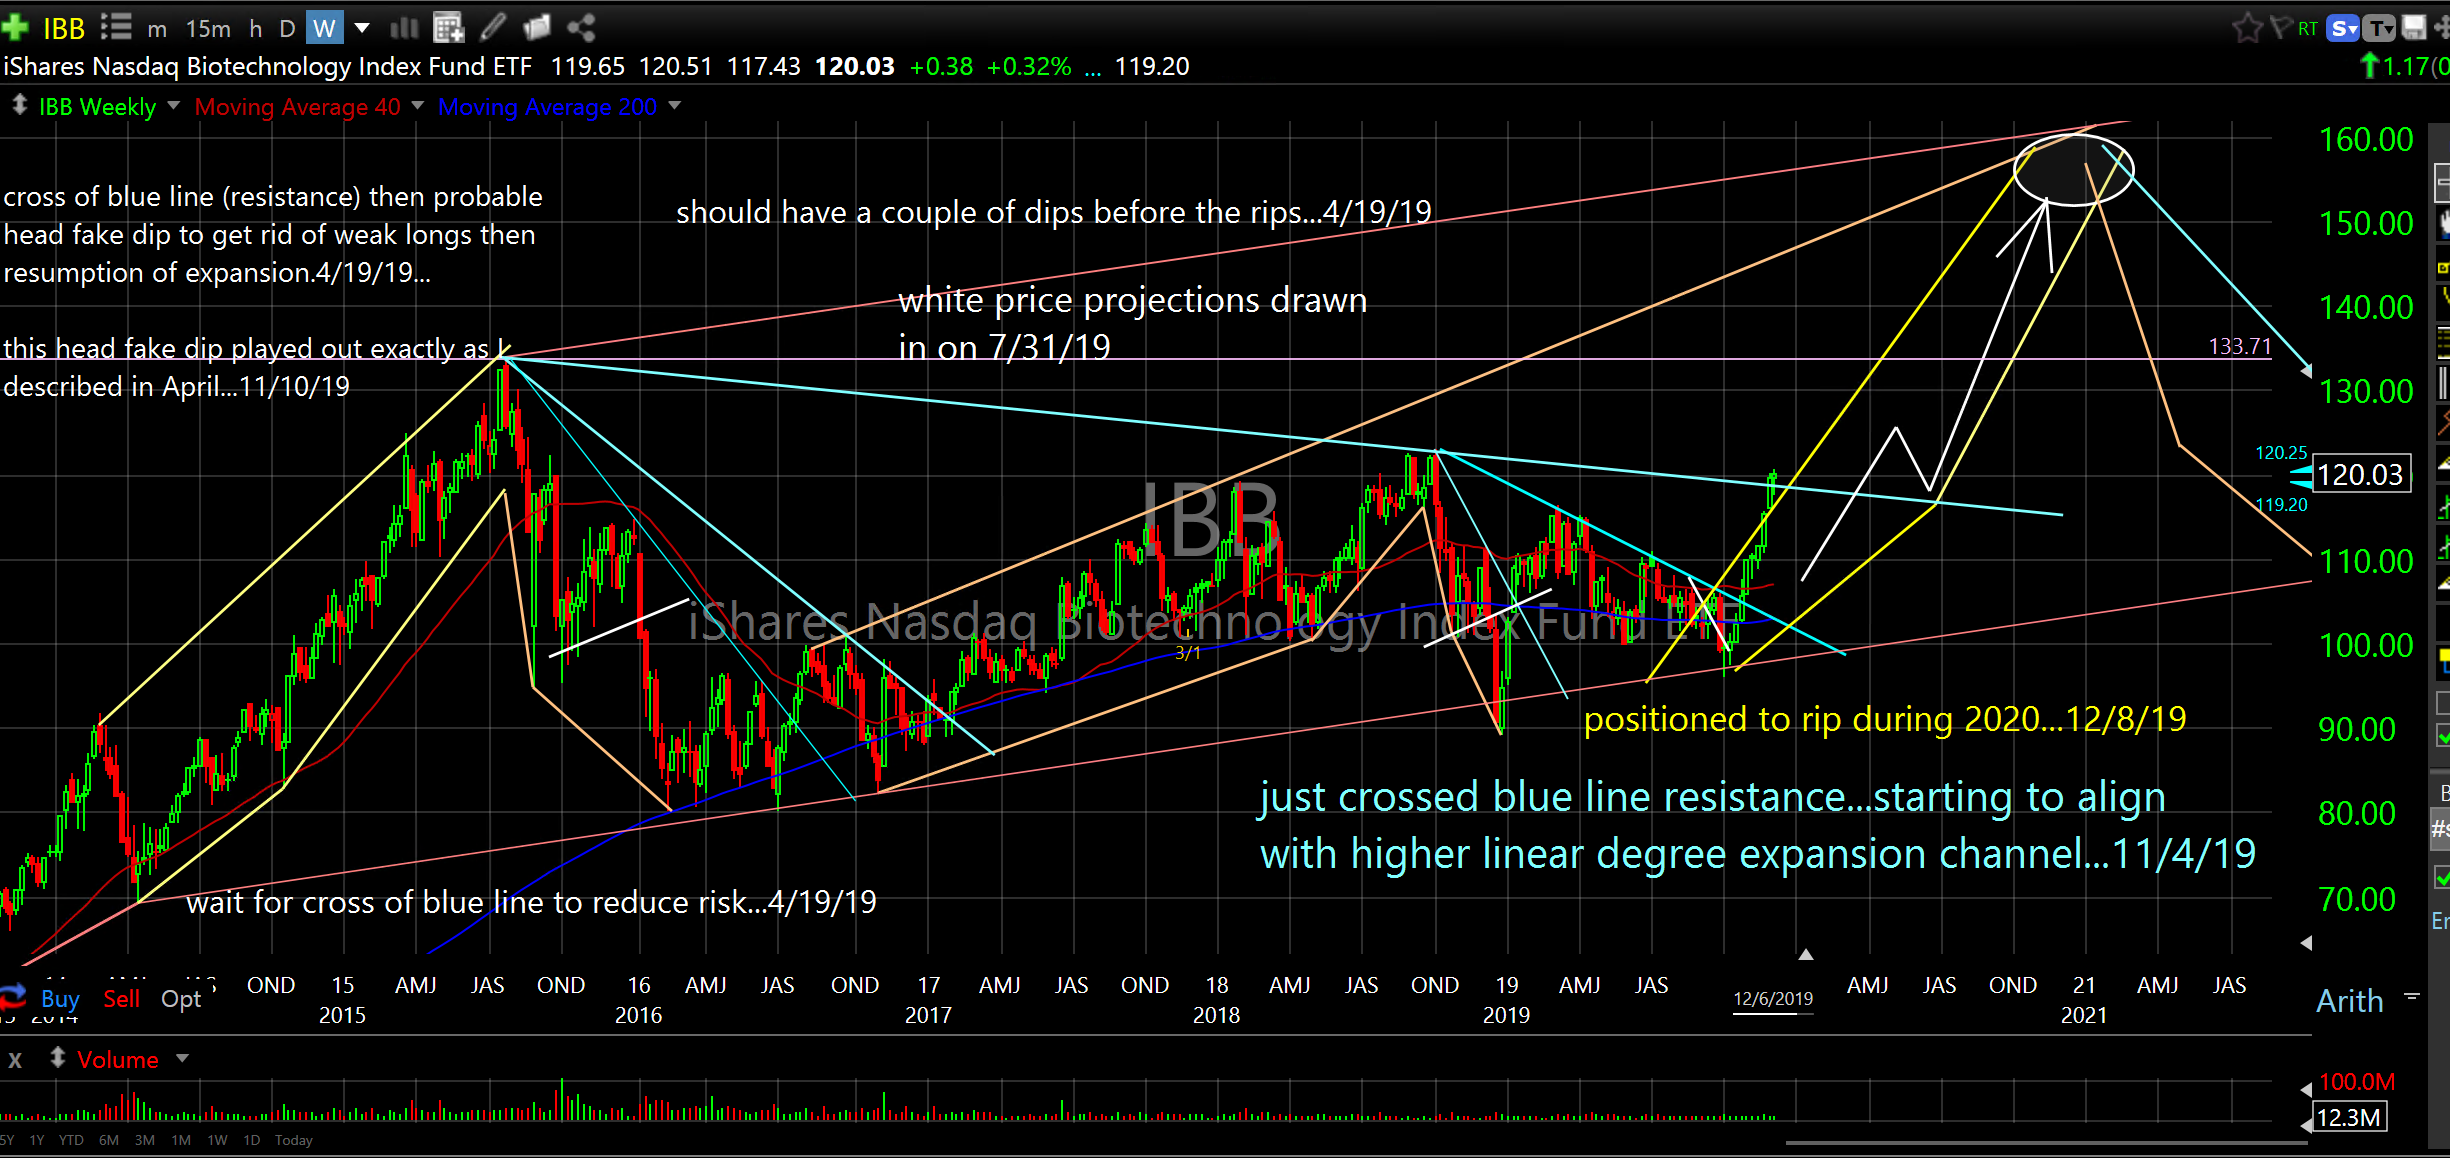
The charts below identify cycle rotation, channel alignment, and relative positioning. Let the charts be your guide. Note the cycle repetition in the longer time frame QQQ chart. Look at the monthly breakout above the yellow line resistance in the DIA chart. Look at the reversal off the bottom in the 10 Year Treasury Yield Index chart that I drew in on August 16th, a full month BEFORE it happened. Look at the financial sector index ETF (XLF). It is less than 2% from its’ all-time peak made in 2007 and just closed above its previous high made in early 2018. Do you think it will get rejected here again with every one of the broader market proxies making new highs? I don’t think so. This sector should rock during 2020 (see last week’s post); it has some serious catching up to do. What about small caps? They are right where they should be as well. All this talk in Medialand about small caps (IWM) not making new highs is rubbish. They always lag at this stage in the cycle. They will catch up just like they always do. All of the components are right where they should be, even Biotechs. Biotechs, by nature, are risky and volatile but…they are positioned to just rip in 2020. I know, they haven’t made a new high since 2015, however, they just broke secondary resistance and look how high they want to run. Just wait.
Please take your seats, the play is about to begin.
DIA
QQQ
TNX-X
XLF
IWM
IBB
Technology Sector…Software Application/Infrastructure
There is so much right about current market conditions it feels like Christmas. Would you like to unwrap some presents?
I went shopping all week in the Stockmarketland Mall. Lots of good sales going on, especially at Techland Store. Want to see what I found?
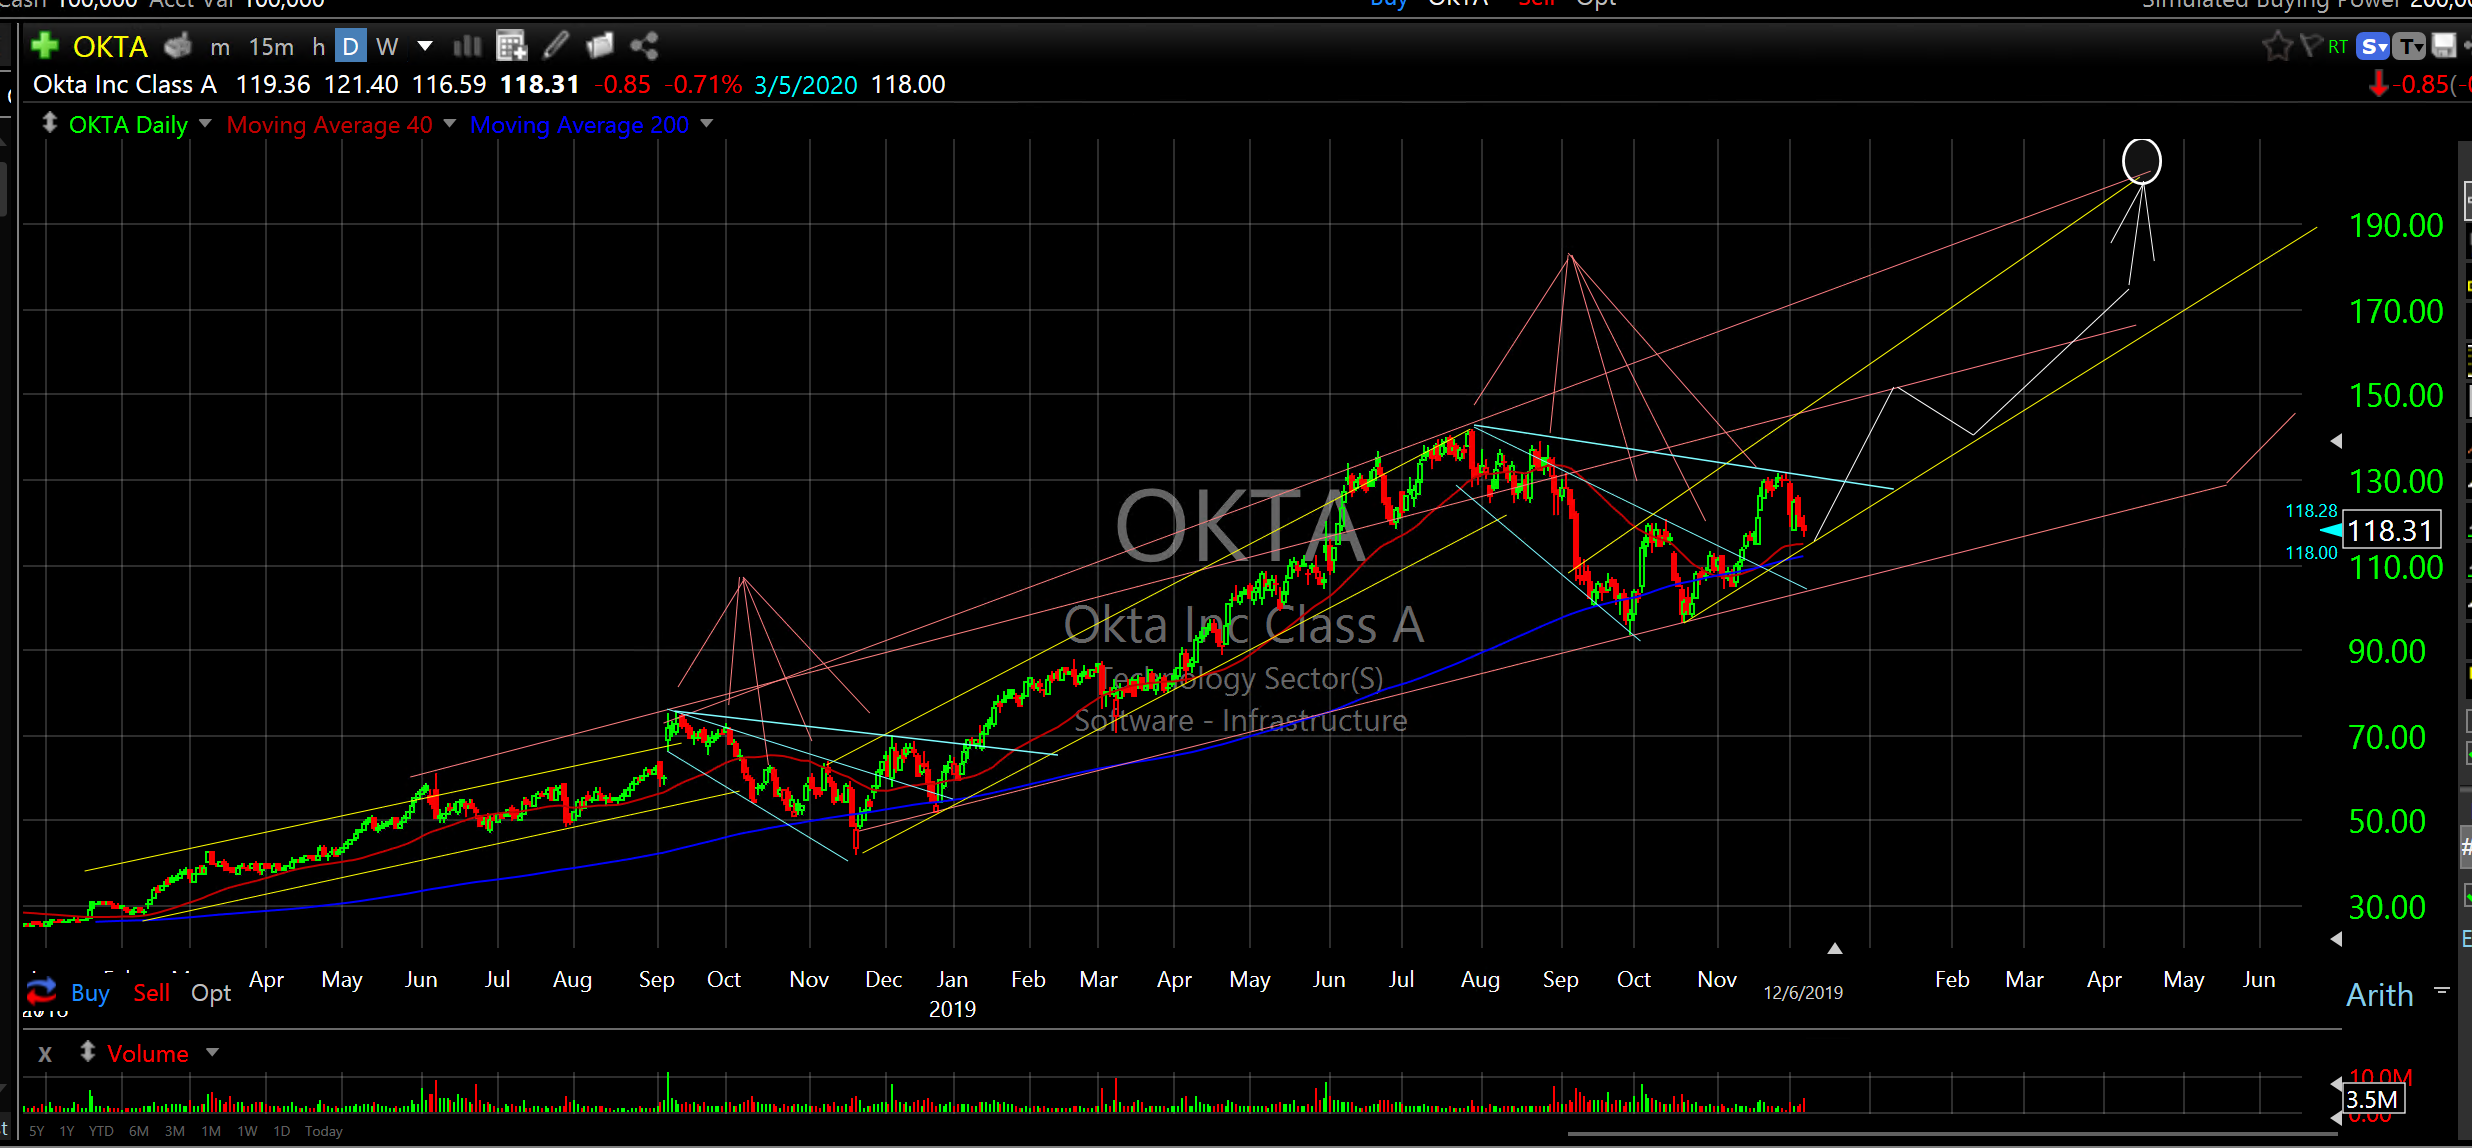
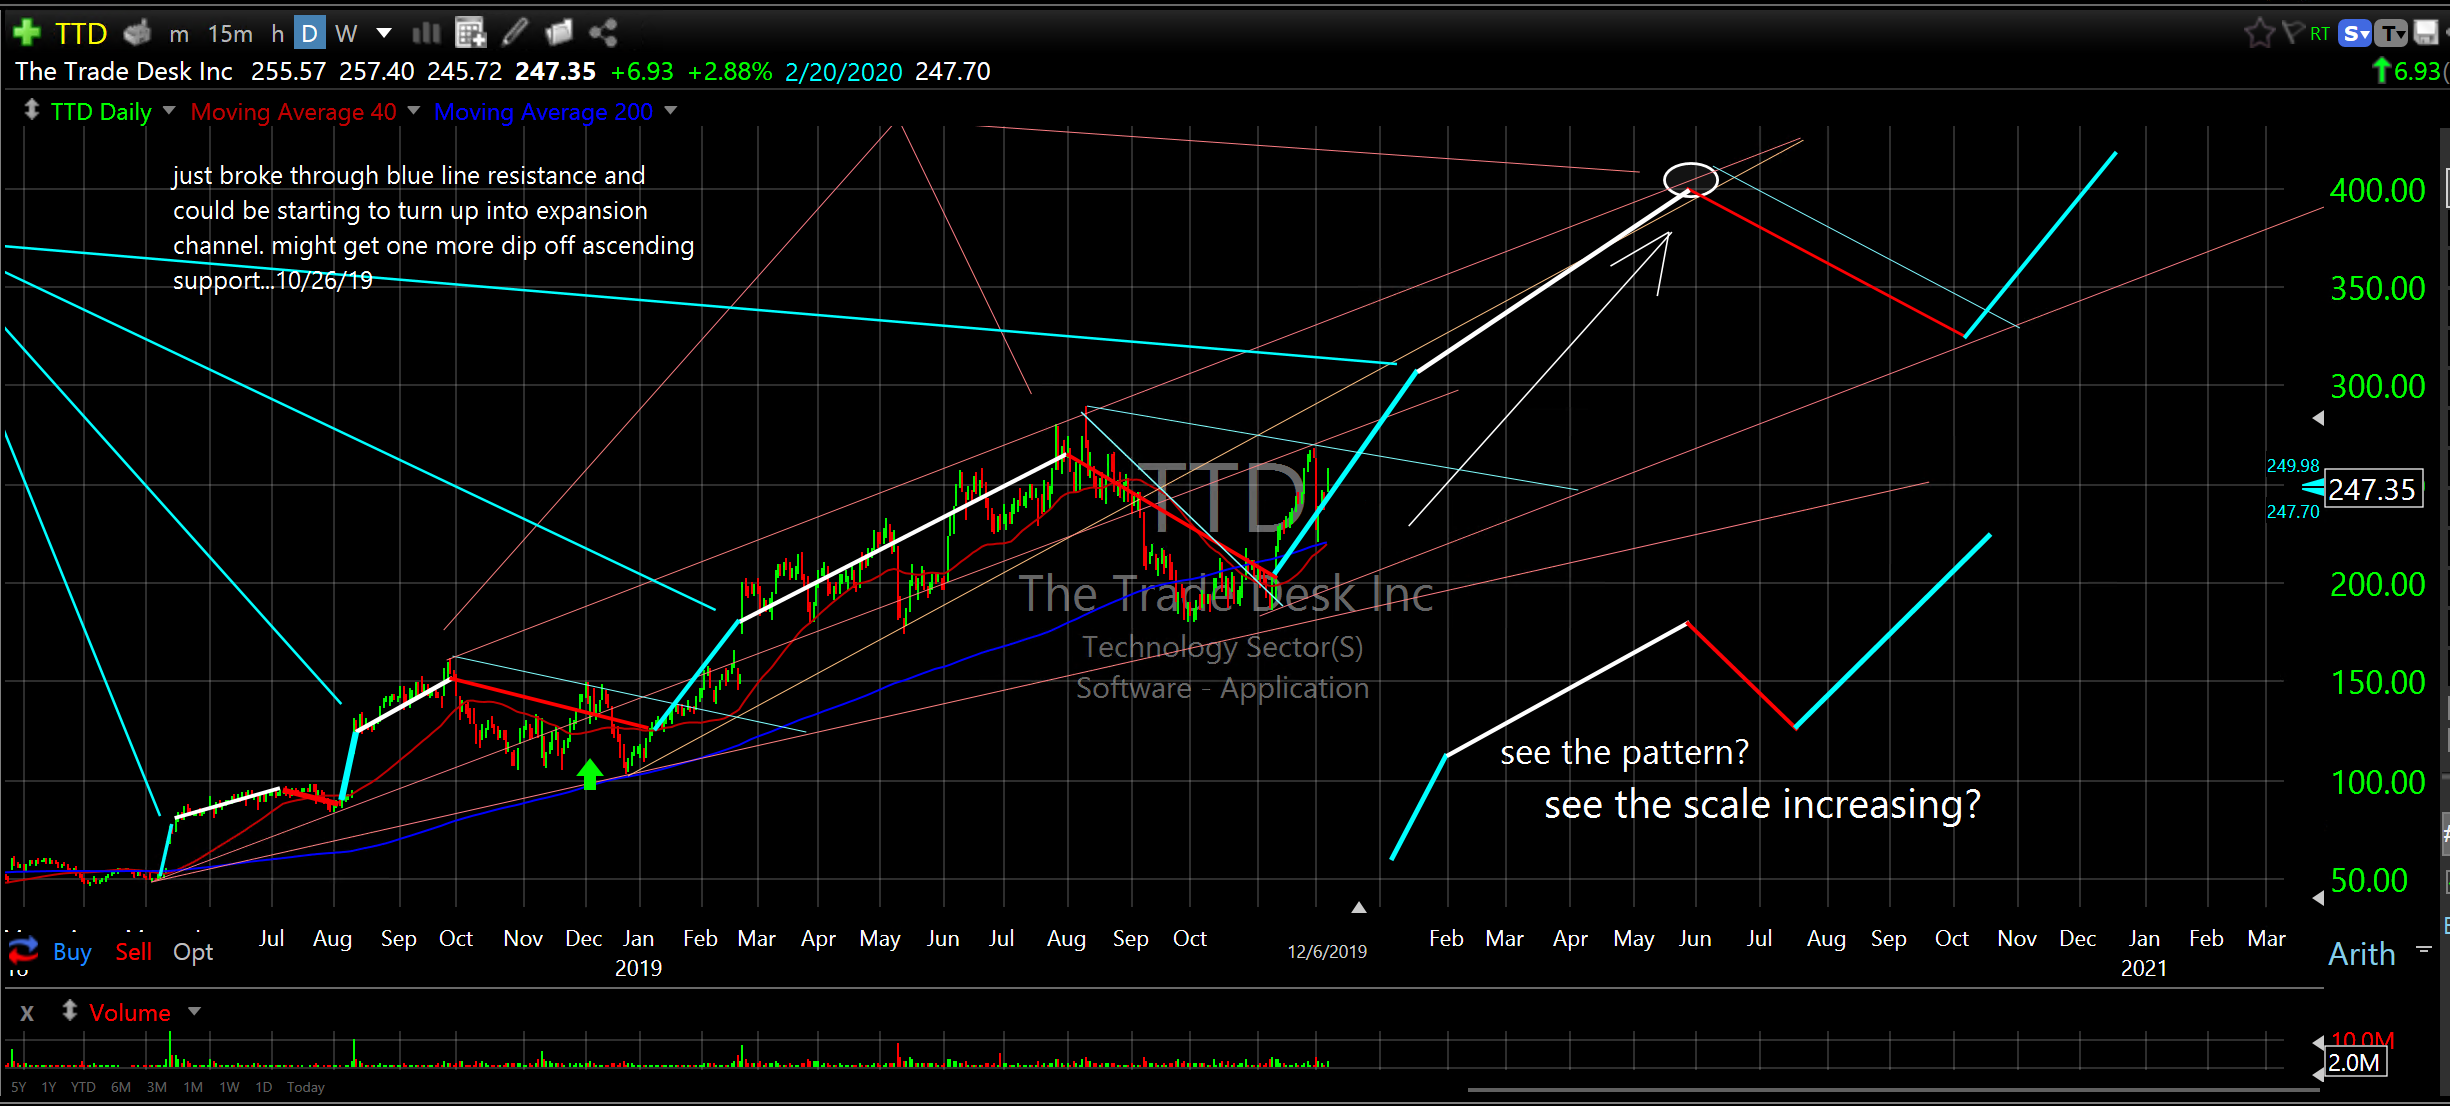
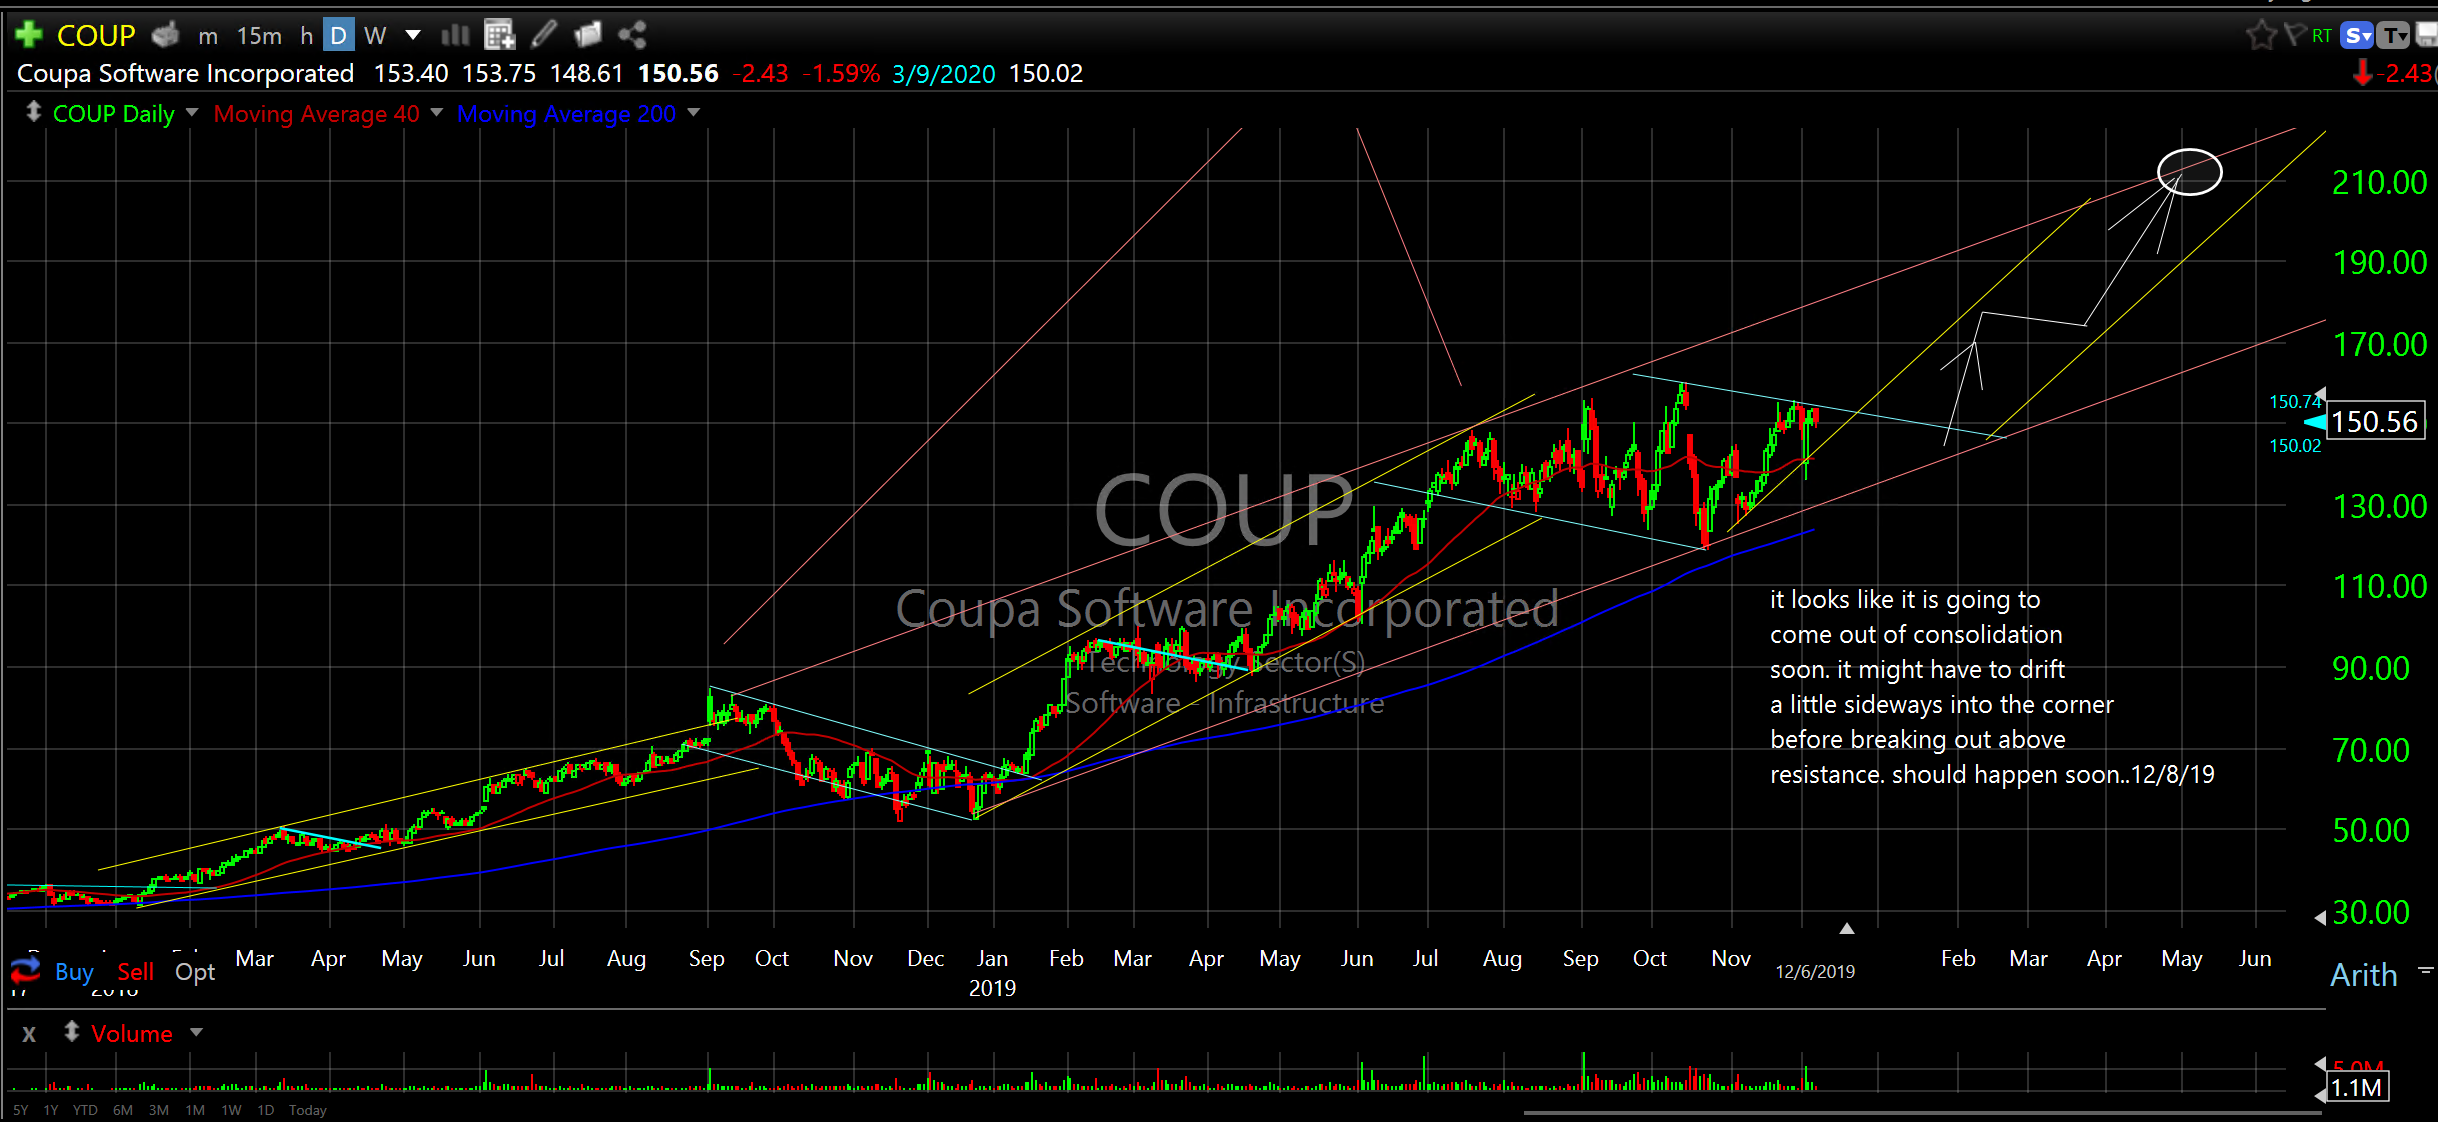
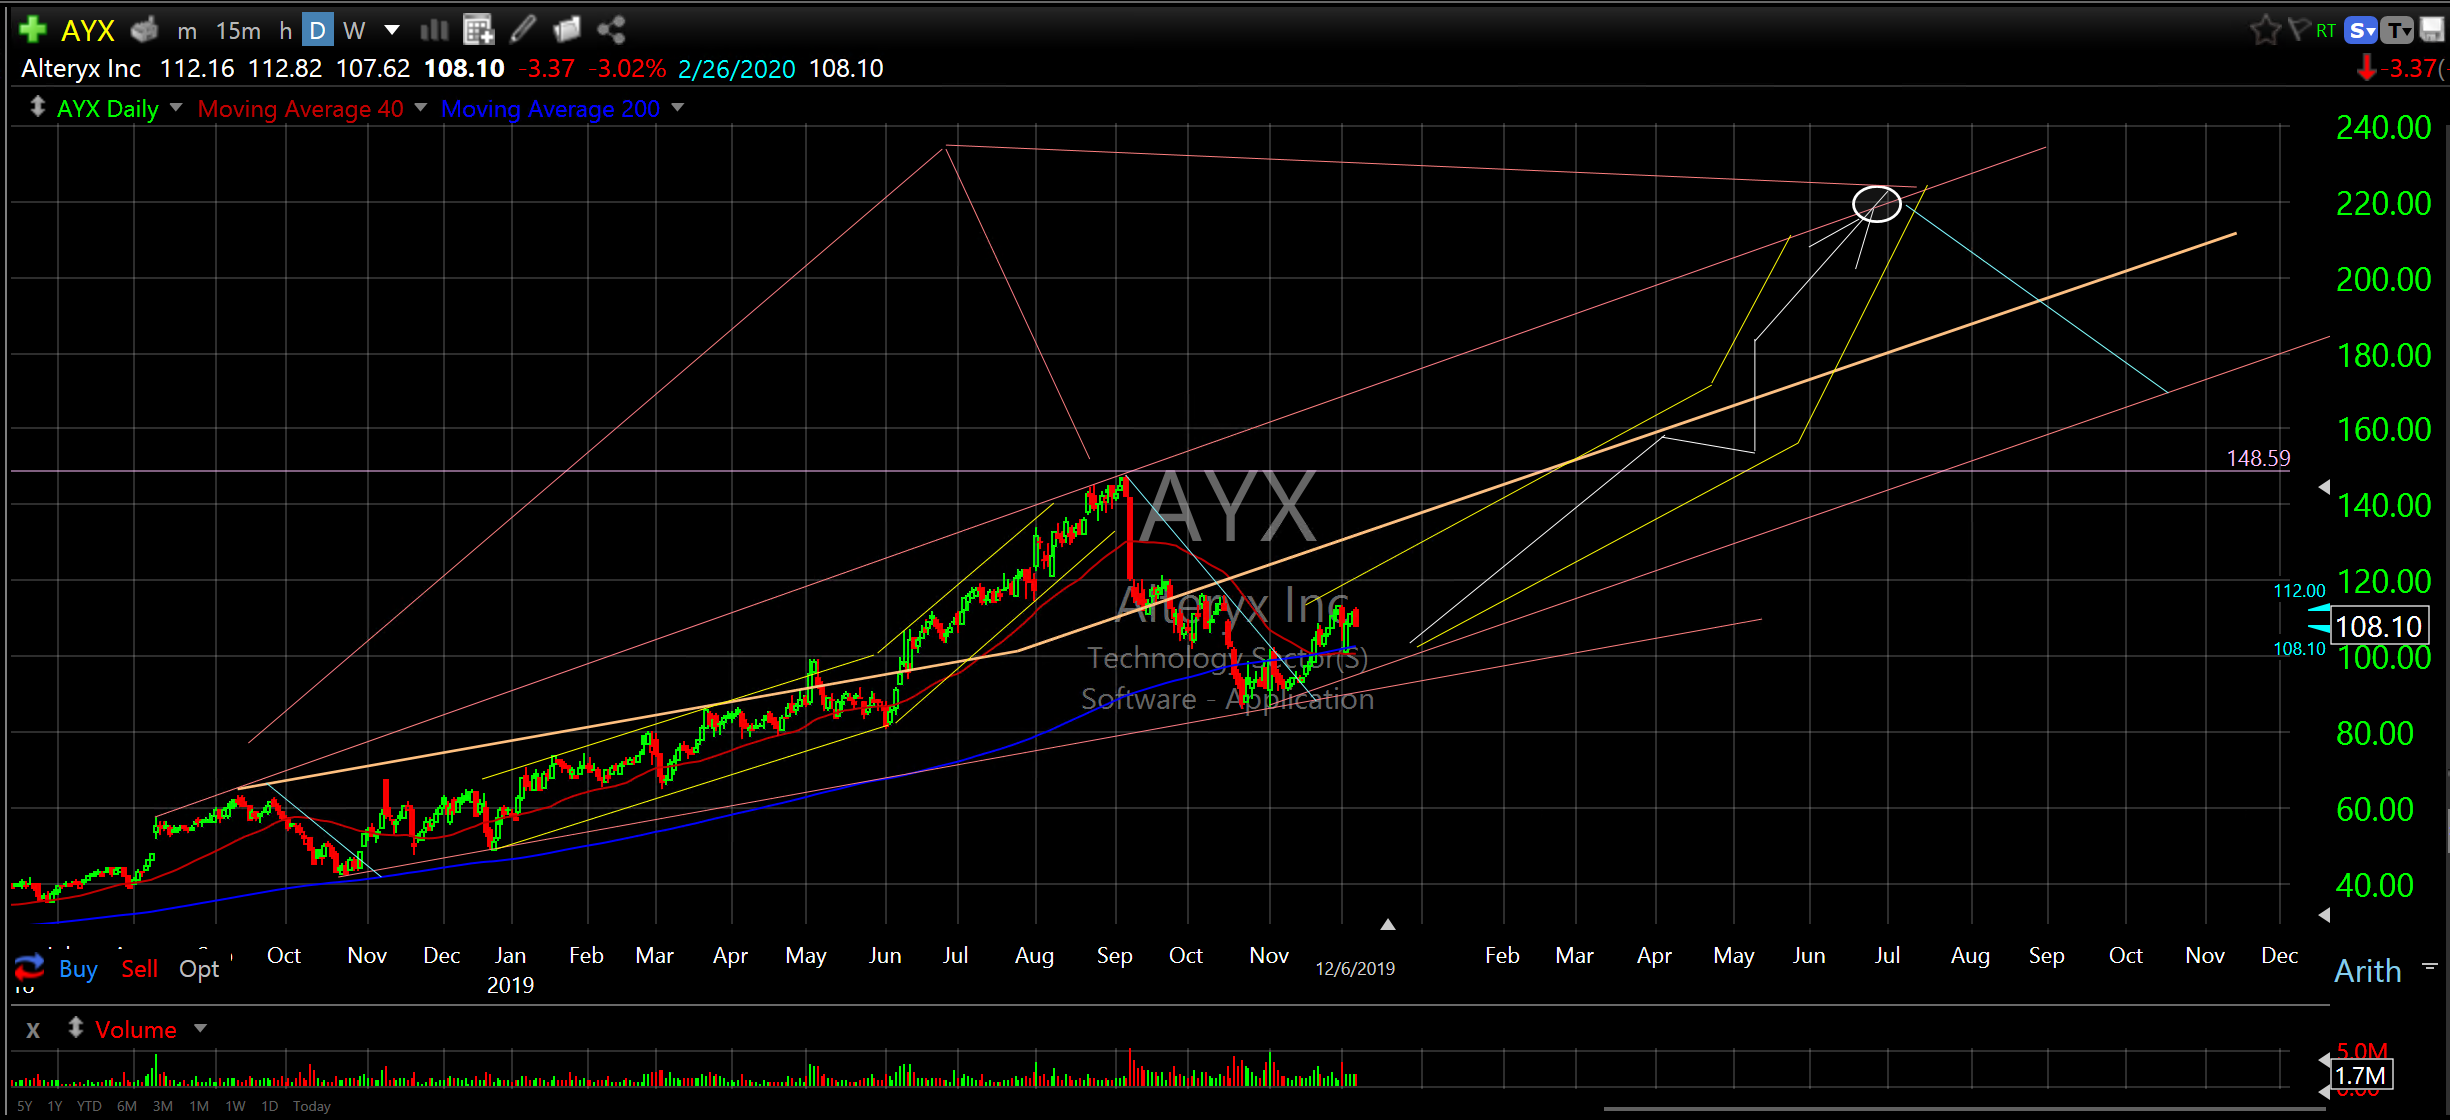
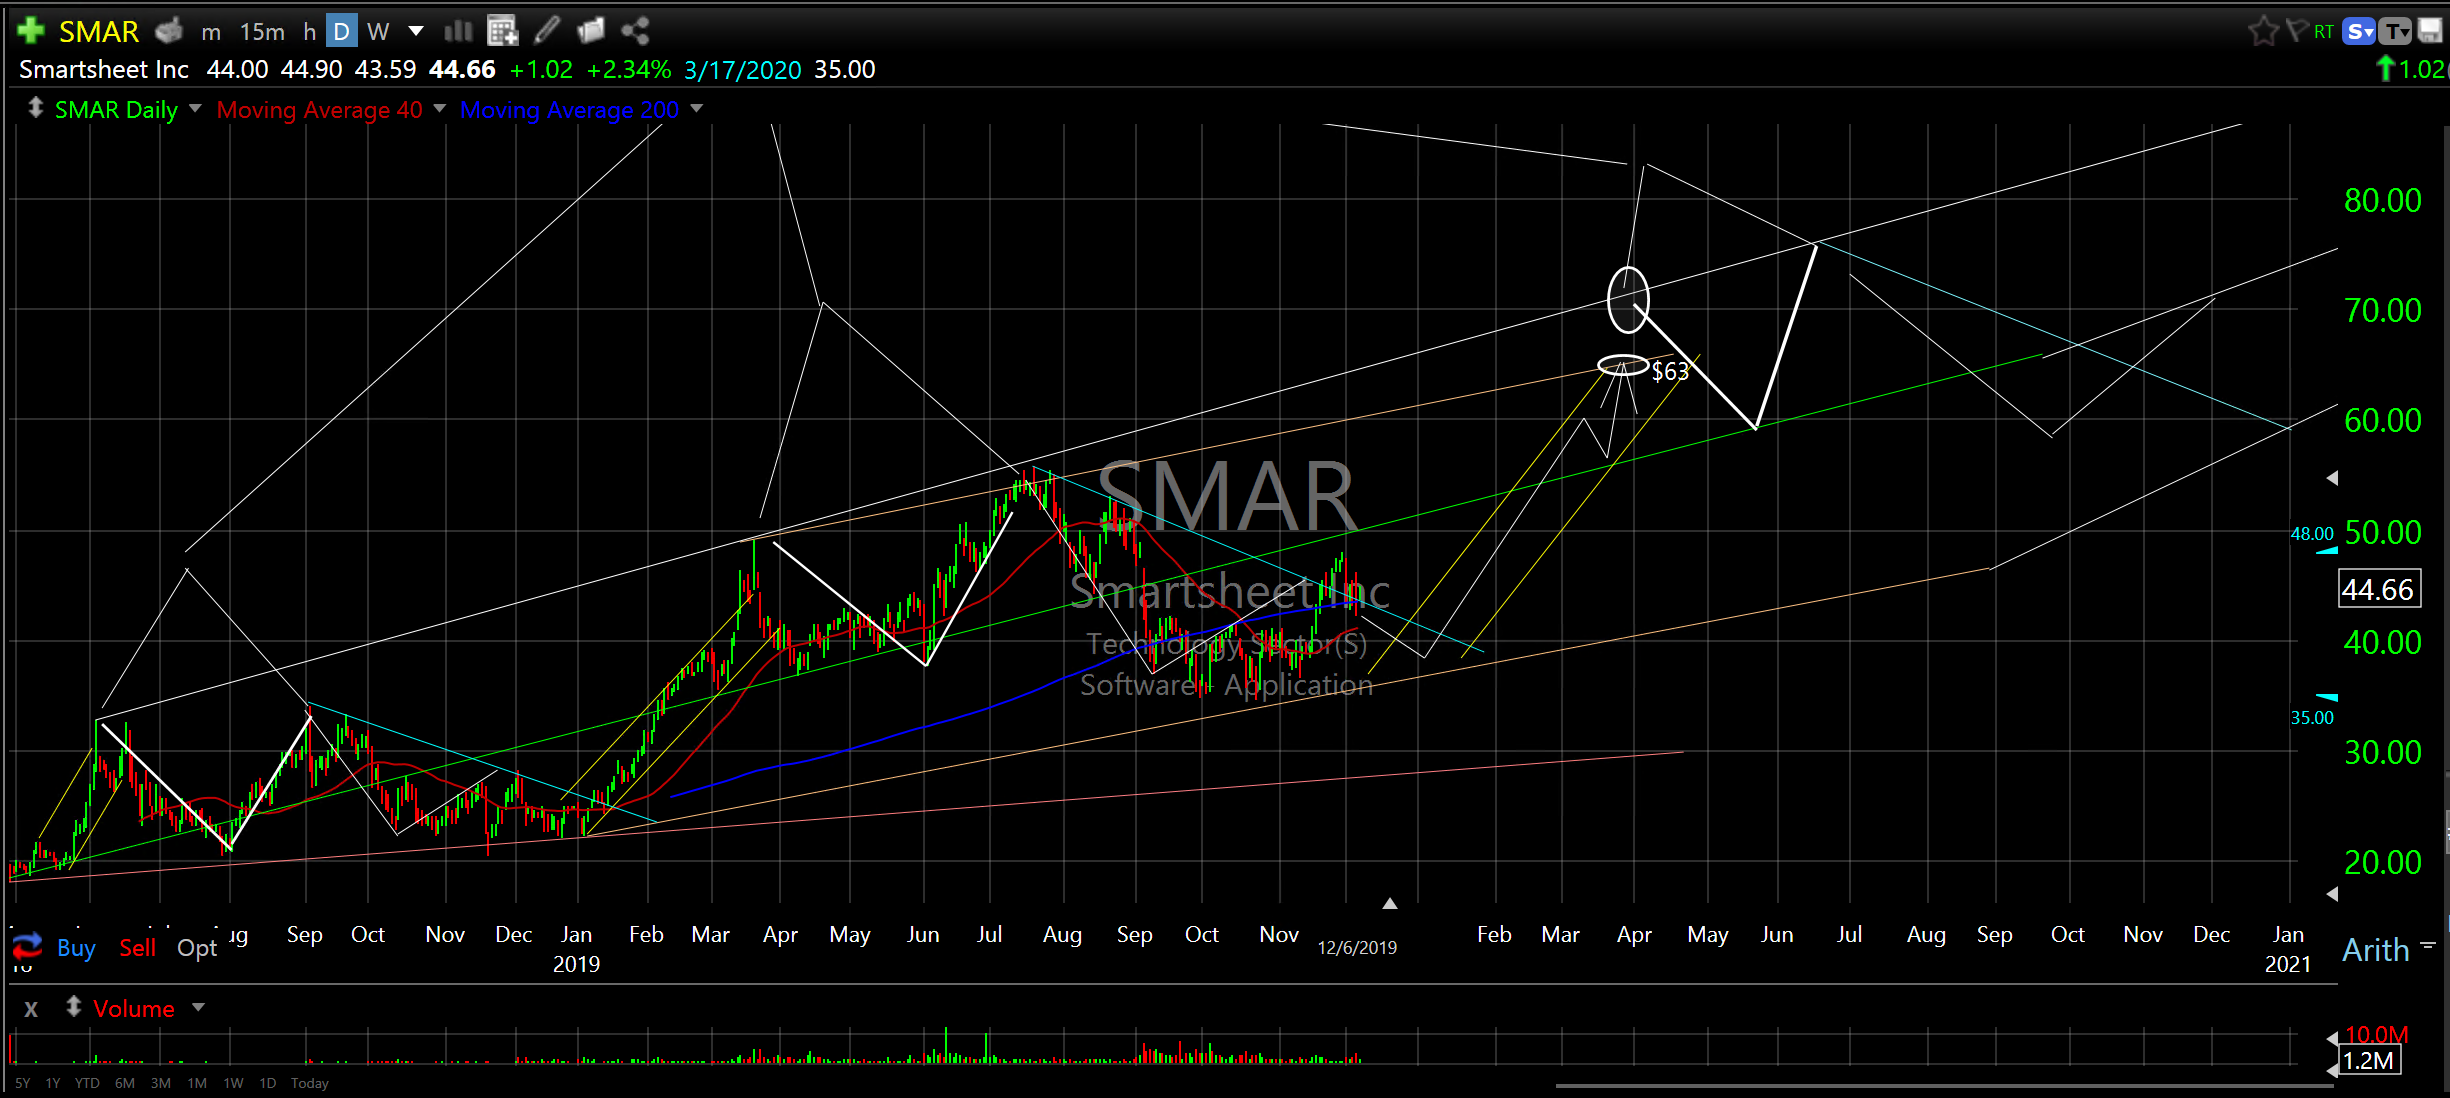
Let’s go right to the glitter and gold. Take a look inside the broader market and unwrap the tech sector and peer into two of its brightest components, software application, and software Infrastructure and examine the following companies. Just look at the charts and see their cycles, channels, reversals and where they scale-out. I can’t imagine these companies not ripping during a broader market expansion. Own a bunch of them. Make your own ETF with a basket of them. That way you are not as exposed to individual company risk.
OKTA
TTD
COUP
AYX
SMAR
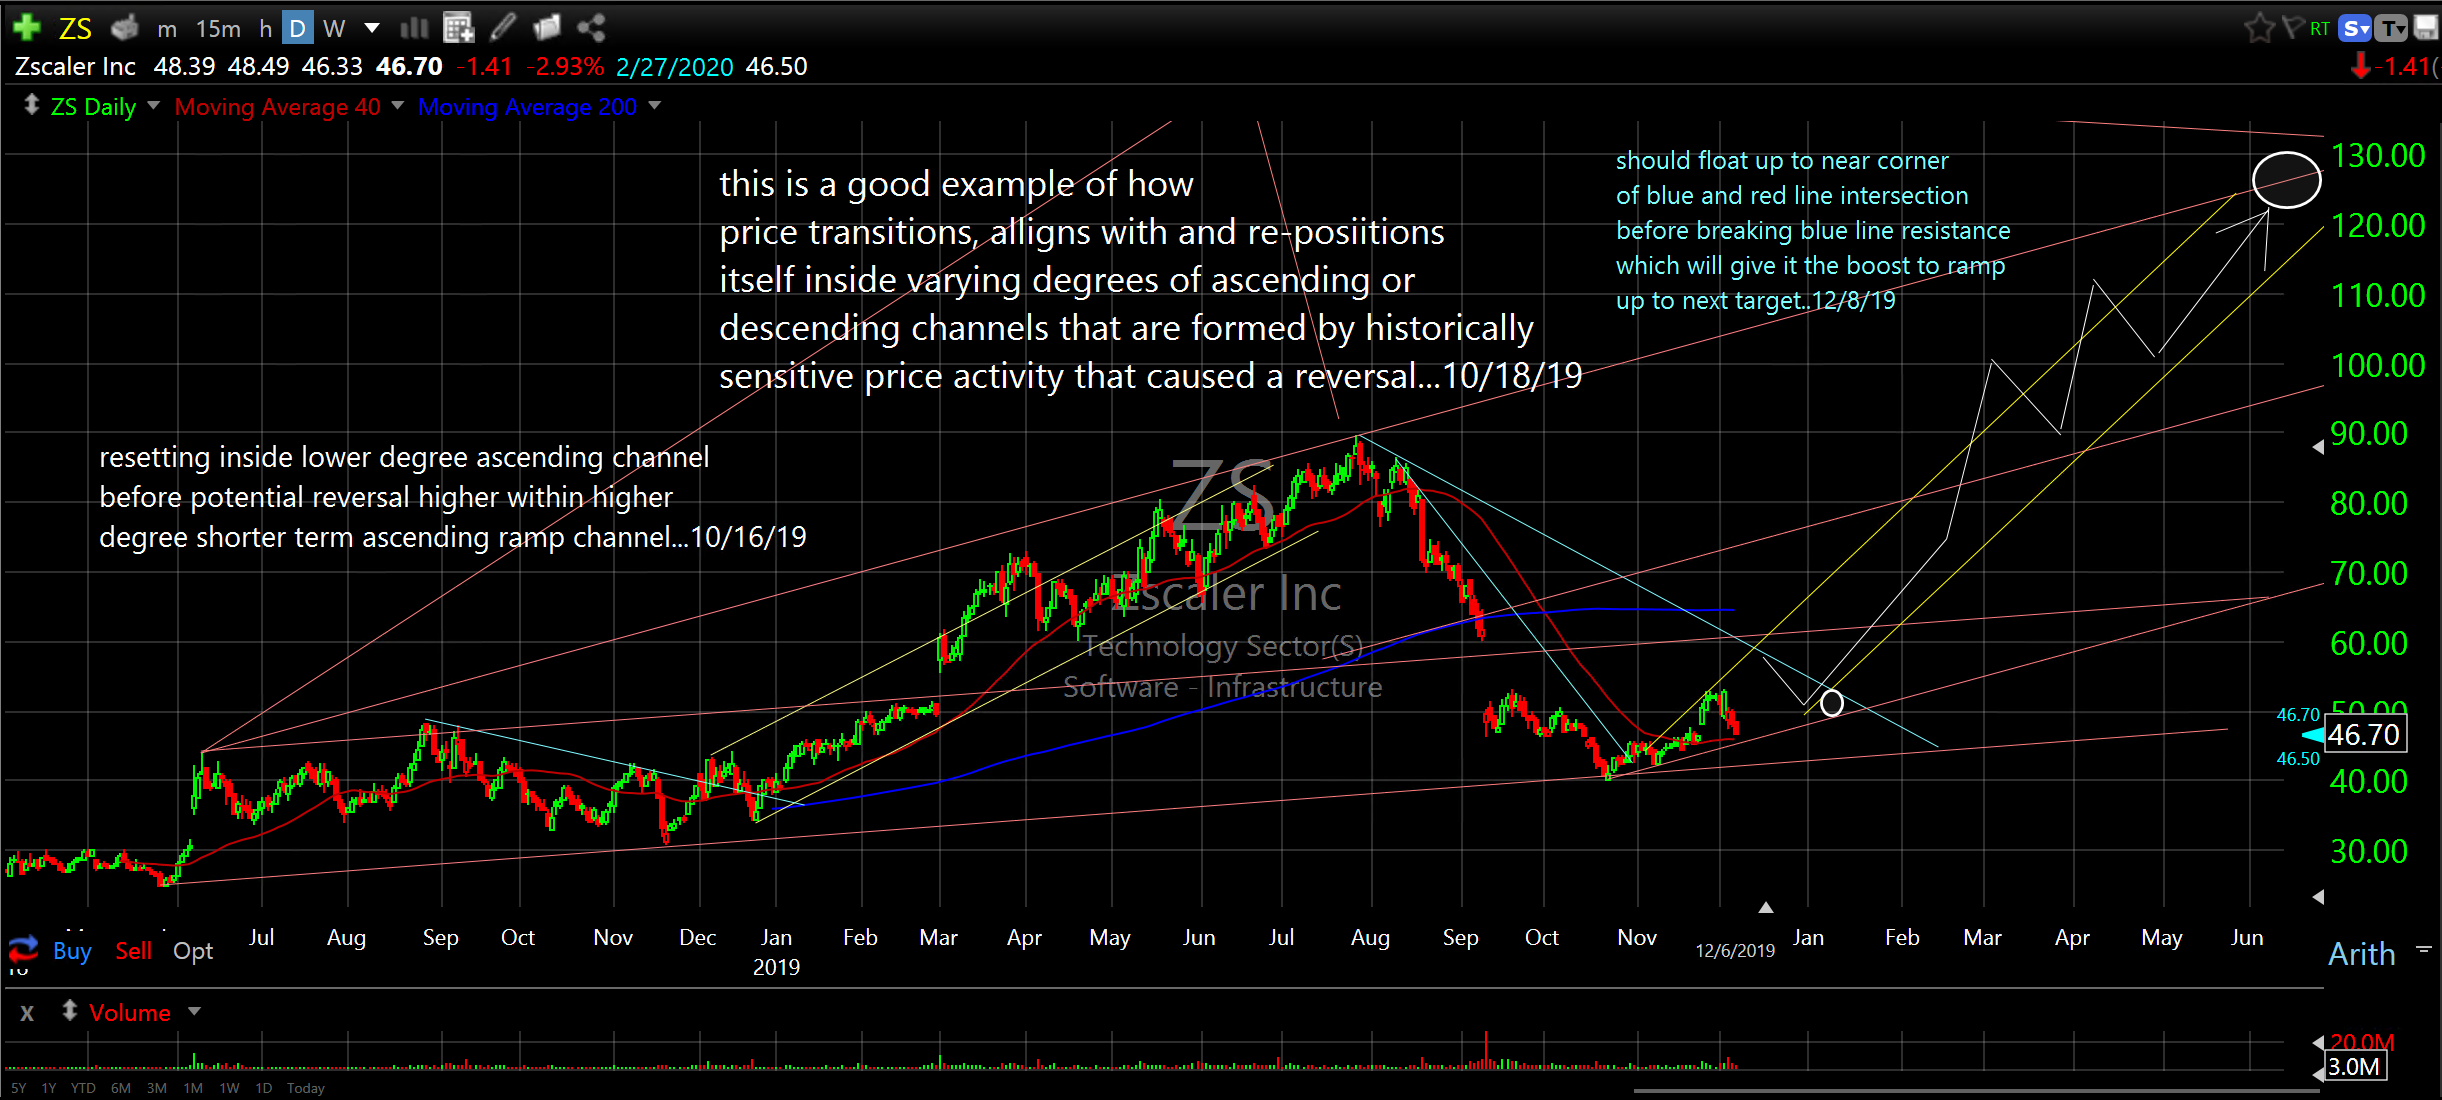
ZS
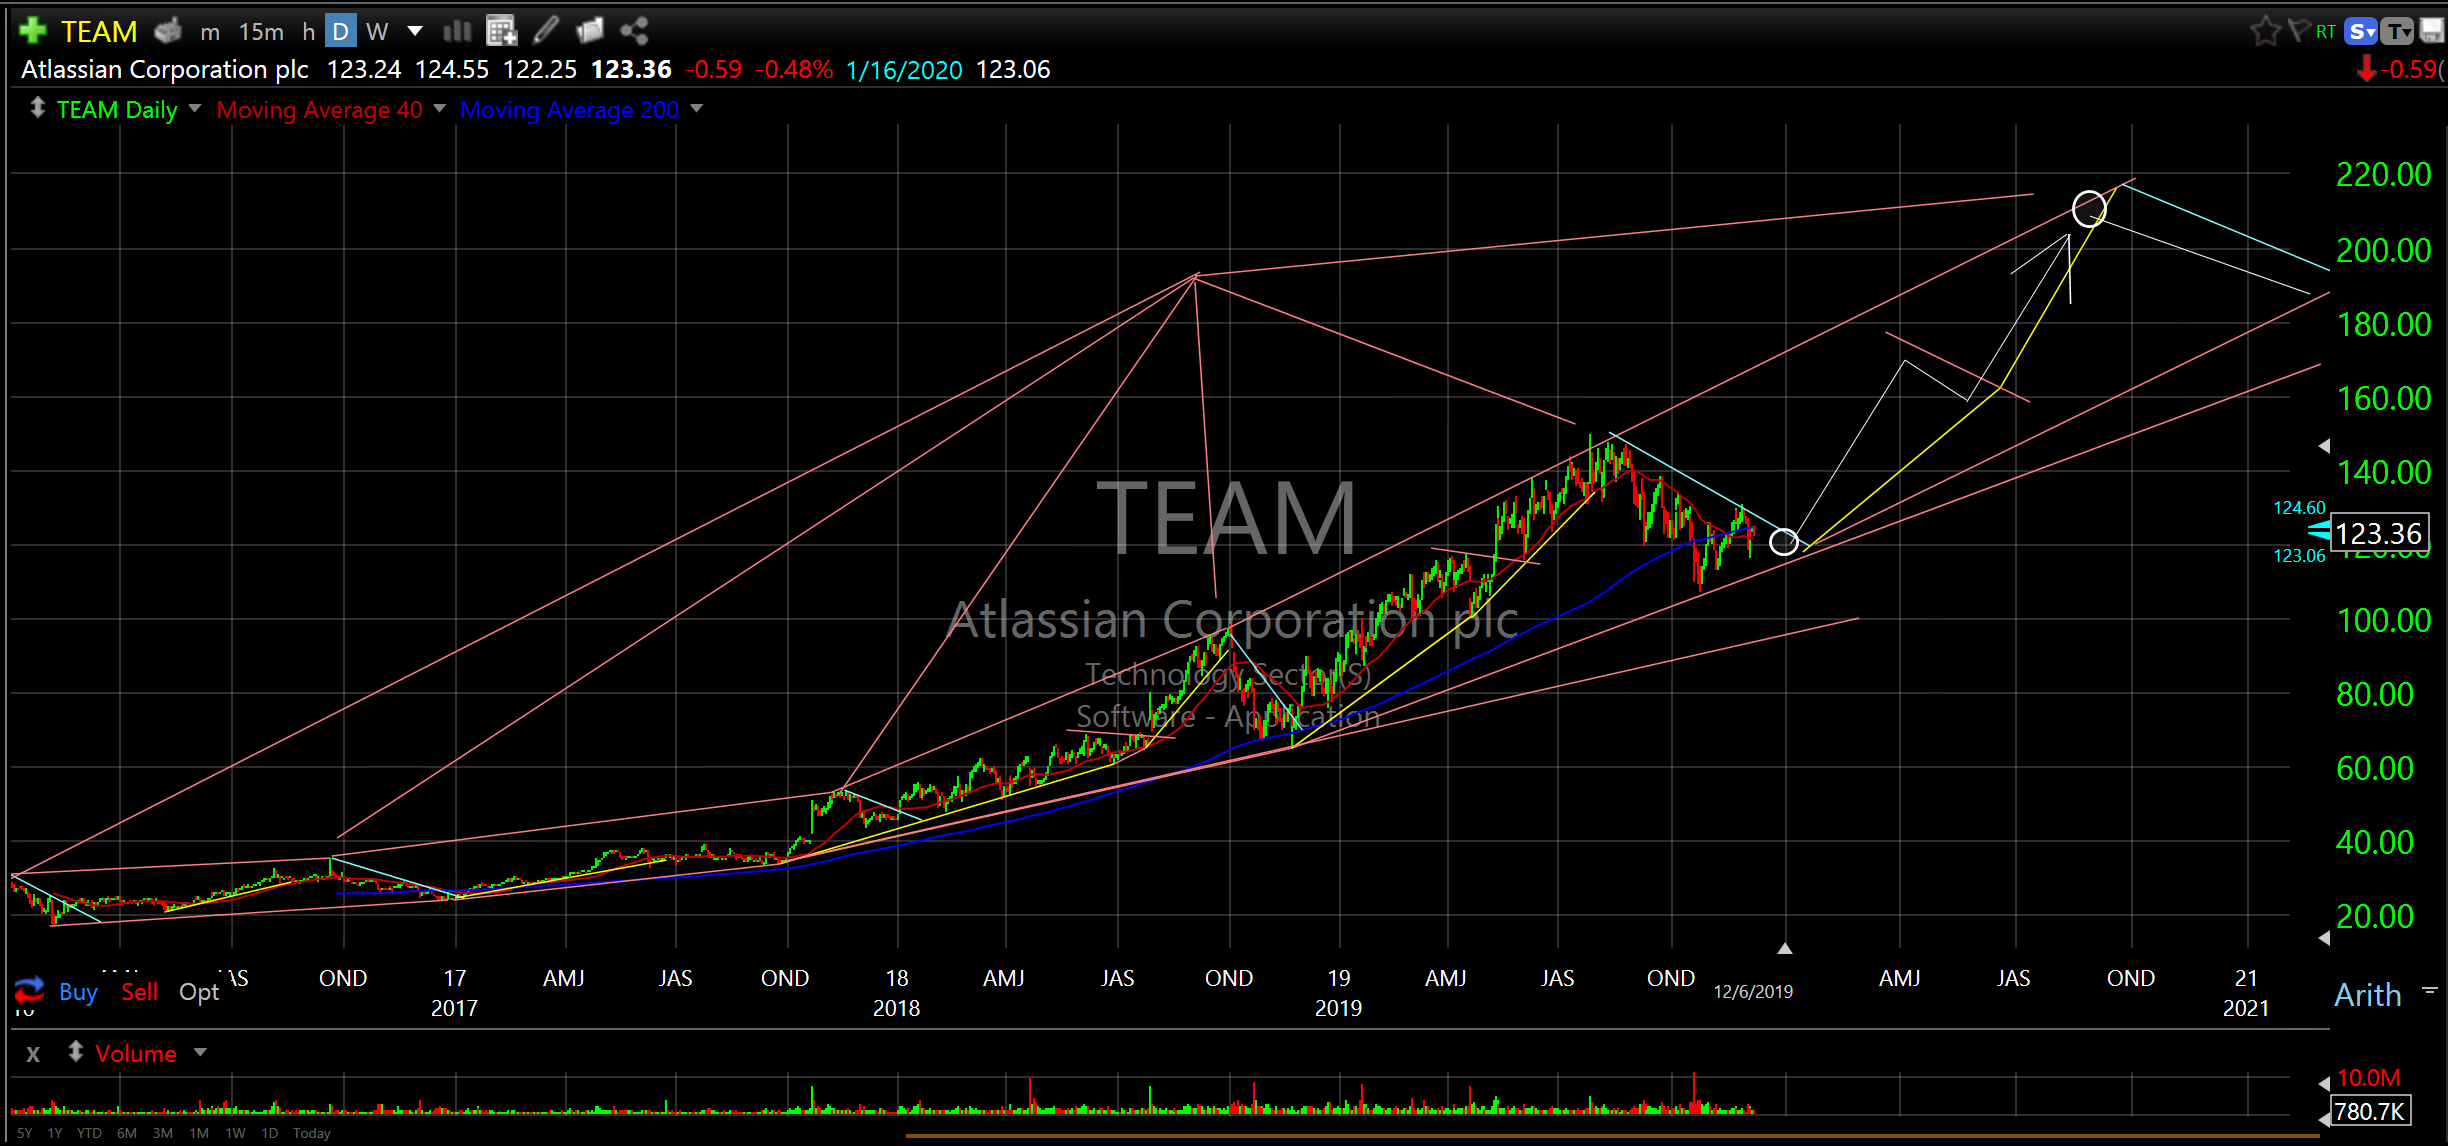
TEAM
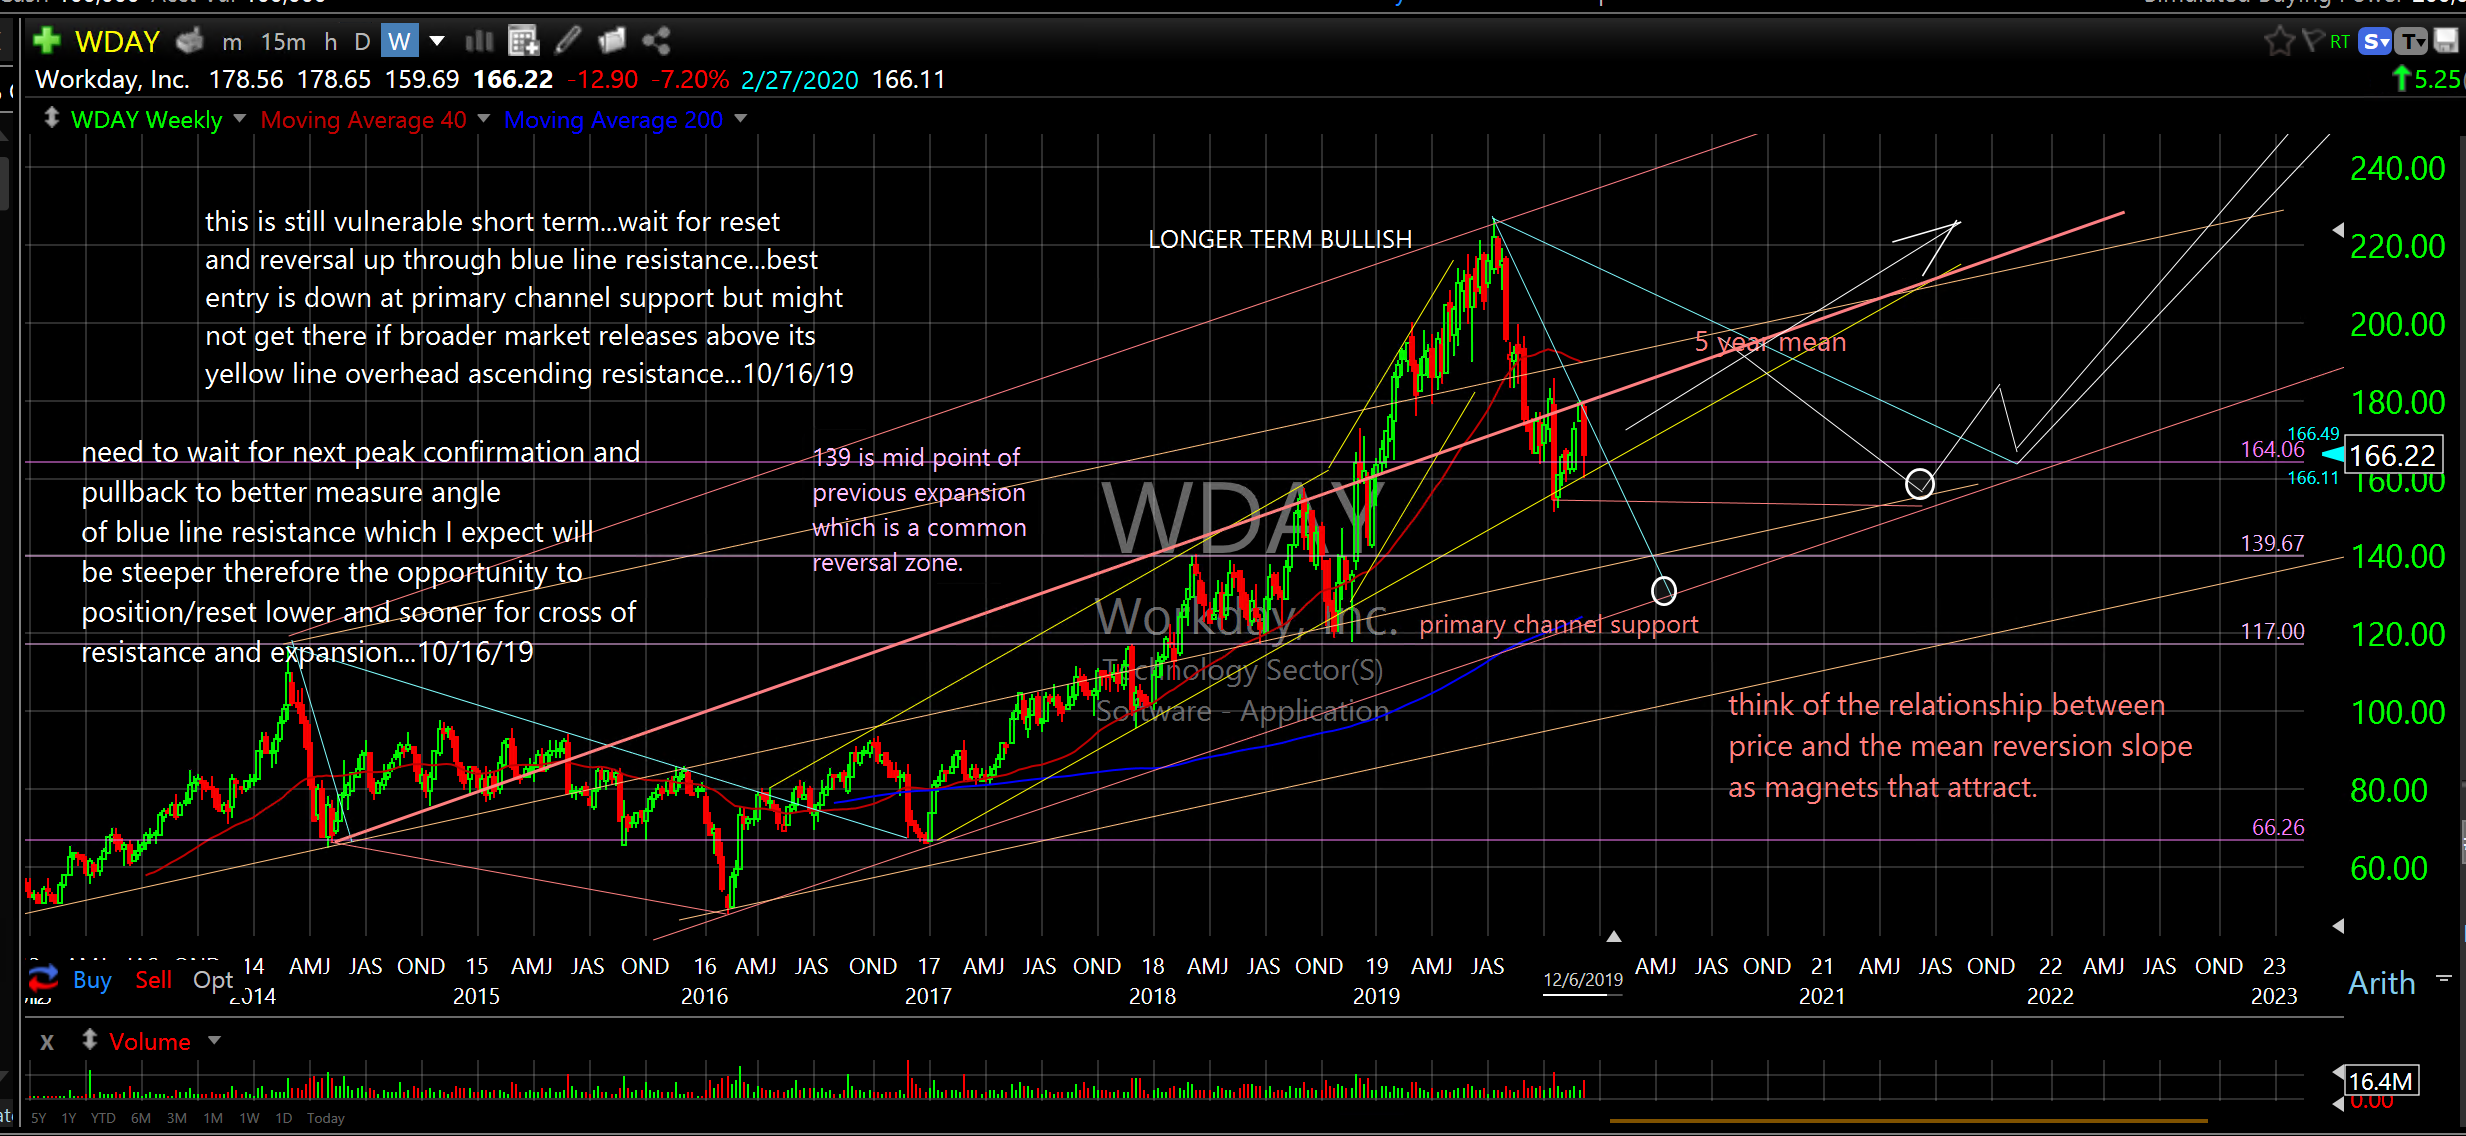
WDAY
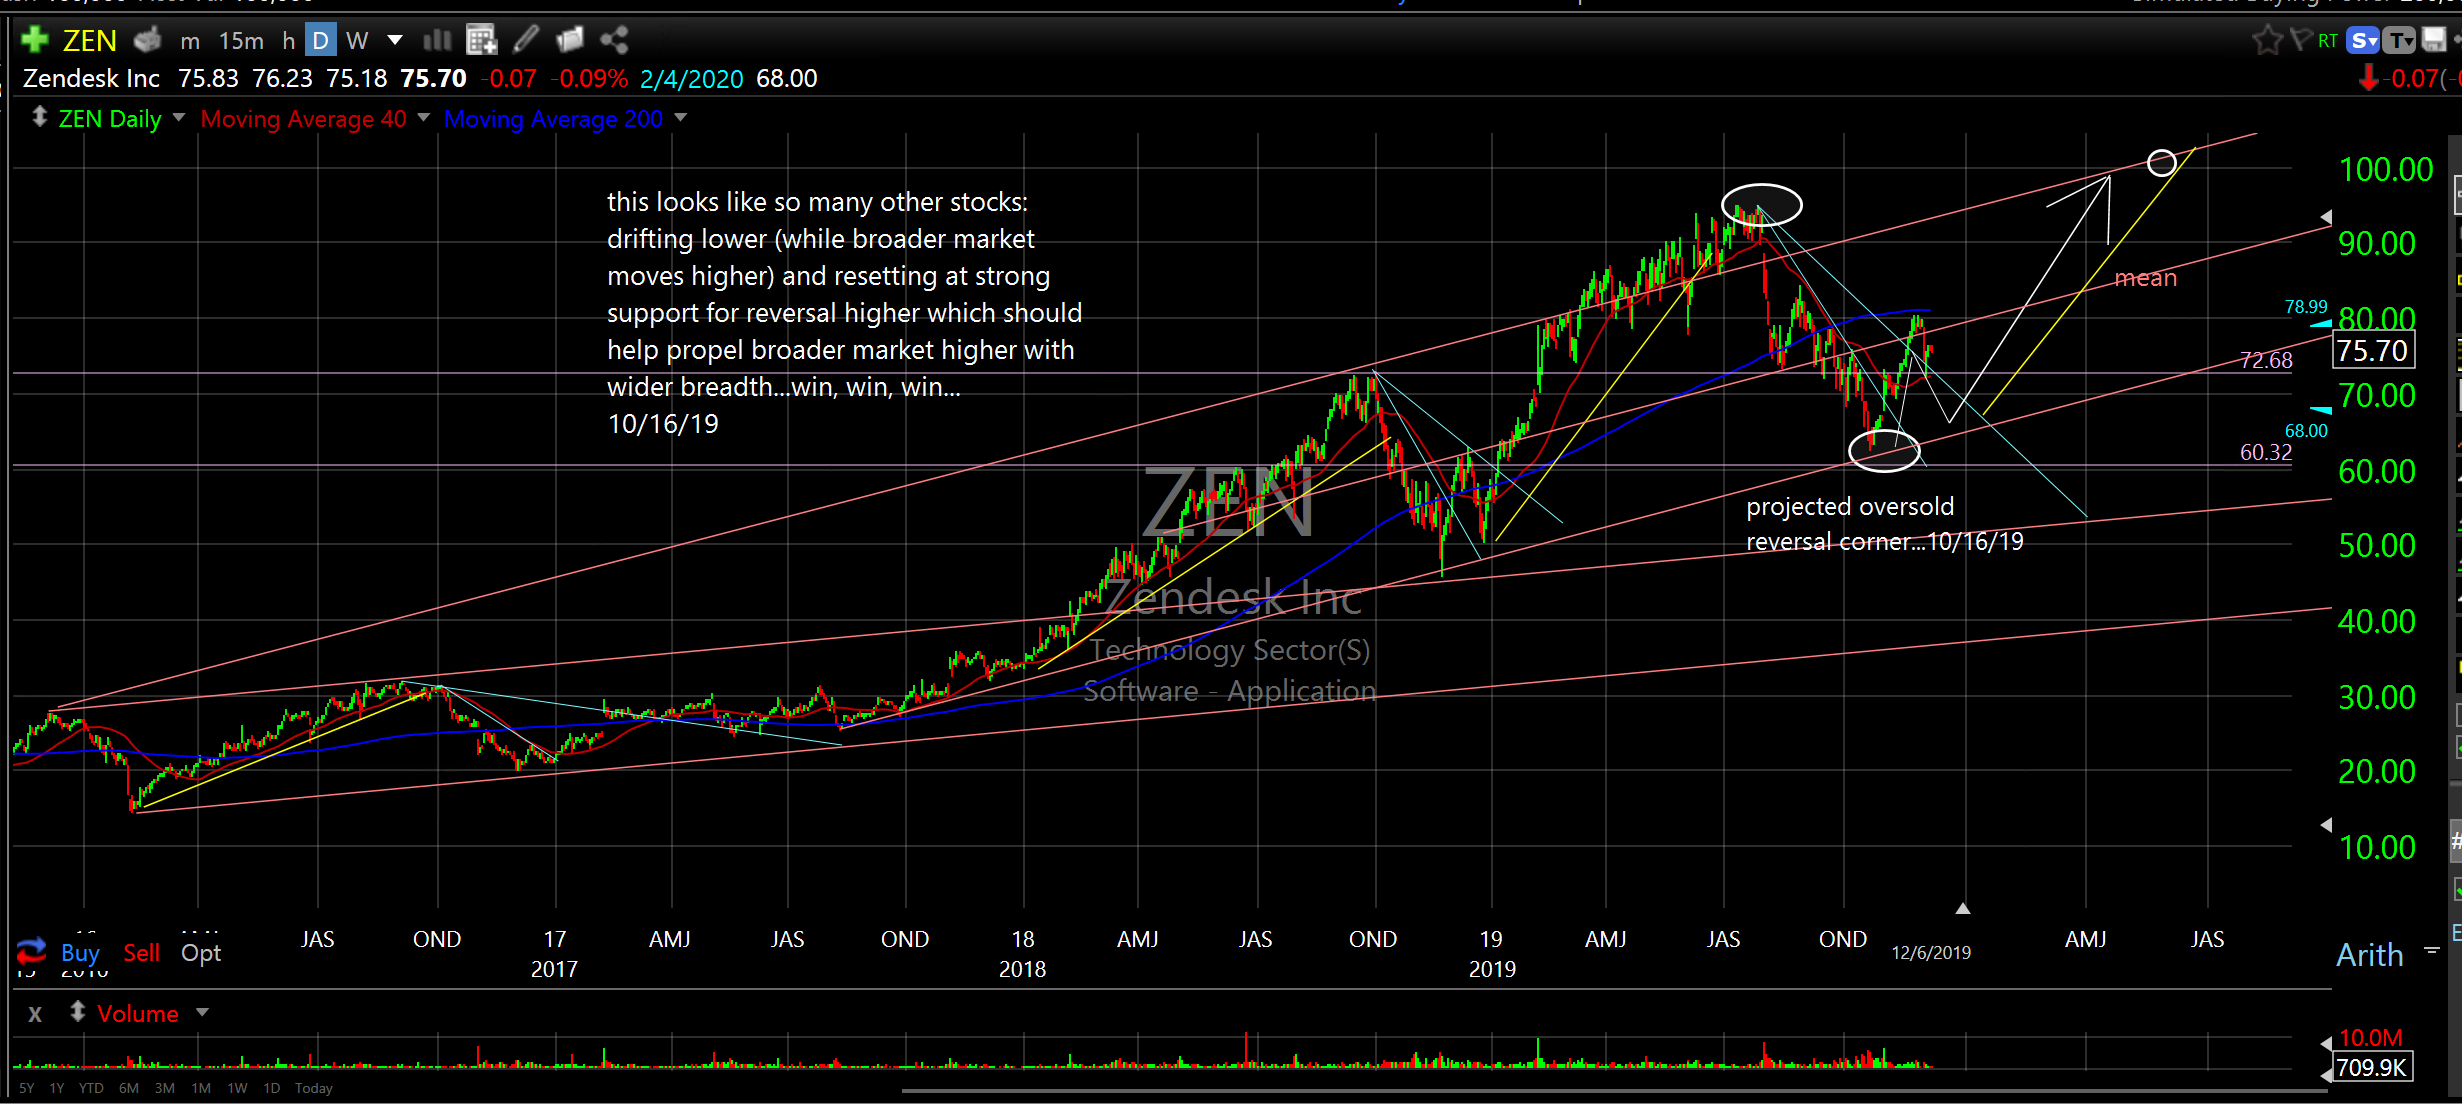
ZEN
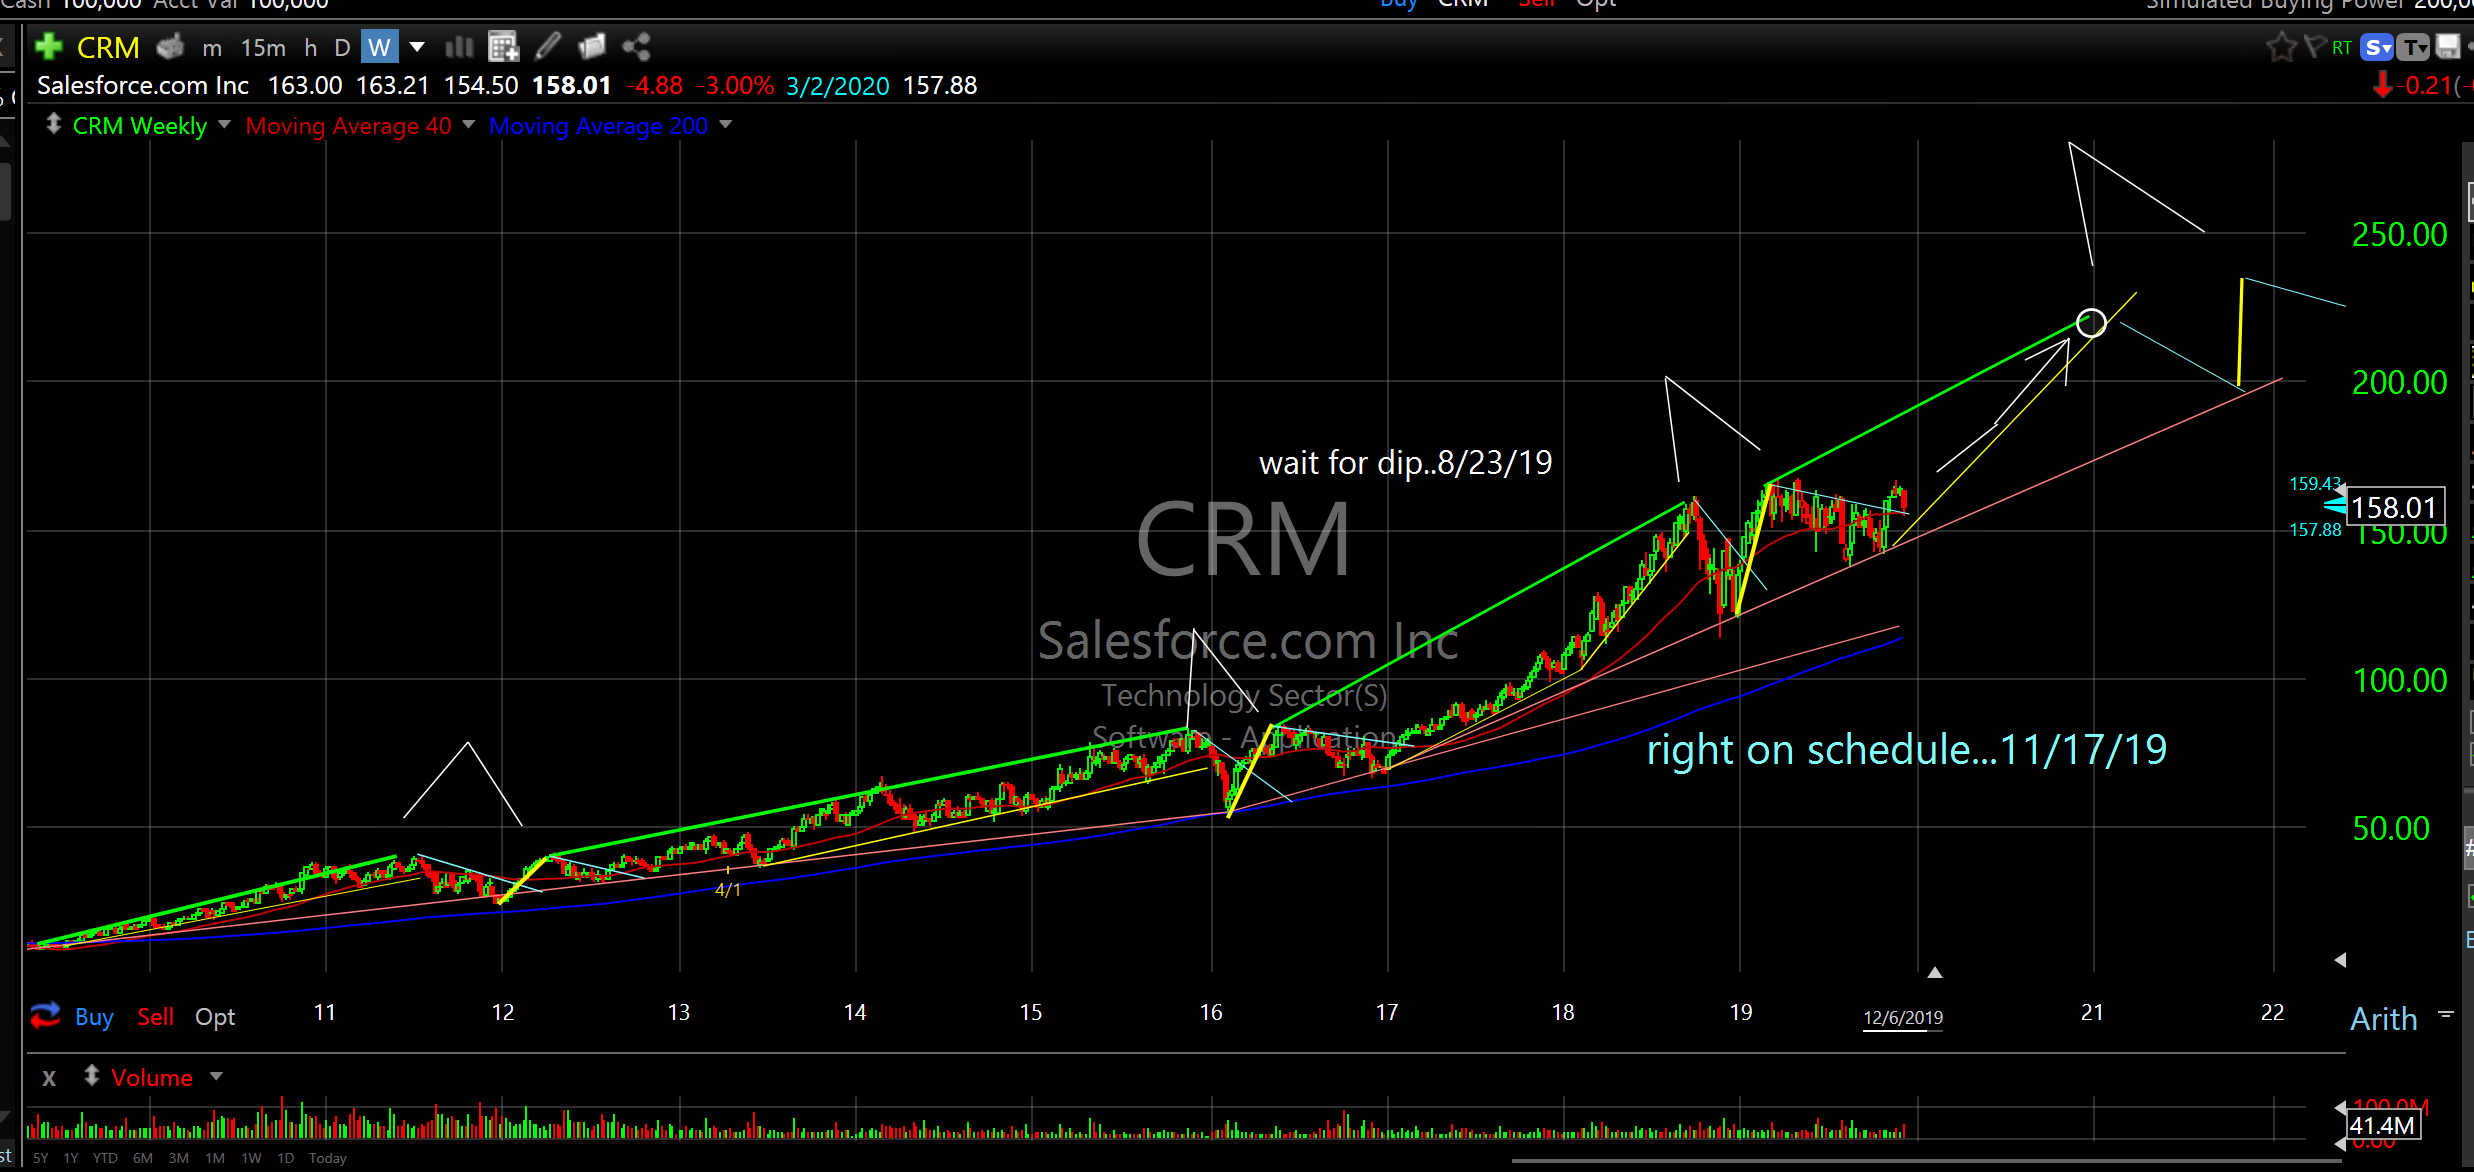
CRM
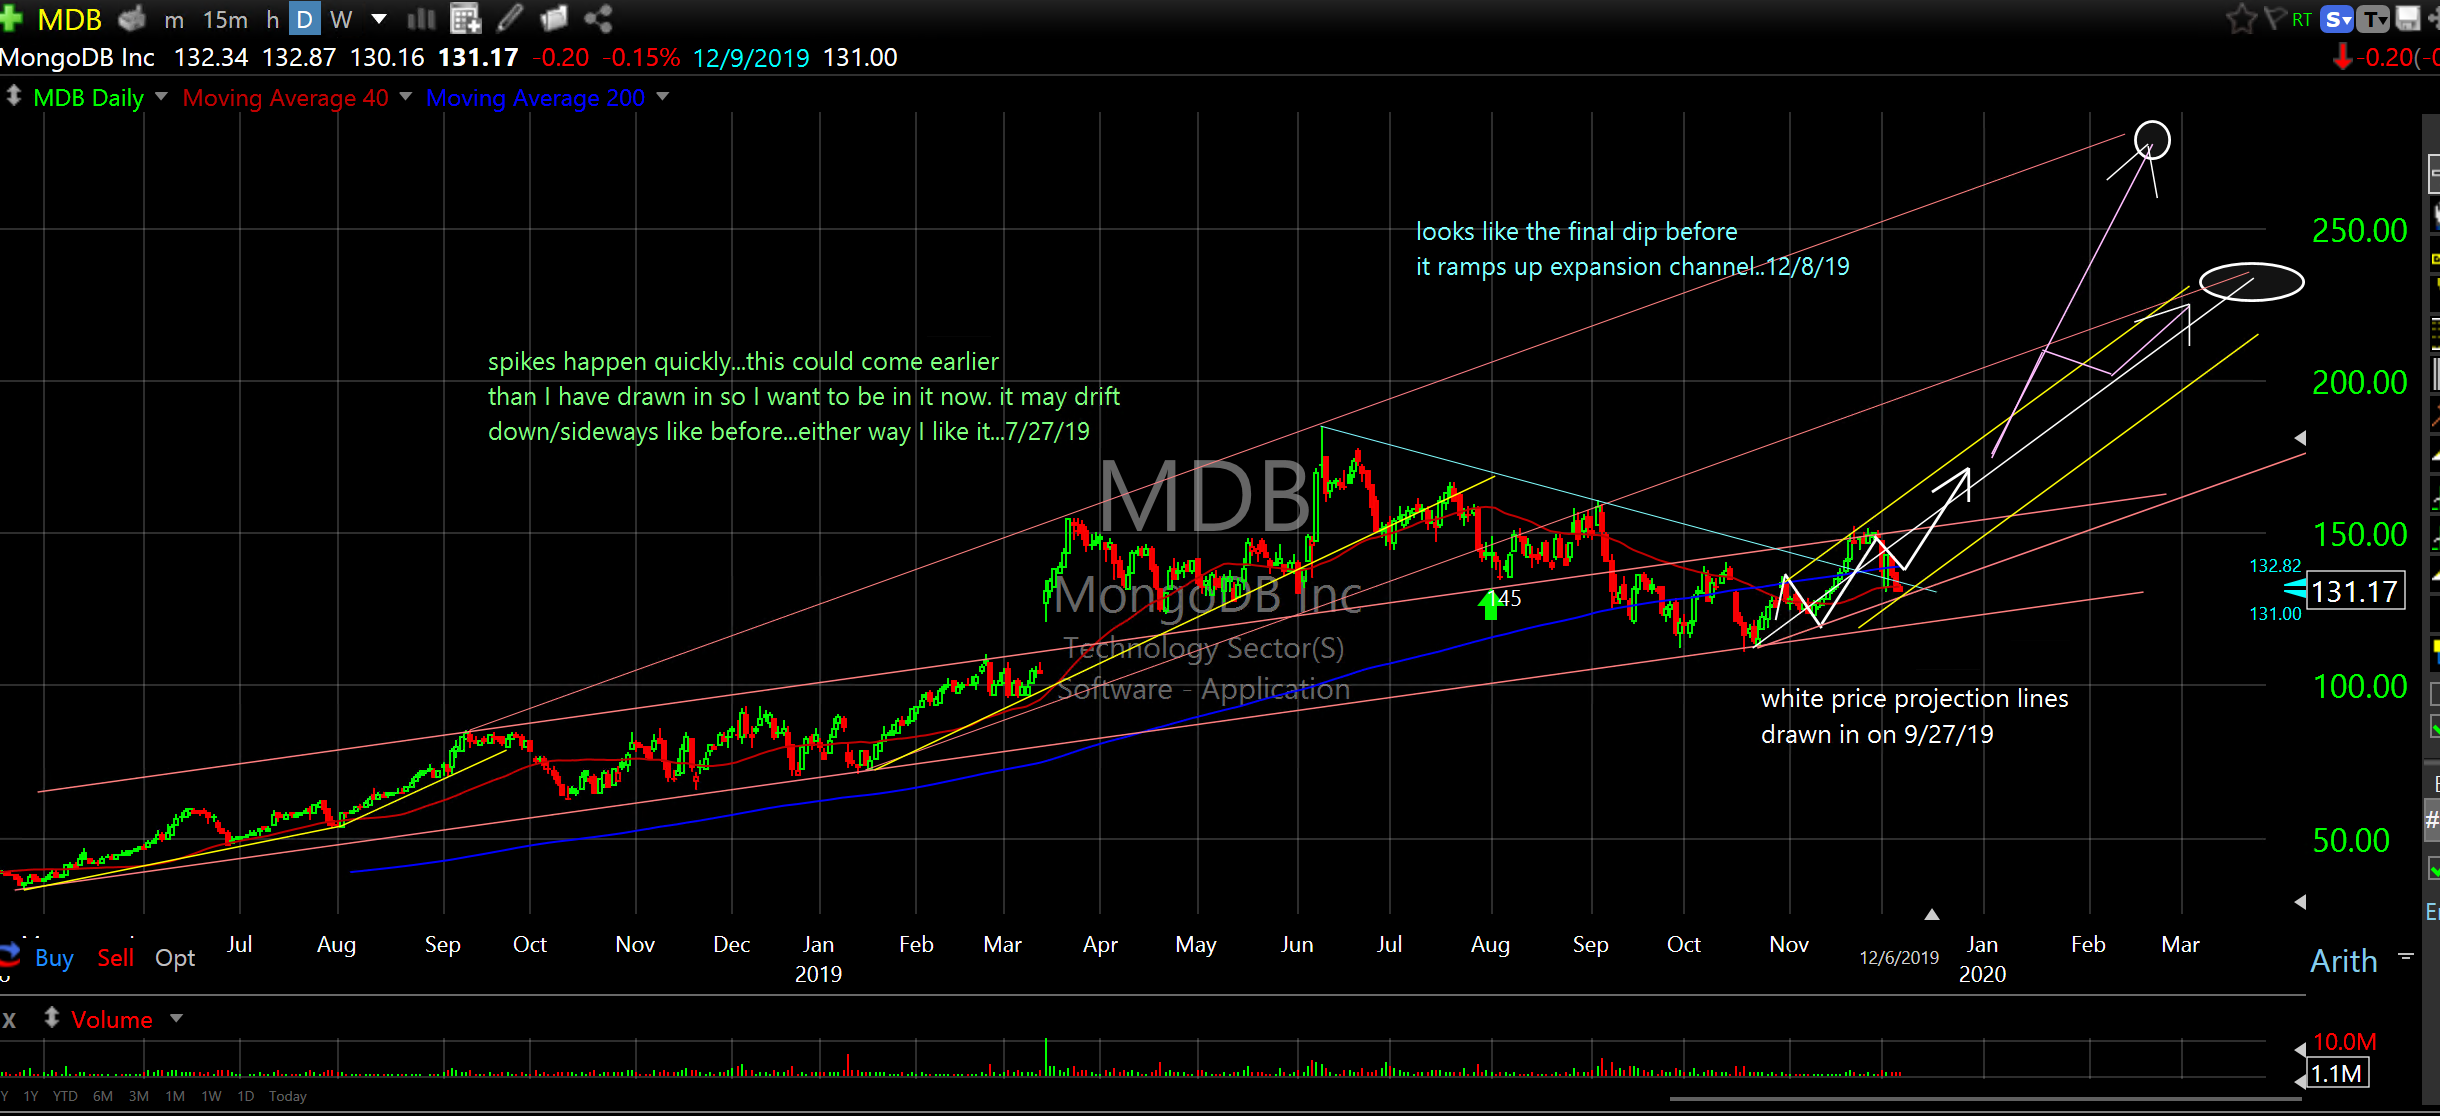
MDB
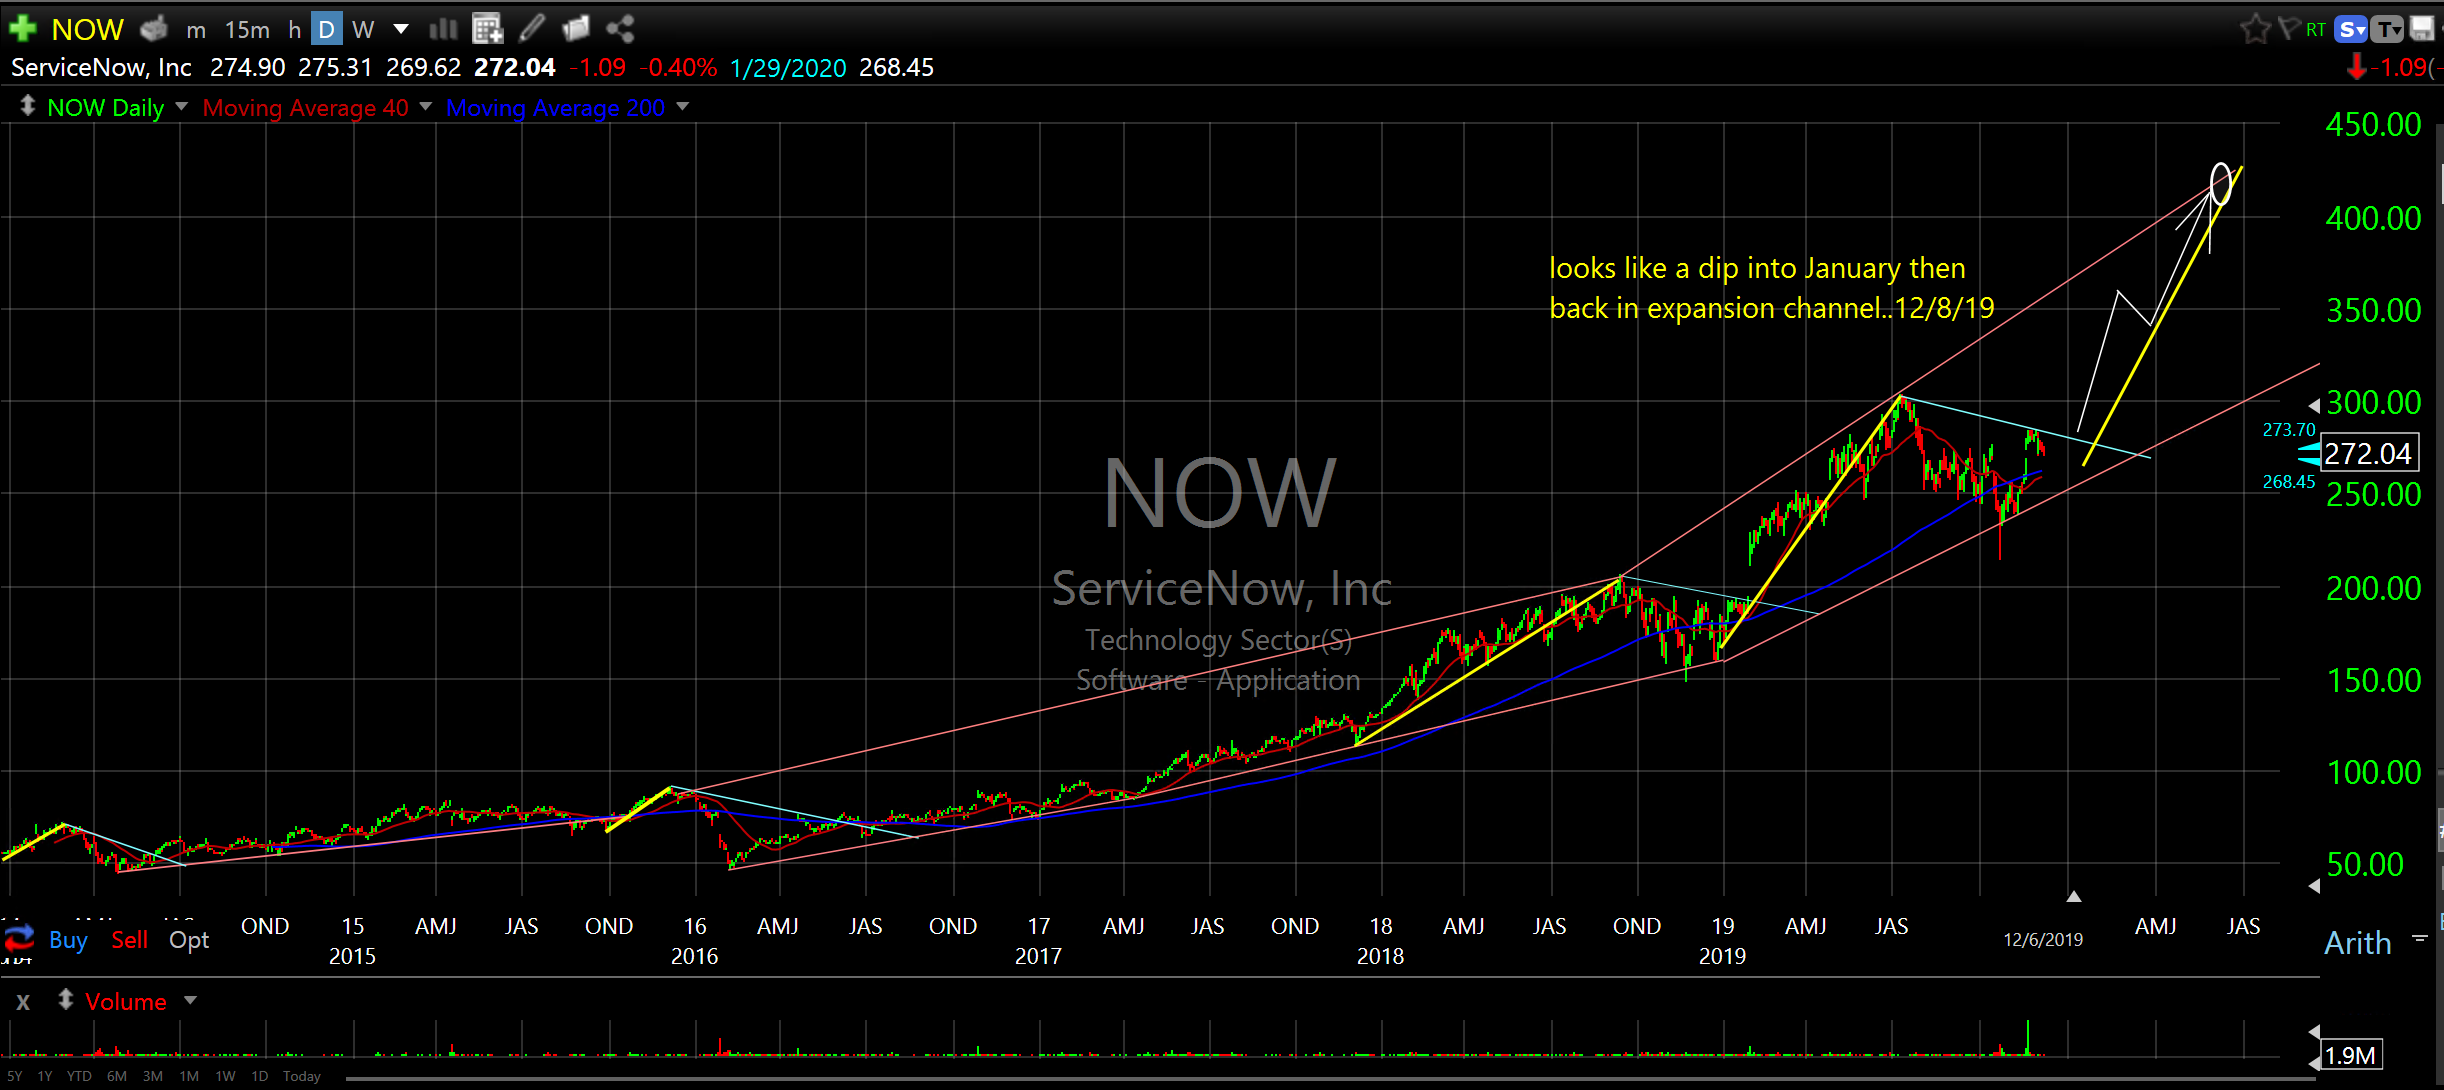
NOW
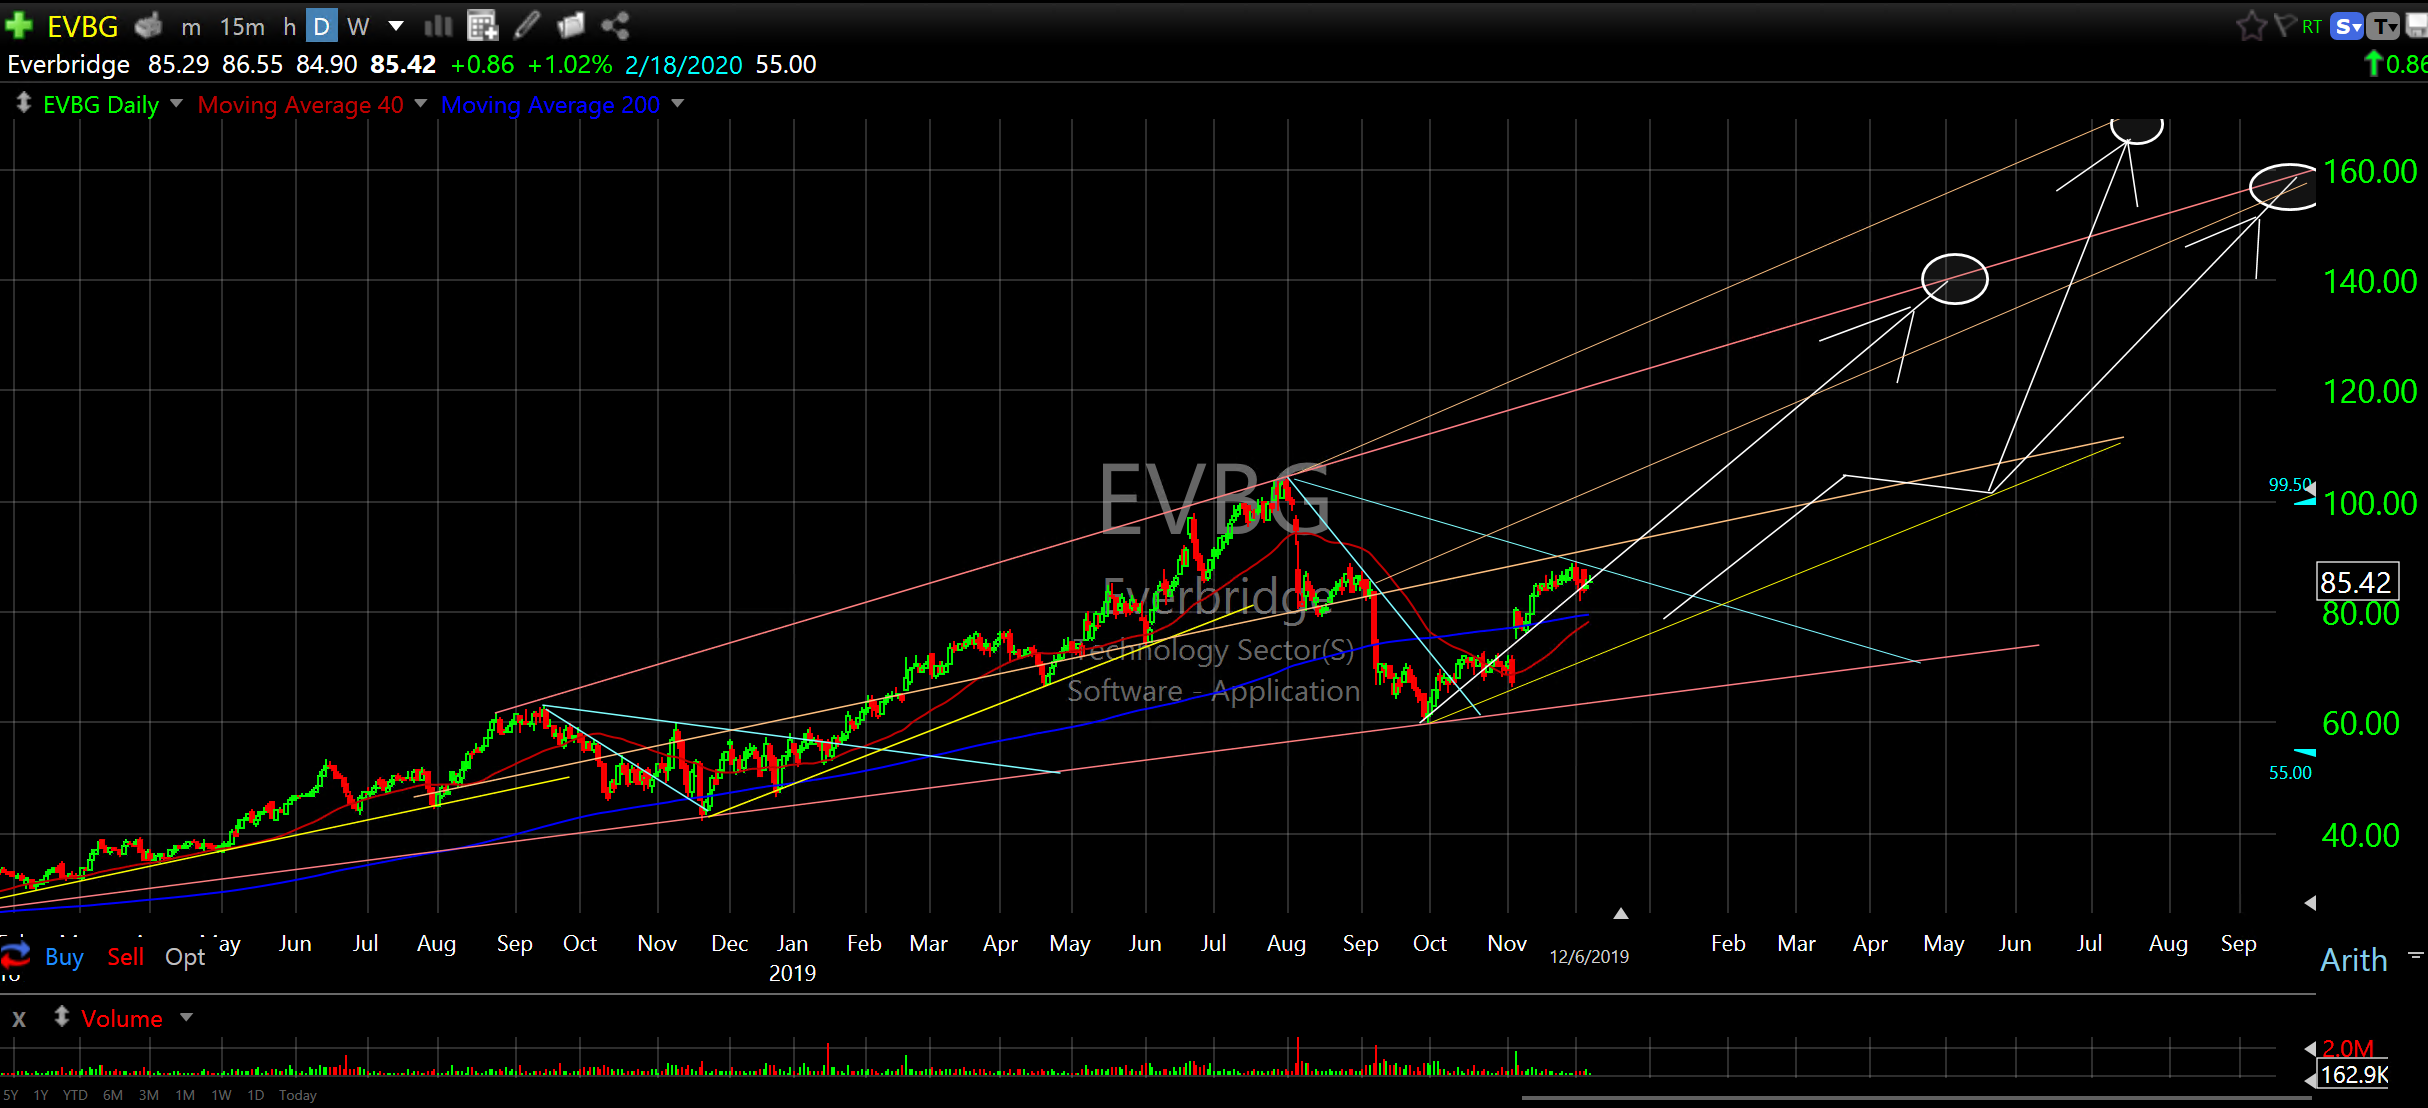
EVBG
The robust expansion that is just beginning now and should run well into 2020 will catch most people off guard. There aren’t many calling for a good ramp. Most are in the all too common grey area of neutral to mildly bullish while there are still many who are really quite bearish. I love it. It’s almost too good to be true but I think it is. Just look at the charts. Don’t believe me, believe the charts.
Happy Shopping,
Don