Sunday, April 5, 2020
I spent the entire week glued to the screen watching every tick in the Dow trying to get a feel for what the hell is going on and how price is responding to the long and strong historic reversal levels. Watching a one minute chart around these levels can reveal a lot if you don’t have a heart attack first. Back in the day, when I traded pork bellies and Japanese Yen, the S&P pit in Chicago would get so loud at the big reversal zones you could trade the decibel levels.
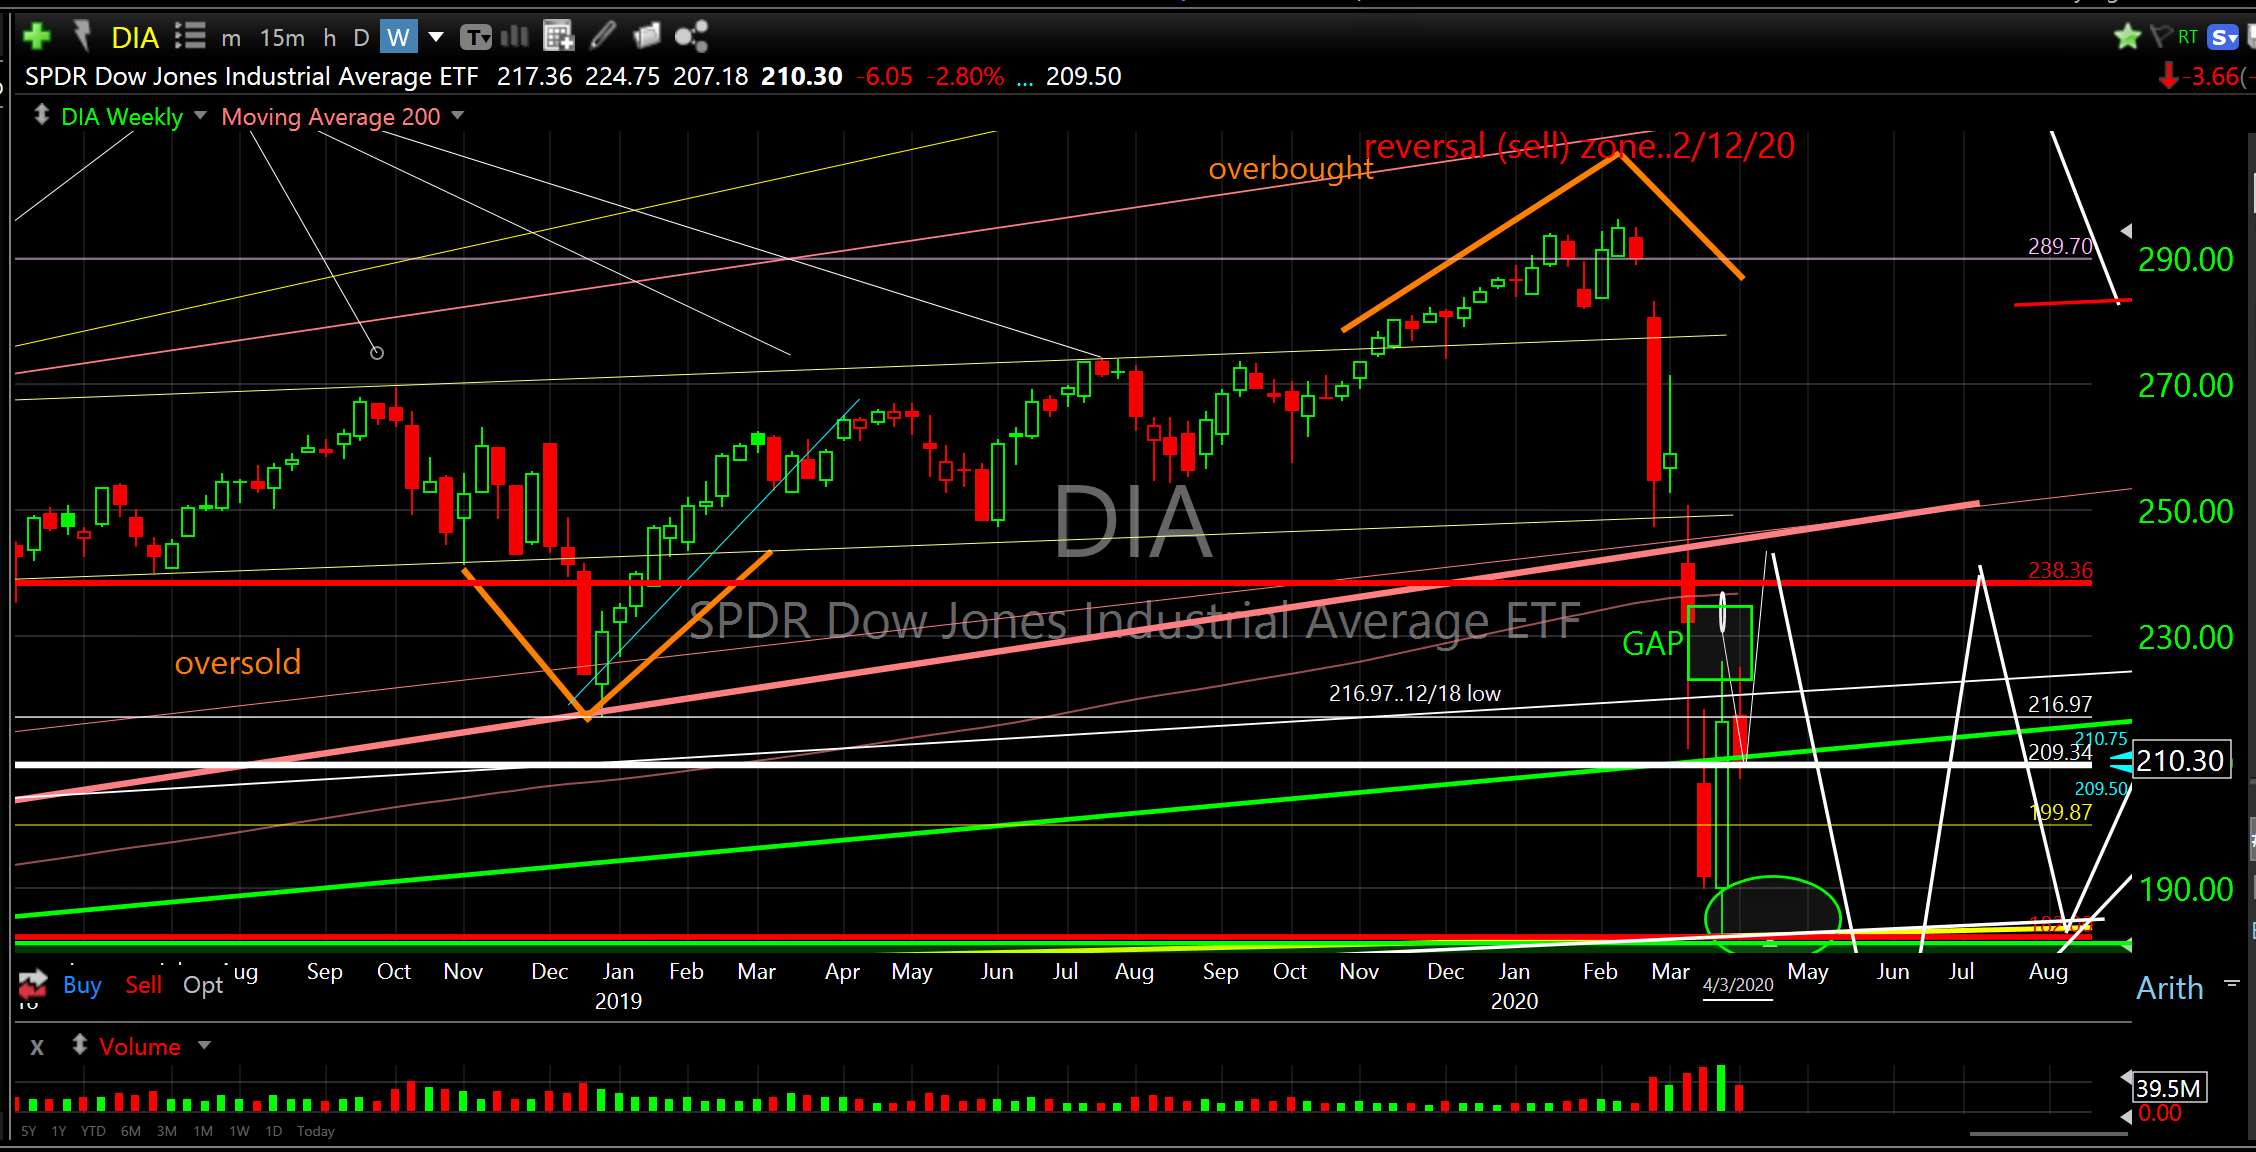
The good news is volatility, while still high, was lower than the prior week. Also, even though it was a down week, the broader market didn’t give up too much of the gain from the previous weeks’ surge. And, the week closed slightly above the all important ascending trend line (green line) from the bottom in 2009. So, if I were to grade it, I would give it a C+/B-.
SPDR Dow Jones Industrial Average ETF (DIA)
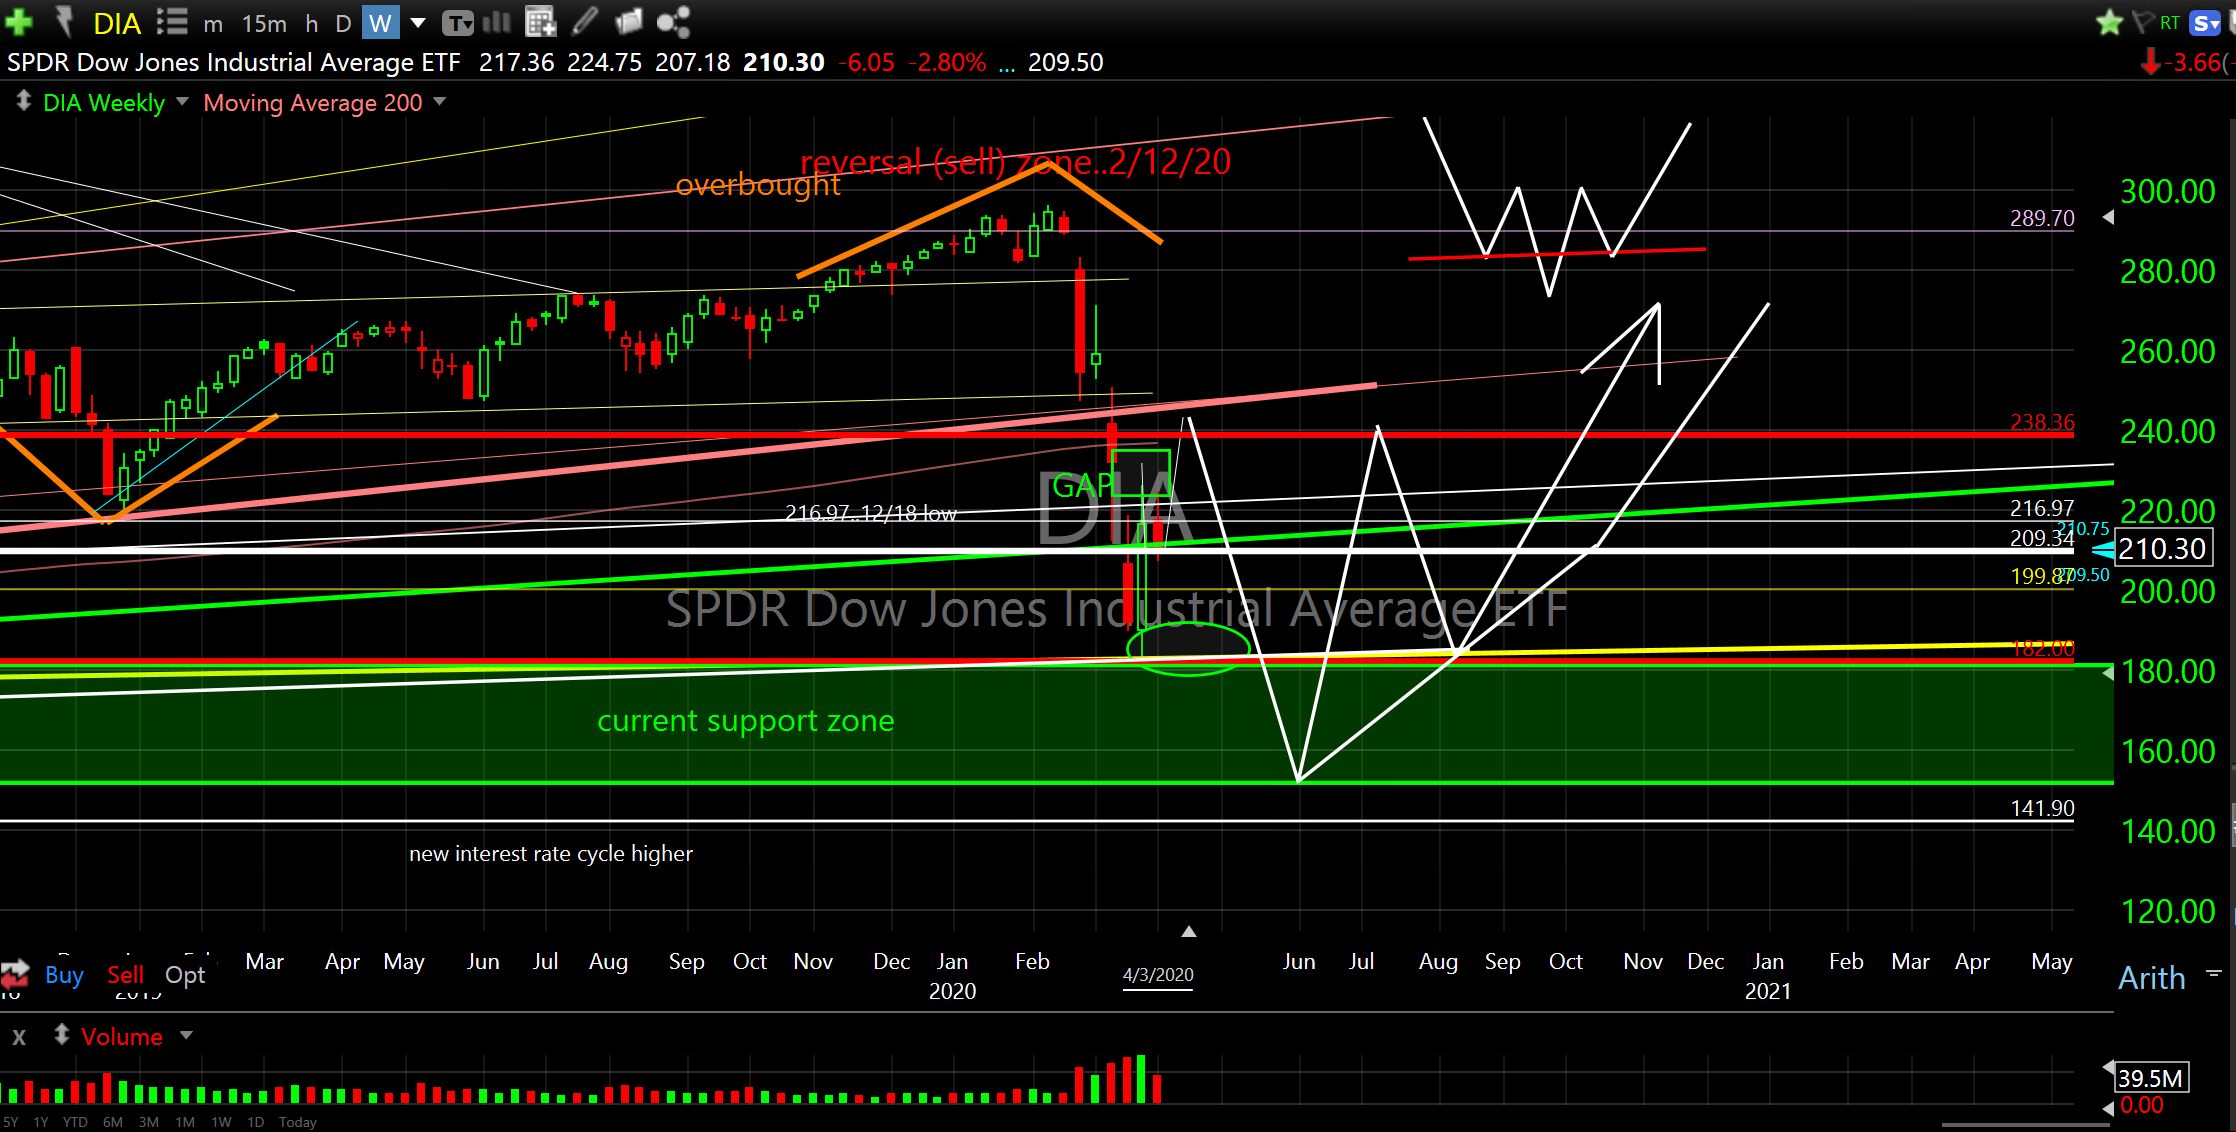
On the other hand, there is a lot of talk about the broader market falling below the March 23rd low to really scare most people out with a capitulation low before bottoming and reversing higher. No one knows if this will happen but if it does it would probably look something like the chart below with a V between a double bottom.
SPDR Dow Jones Industrial Average ETF (DIA)
We will never be sure of the bottom while it’s occurring but by the time the news comes out with an “all clear” the market will have likely already bottomed and ripped higher leaving most everyone in the dust. To take advantage of the lows, you will have to take on the risk and you would be better served knowing when and where to take that risk. That’s why we examine price action around the important reversal levels. Forget P/E ratios..we don’t know the E.
Throughout history, these levels are always extremely hard to buy emotionally but end up being the best times to add risk. This time will be no different. Whatever your favorite stocks are, whatever you want to add to or own, when the broader market bottoms most individual stocks will bottom and begin to reverse higher.
That’s why we study and examine the broader market reversal zones. That’s why I got so aggressive within one week of the bottom in December 2018.
Think of these reversal zones as confidence levels; the lower you go the higher the probability of bottoming and reversing higher. Currently, we are experiencing a kind of forced deep mean reversion. The closer we get to deep, longer term means, the higher the probability of bottoming and reversing higher. The further we get stretched down the more tension there becomes for a reversal higher.
Just note the recent surge higher from the March 23rd low of Dow 18,000. Did I know it would bottom there and reverse higher? No. Did I know that was a very important reversal zone? Yes. Remember what I wrote here after the close that day, before the surge.
The bottom line is we know, in advance, the levels where price is likely to bottom and reverse. What we don’t know is for how long. We know Dow 18,000 is important. We know it’s so important that if it gives way and price begins closing below 18,000 it will probably default to the next important level which is Dow 15,000/14,000. The best we can do is concentrate on what we know, not what we don’t and all I can do is give you the confidence intervals to help minimize your risk.
The recovery, when it does happen, is likely to be pretty quick in my opinion. A violent, sudden, deep mean reversion caused by an outside agent with a probable short life span occurring during a robust economy is likely to result in a recovery built on a strong economic infrastructure fueled by massive stimulus measures that dwarf the QE of the last decade.
When the bottom is finally in the damage will be priced in and the upside is likely blue skies for years to come. So, while we may have a really tough slog for six to nine months when we do get on the other side of this we should experience higher prices for many years to come, leaving the risk of further collapse in the dust and in hindsight it will likely be one of the greatest times to enter the market. So, it’s not the speed of the recovery but the lack of risk associated with it which will be realized as time goes on which should increase the trajectory as we become more separated from wherever the bottom occurs.
I was asked last week what stocks I would be looking to own when the recovery begins.
When looking at individual stocks I look for reversals that align with broader market reversals. If an individual stock reverses at its’ own unique critical support level and that coincides with a broader market reversal at its’ own unique critical support level you increase your odds of success.
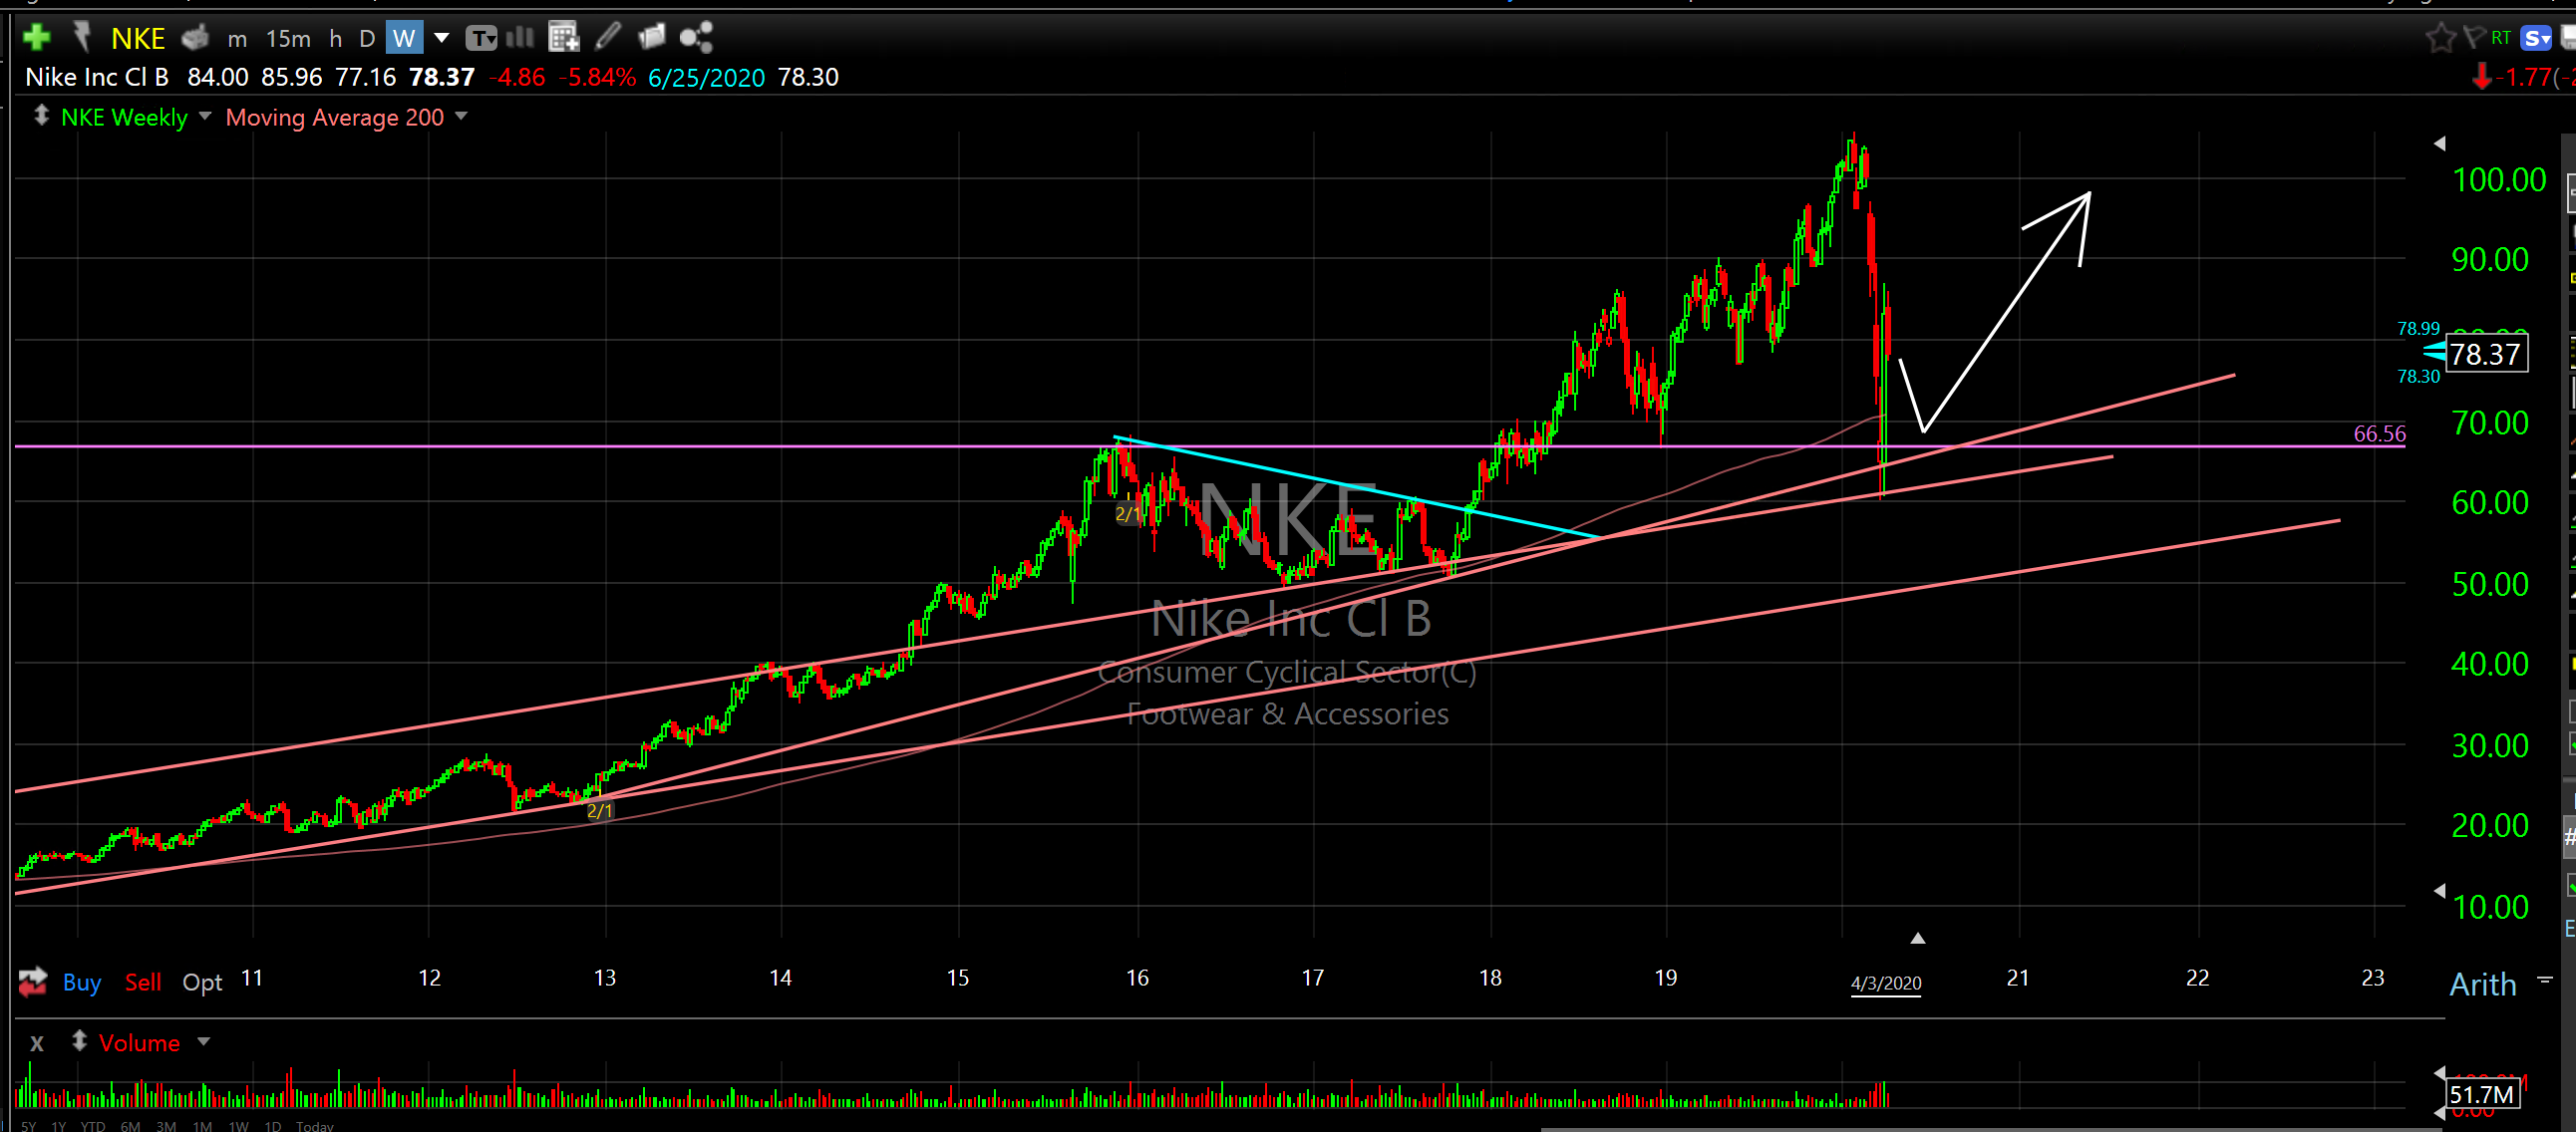
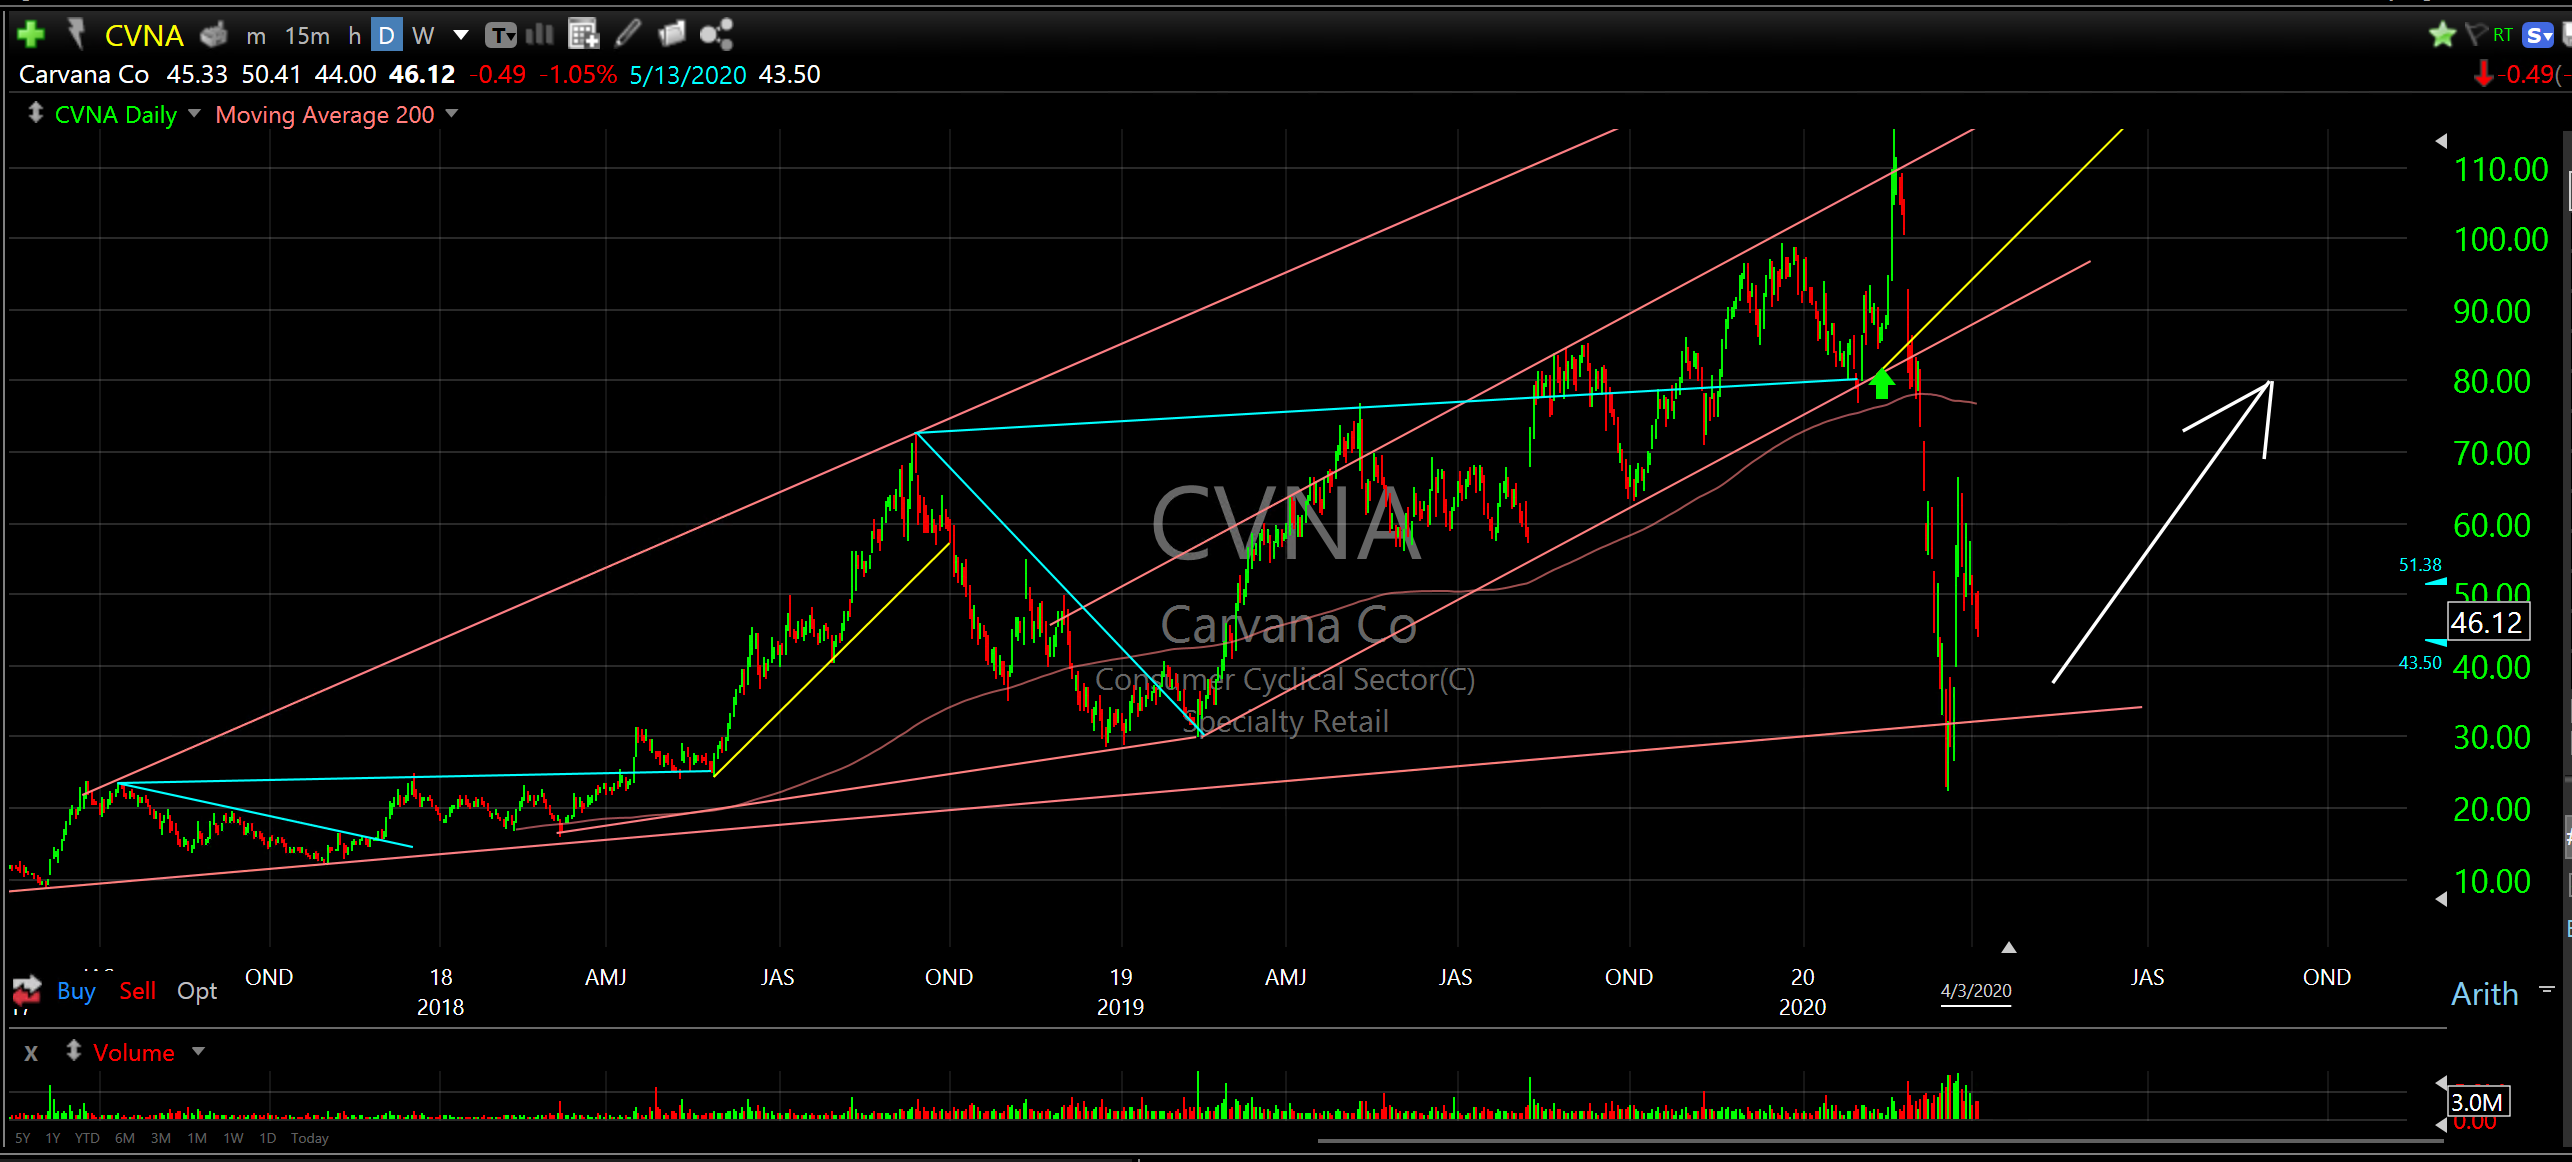
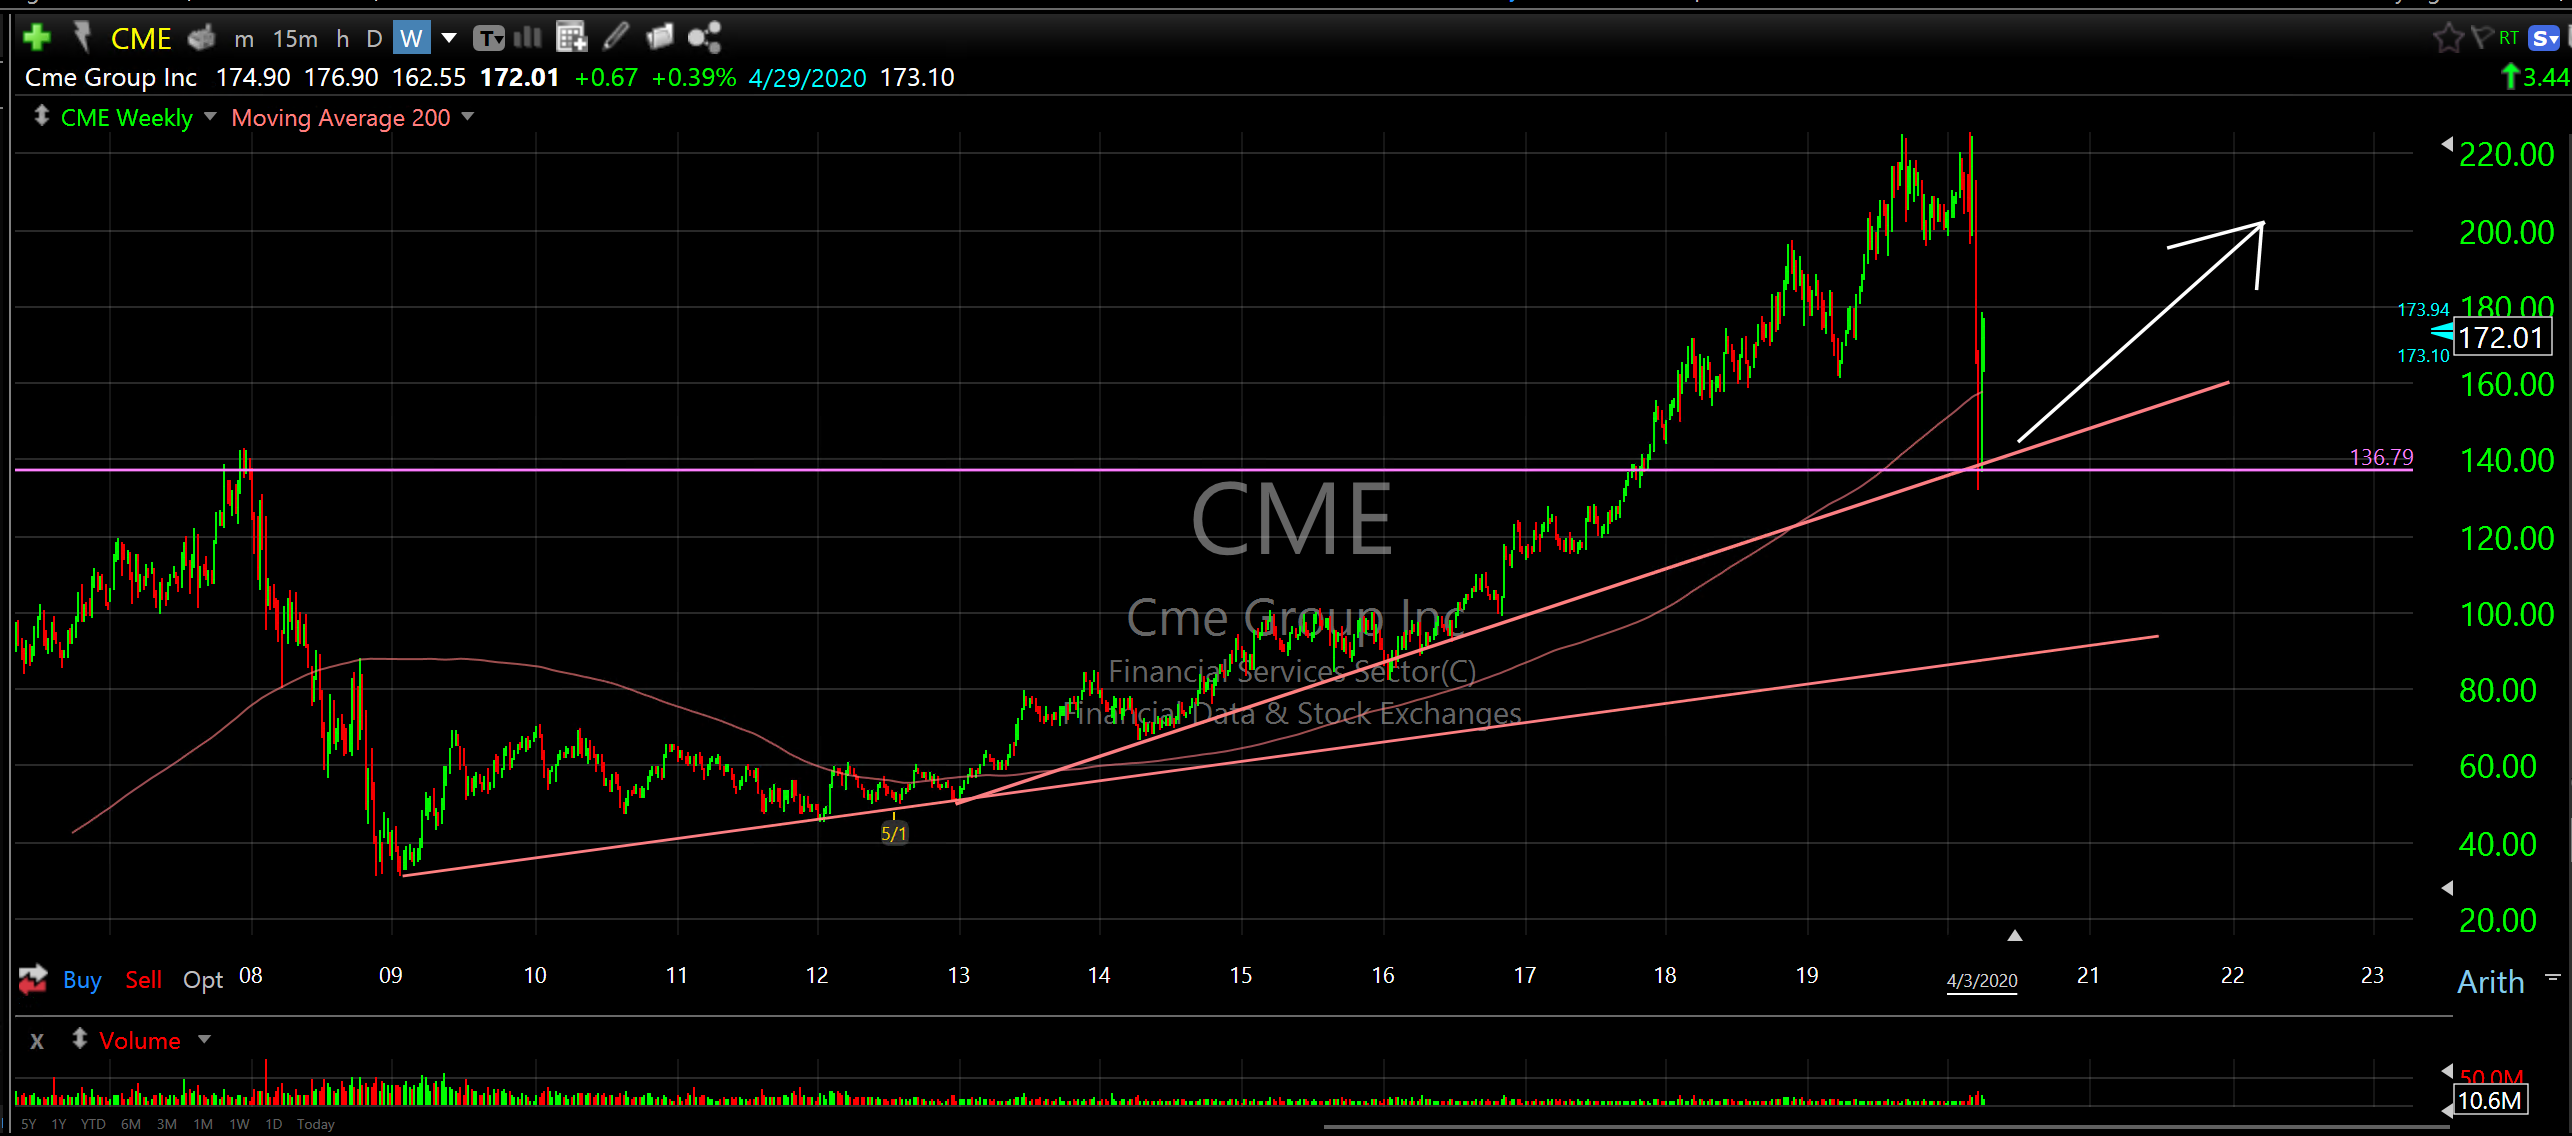
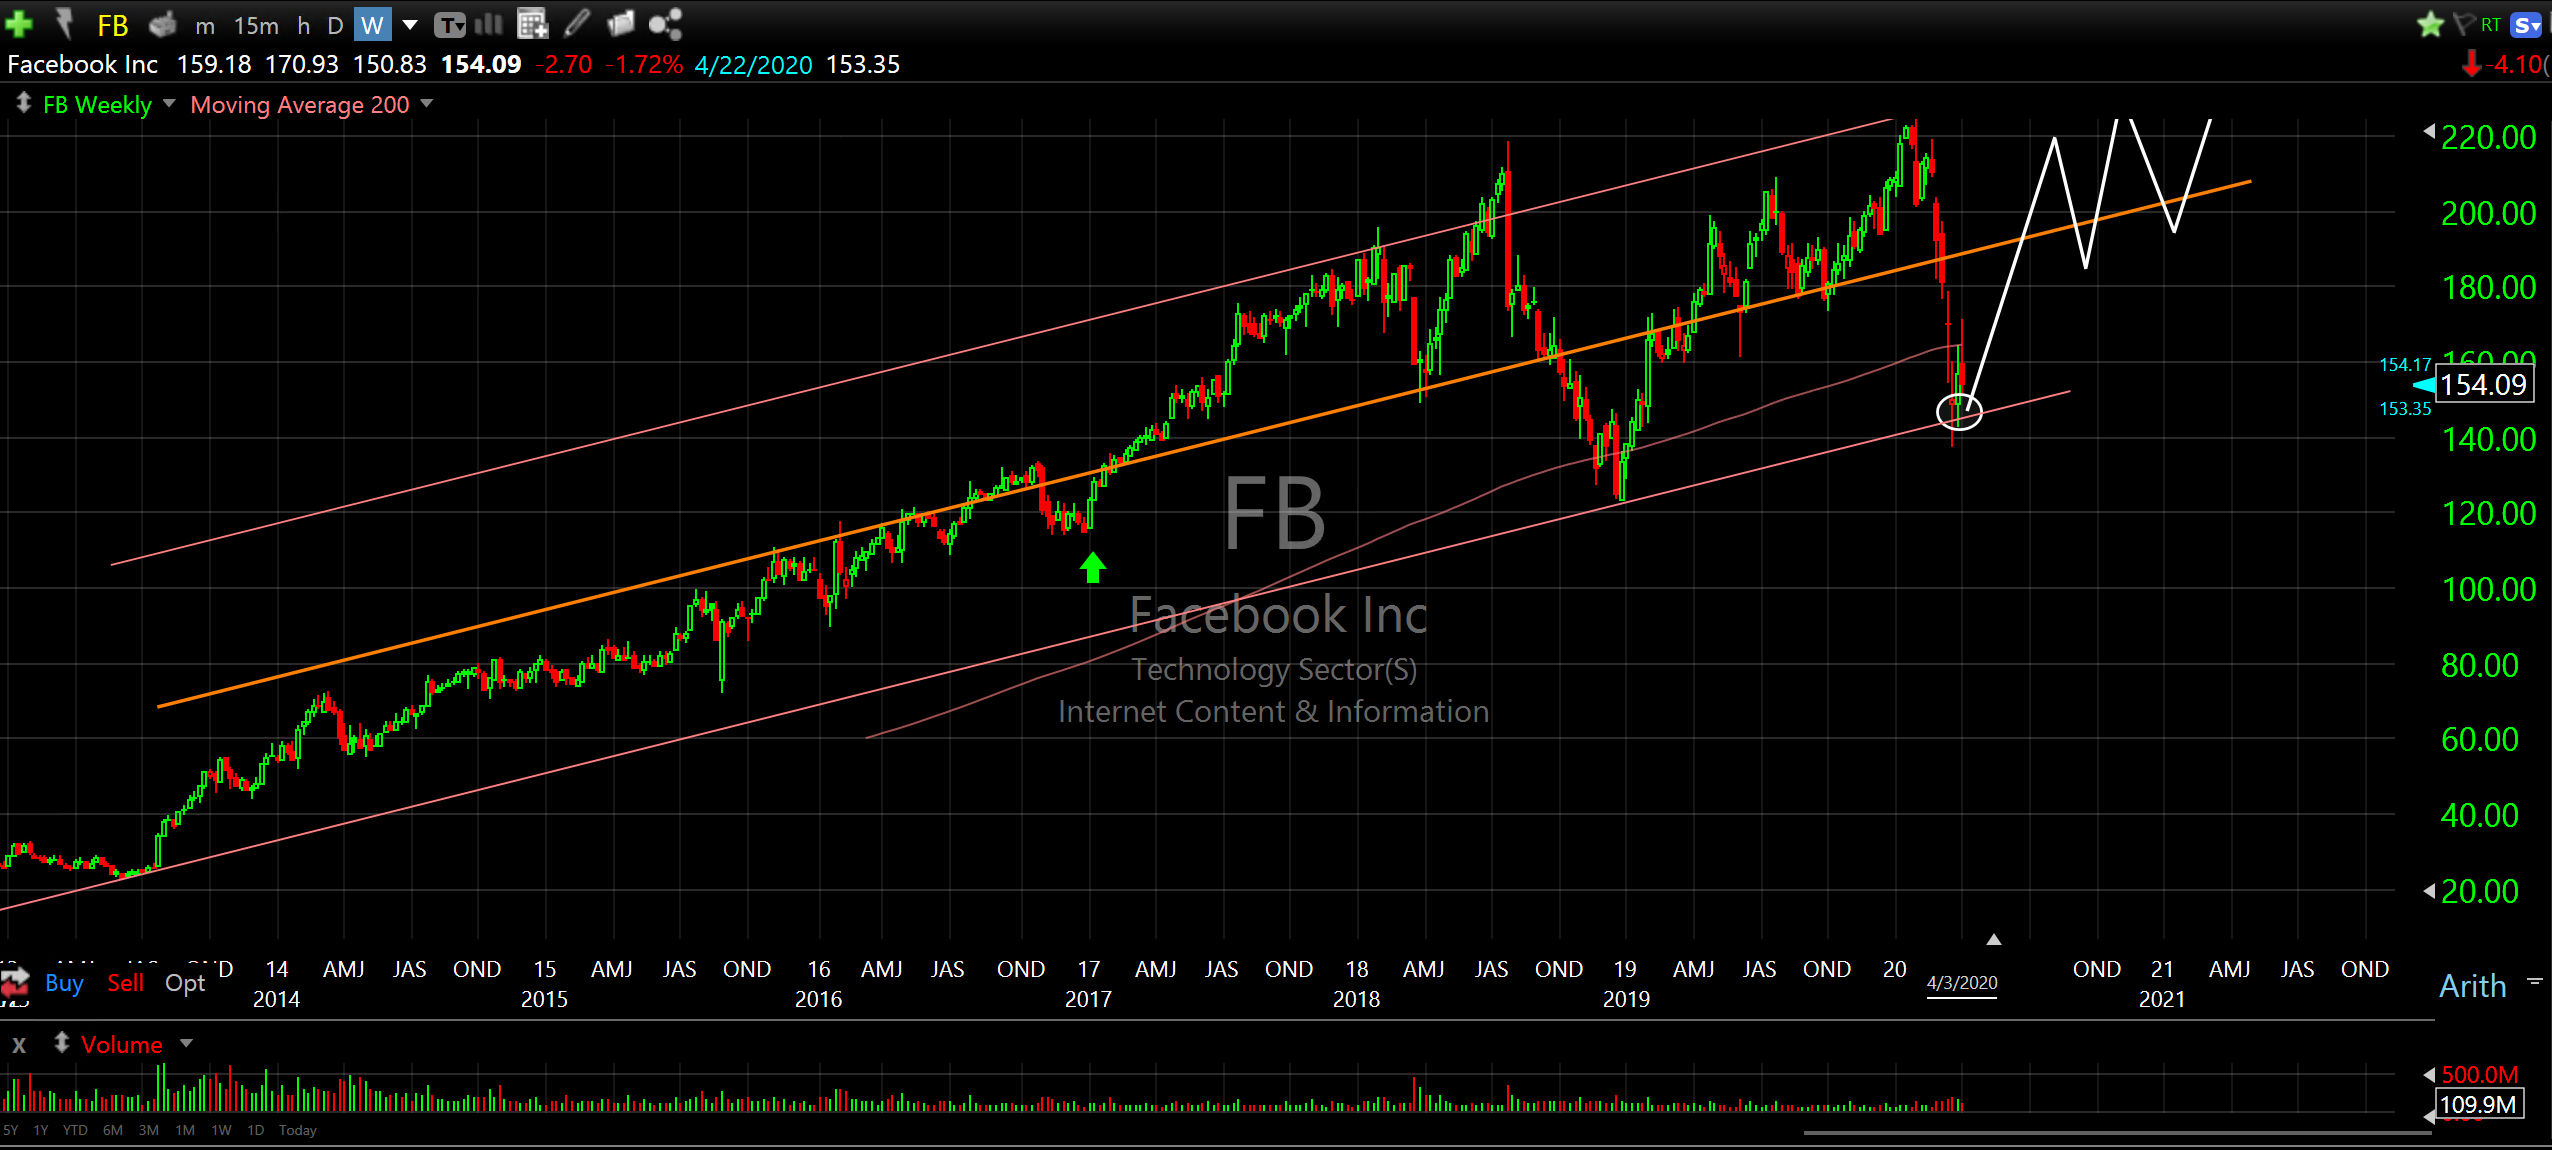
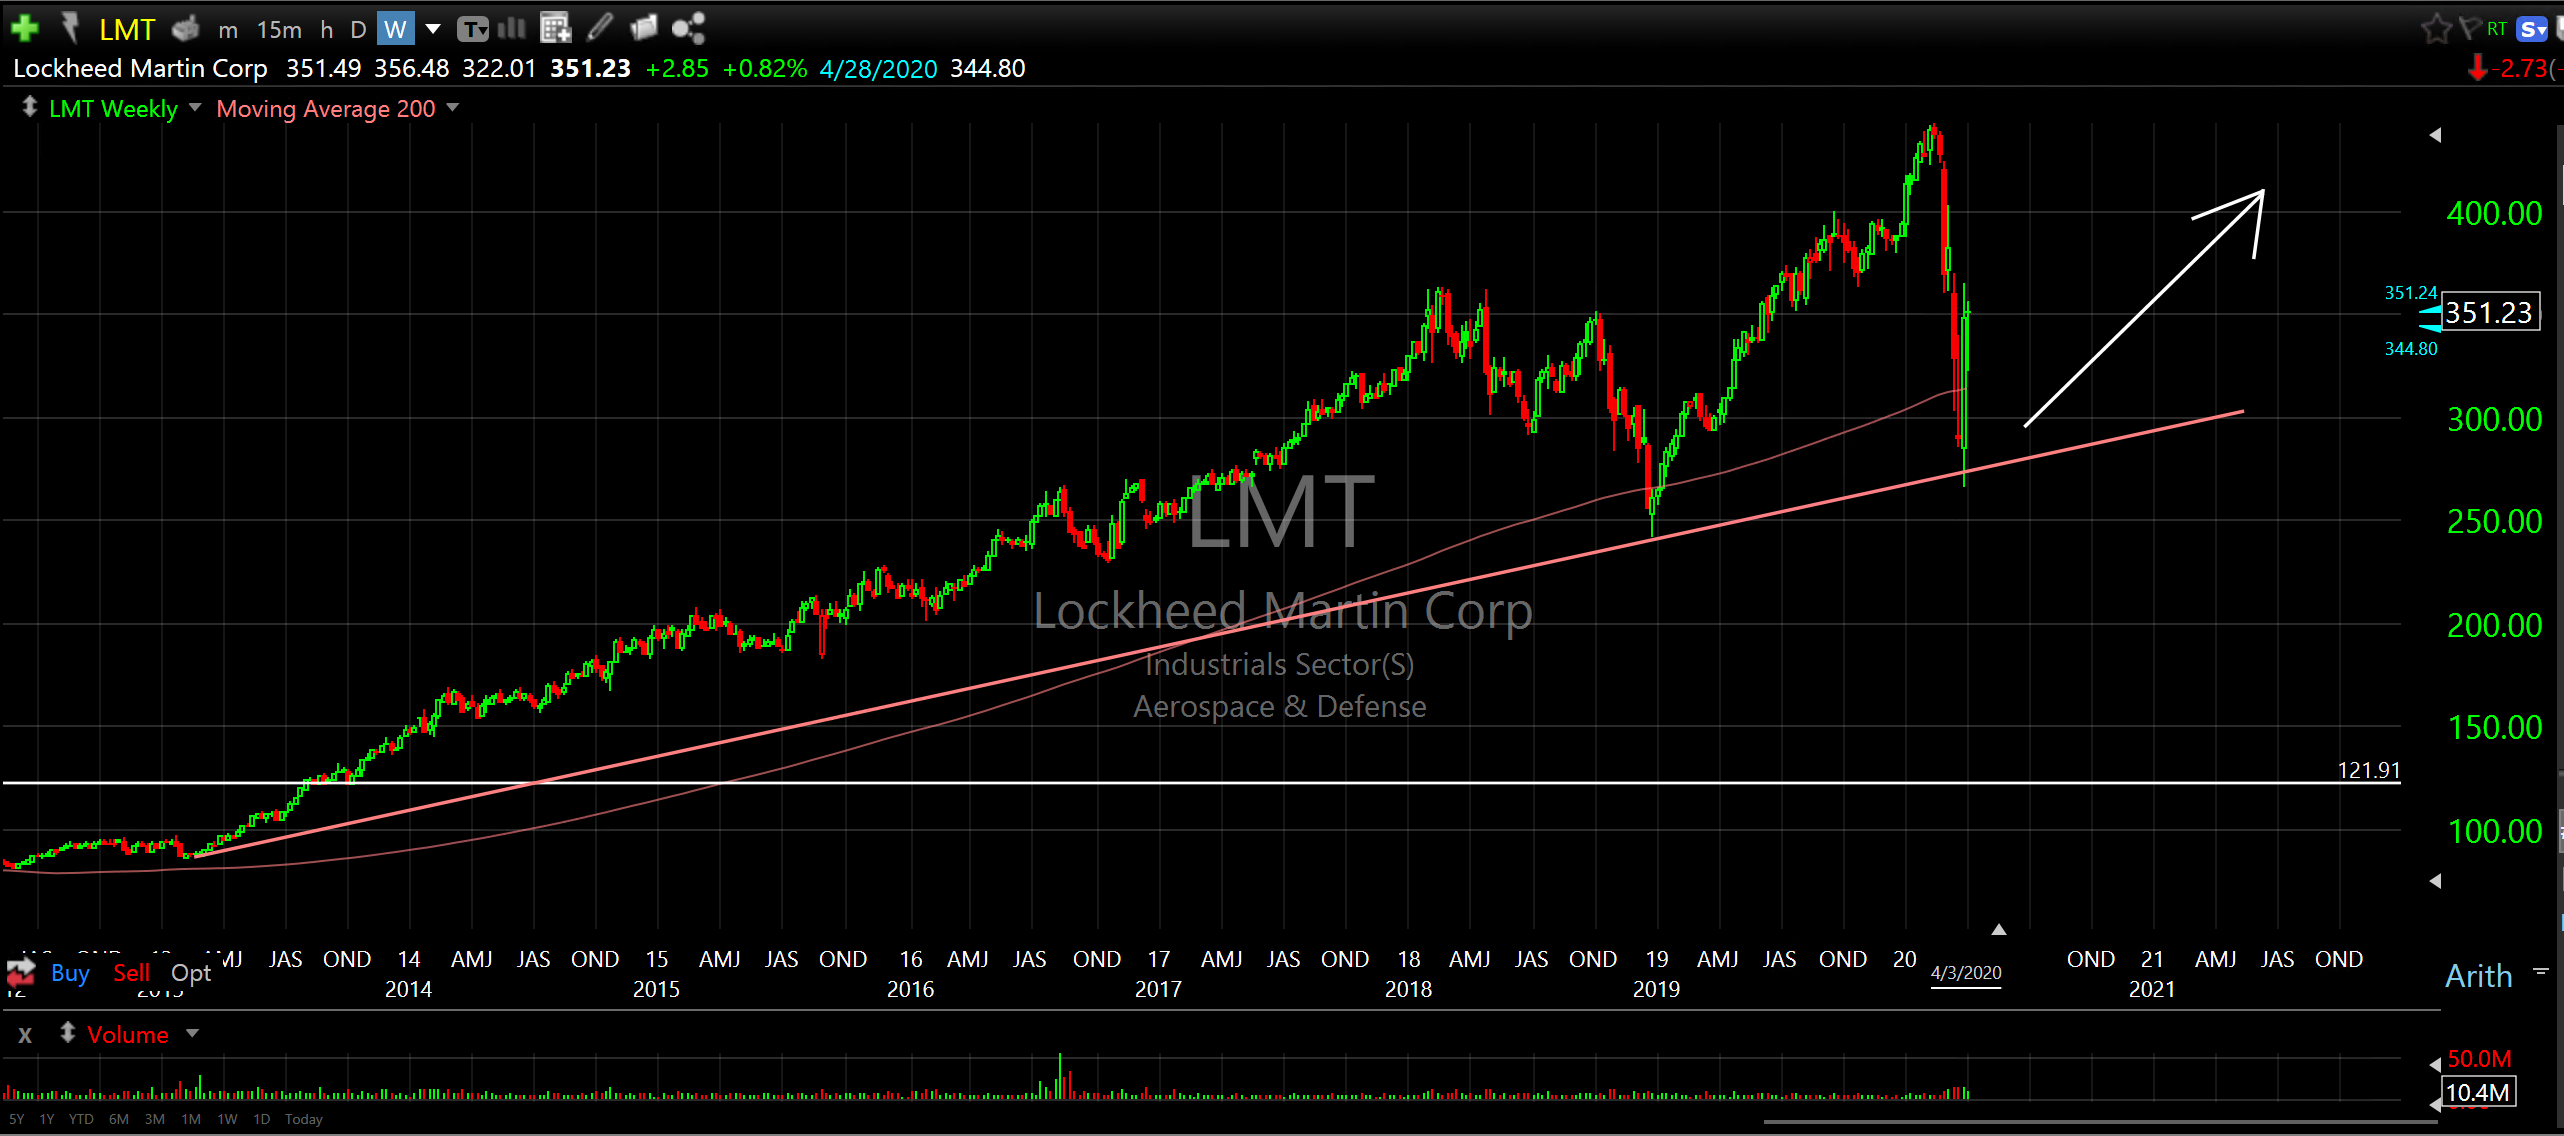
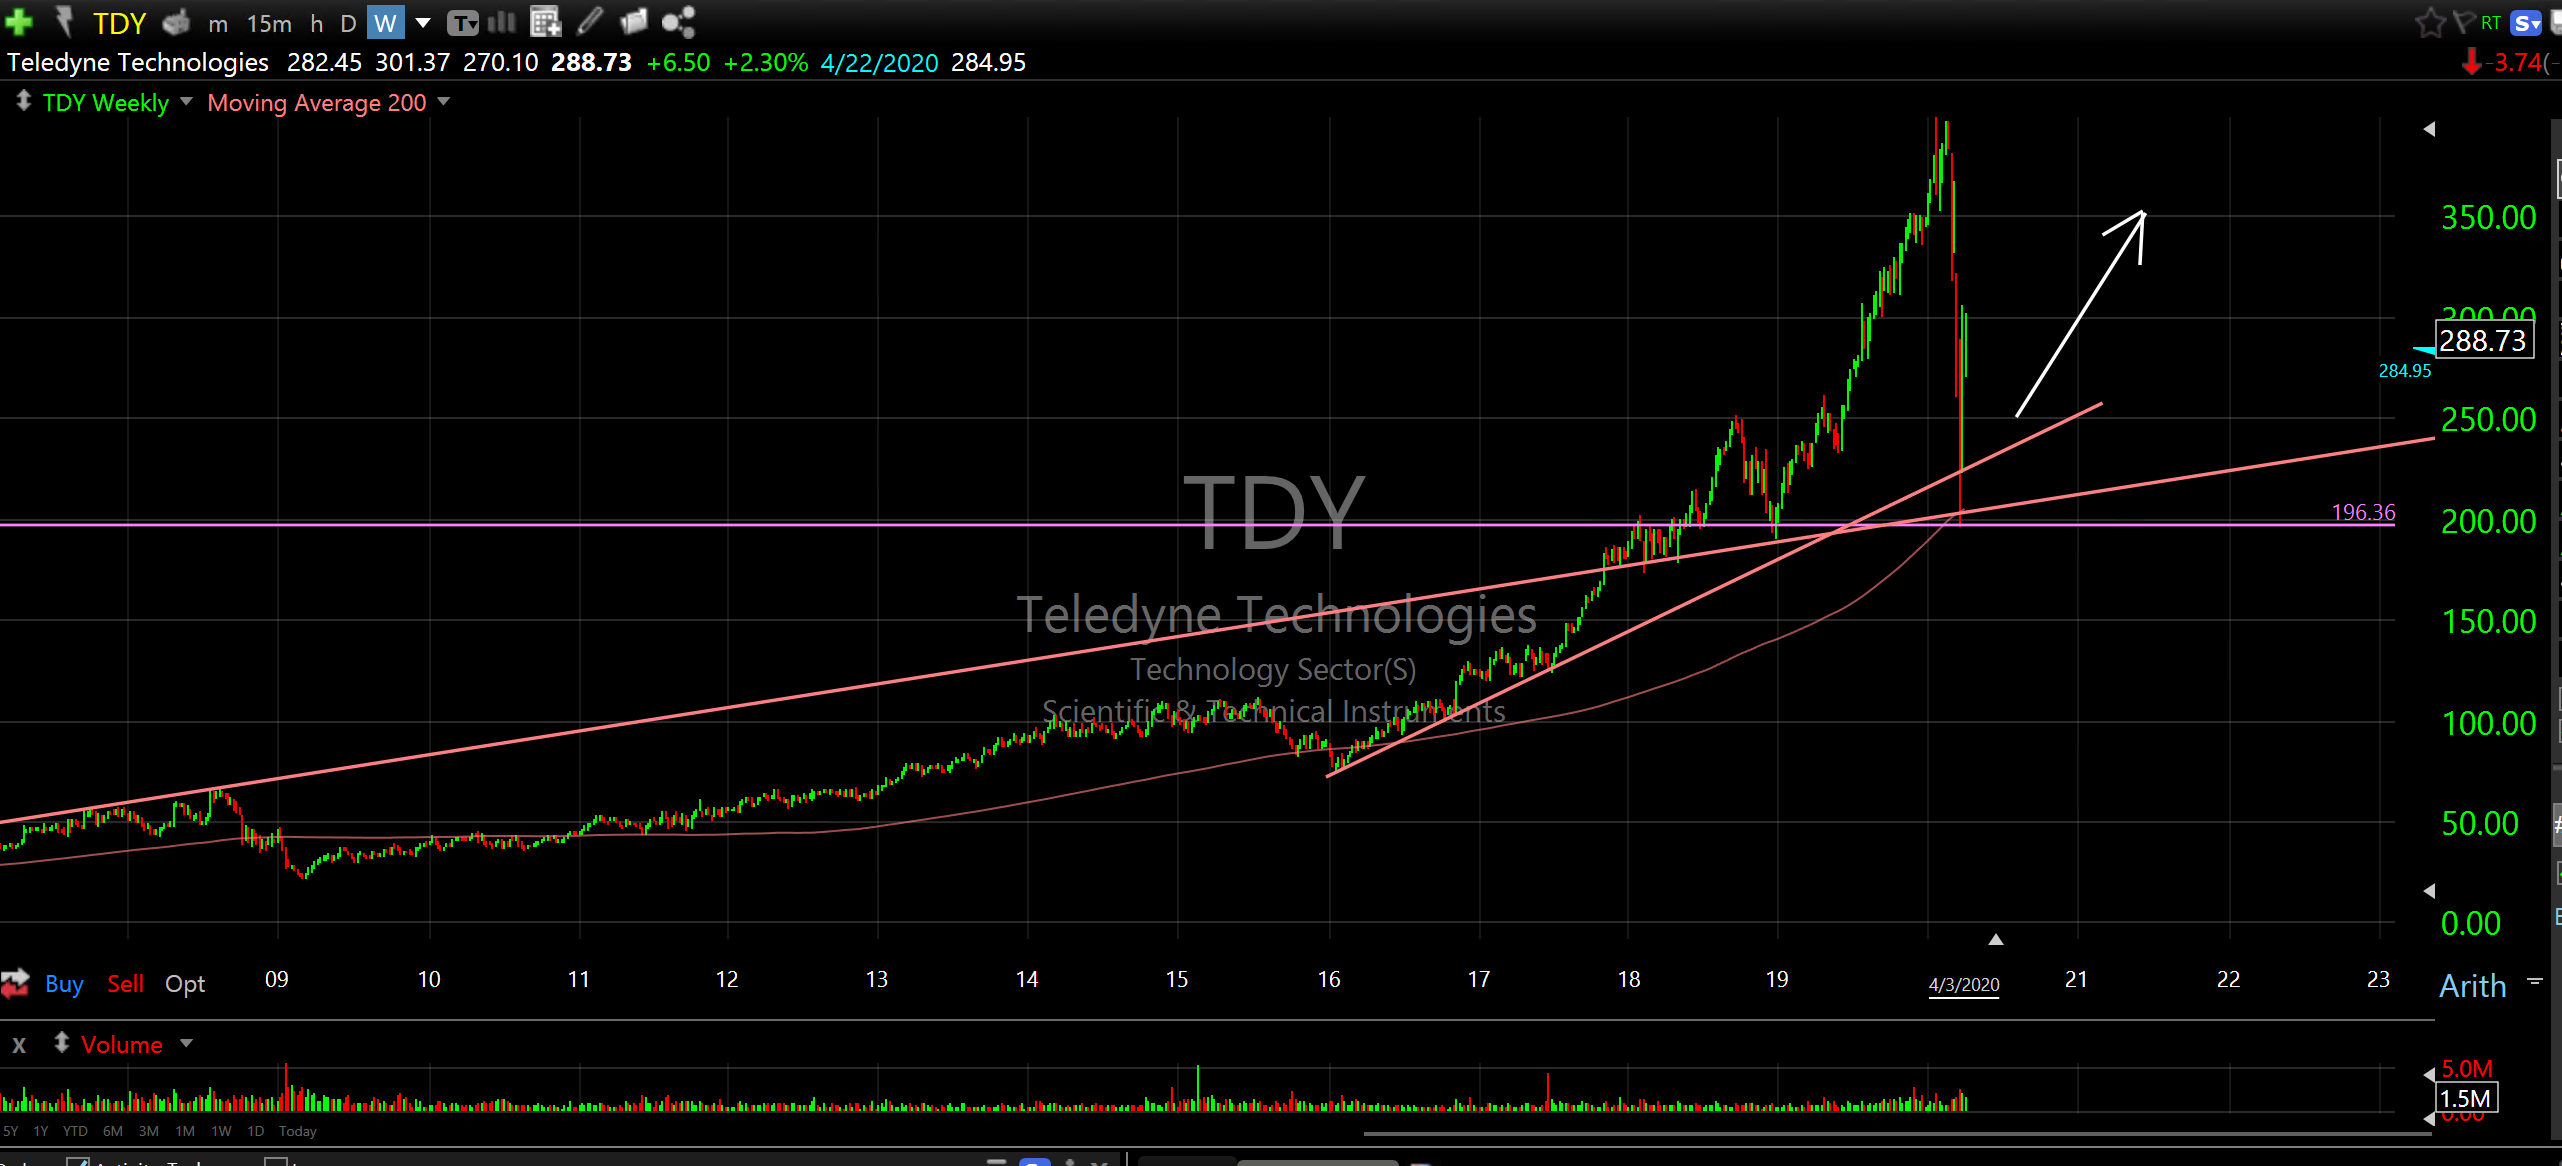
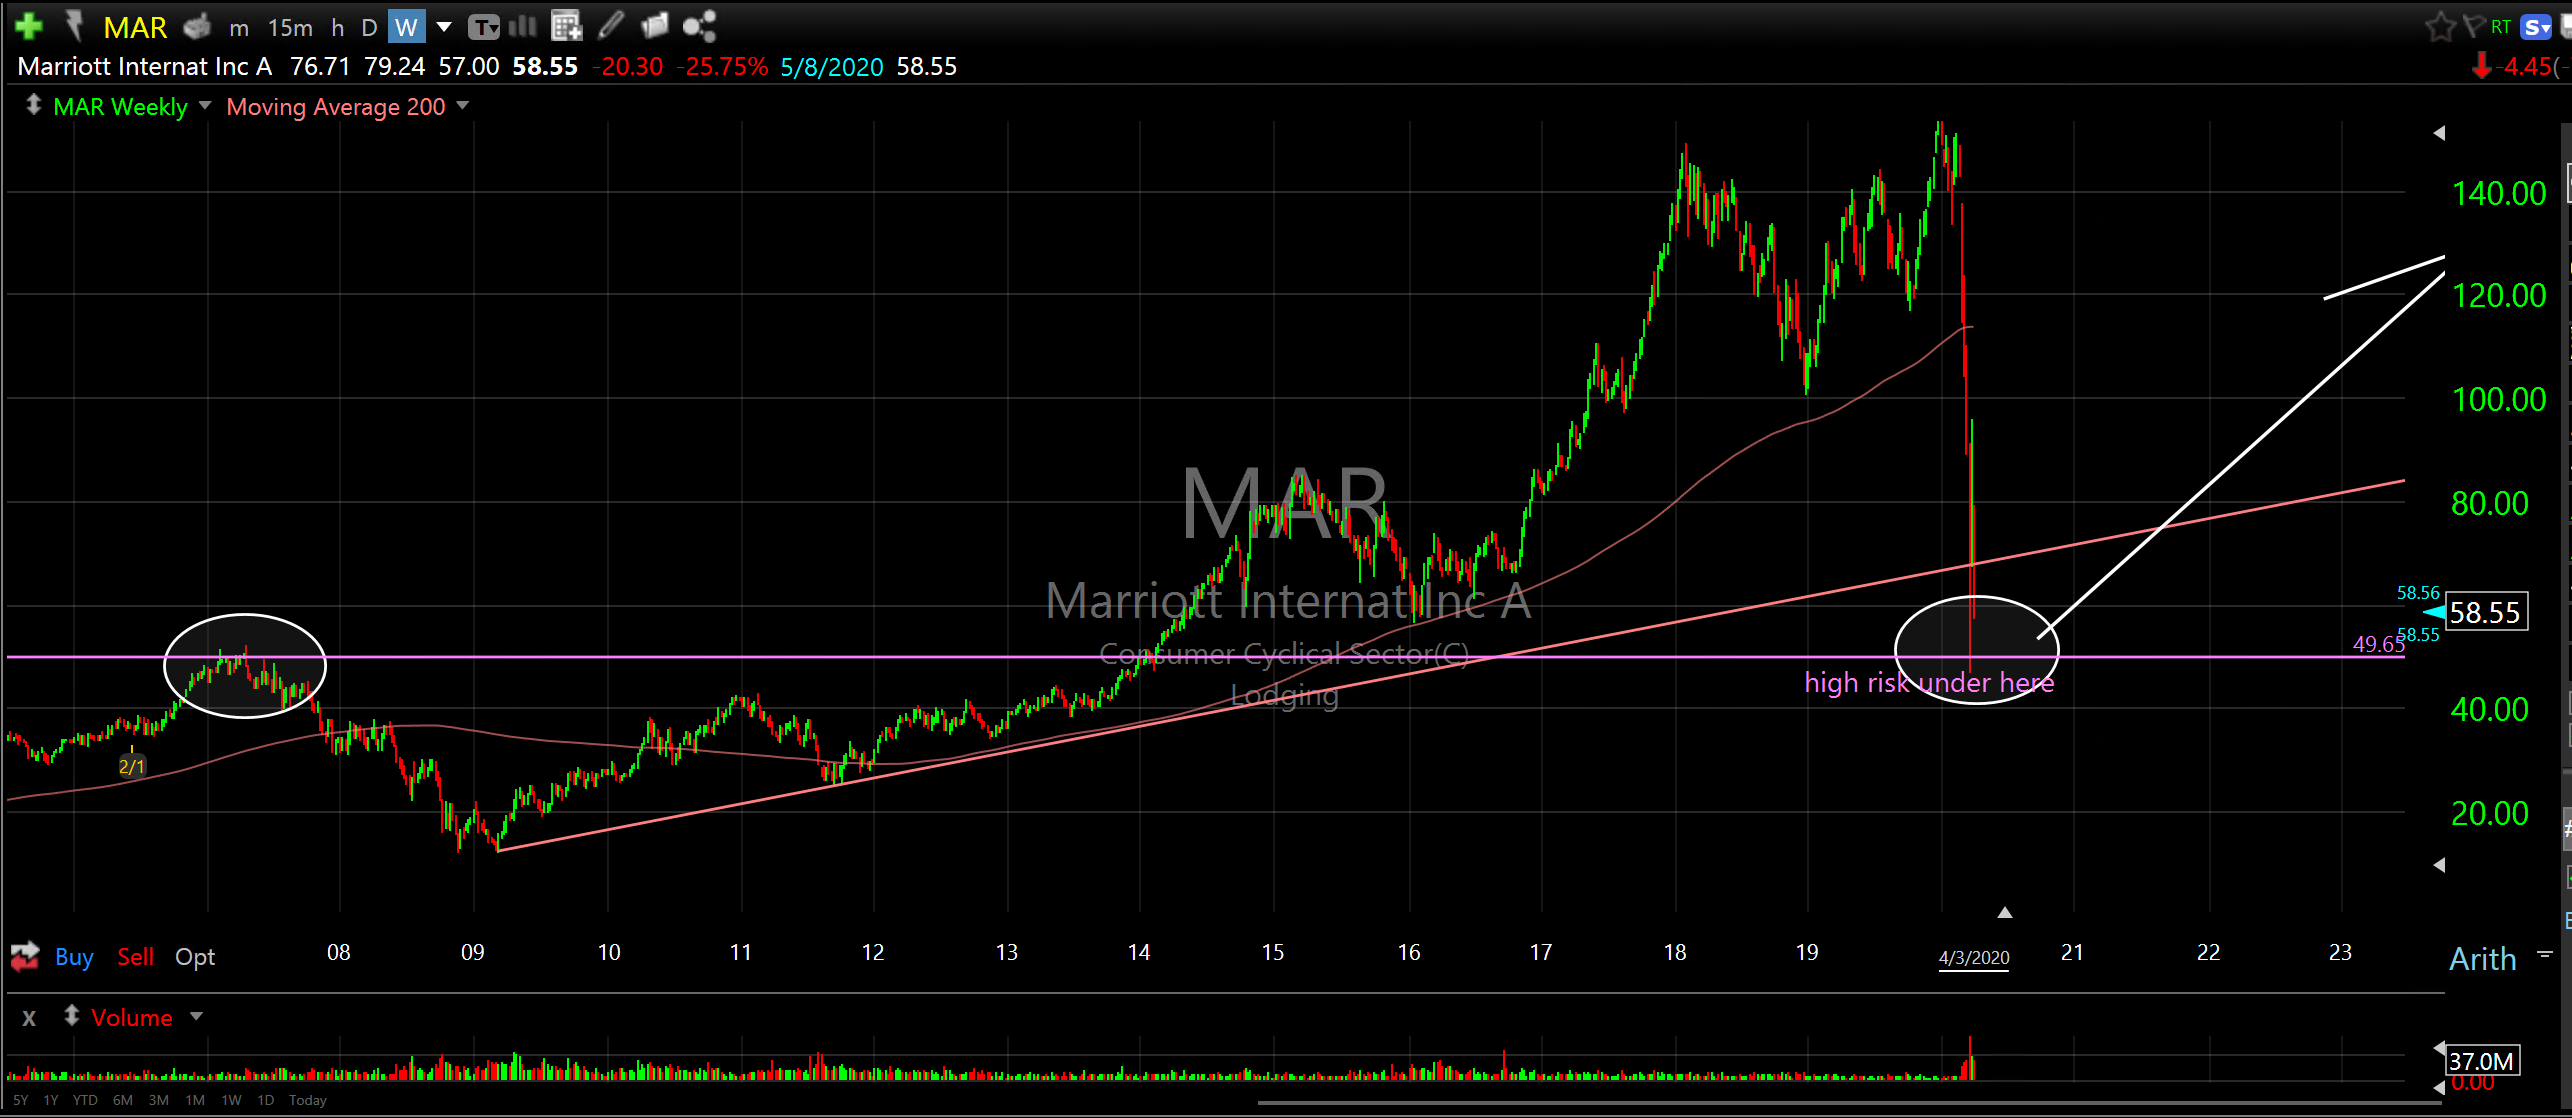
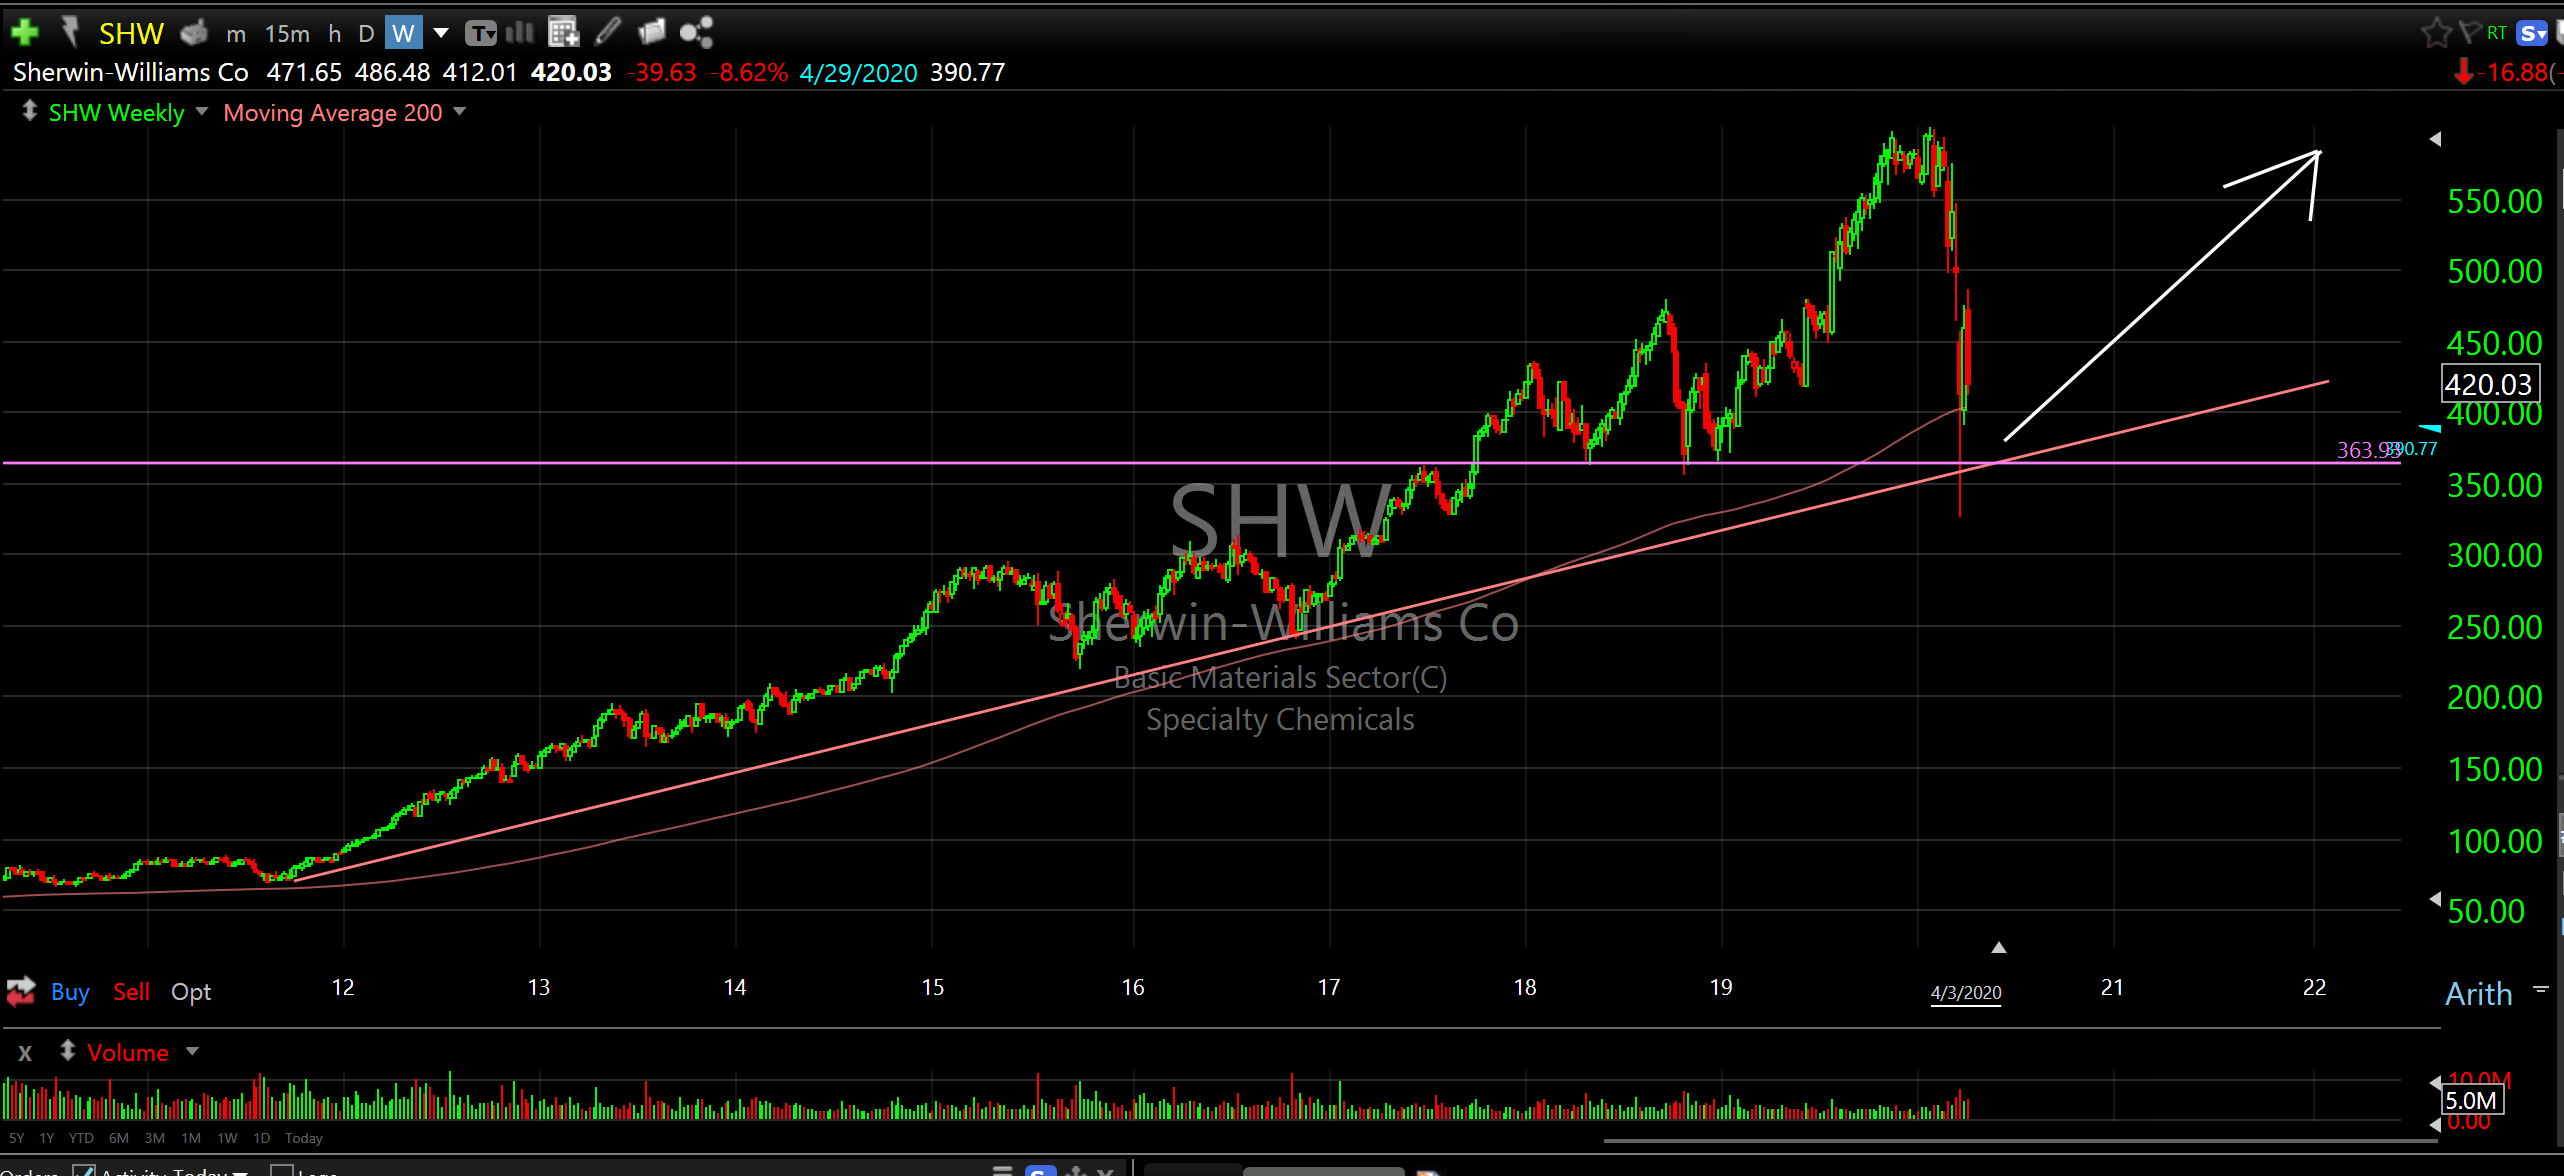
I am looking for individual stocks that were in a strong uptrend with the broader market before the Corona Crash and got slammed with the broader market. I then filter for those that bounced the most off their own individual support levels beginning March 24th. These are the companies that will likely perform the best if we get another retest of the lows and subsequent bounce.
Here are some examples. Remember, the reversals zones, the support levels from which all of these surged higher from were established years before. No, you can’t make this shit up and it’s not a coincidence. I could show you the extreme lows of 2001 and 2009 occurred almost exactly at reversal zones that were established decades earlier.
The following are not recommendations to buy but rather examples of the kind of price action I’m looking for. They represent the asymmetric risk/reward associated with historic market bottoms that only occur once or twice in a lifetime.
Nike Inc Cl B (NKE)
Carvana Co (CVNA)
CME group Inc (CME)
Facebook Inc (FB)
Lockeed Martin Corp (LMT)
Teledyne Technologies (TDY)
Marriott Internat Inc A (MAR)
Sherwin-Williams Co (SHW)
Be safe, stay healthy and remain prepared for the recovery on the other side.
Don