I don’t think I can be any more accurate than I have been about the broader market (SPY) recently. We got the dip I have been warning about and we got the steep ascent I was expecting at one of the two reversal levels I pointed out (the higher one). The lower level reversal I have been sharing with you would have been stronger, however, please note the speed at which price has moved from the upper reversal level on Tuesday. Up over 5% in four days. Strong like bull.
Is this the all clear signal? While no one knows the answer to that question I think we can be assured that buyers are certainly interested at lower key levels. This is a good thing. It’s when buyers do not step in at lower levels that we need to be concerned. I also think the speed and strength of the move up has been partly fueled by short covering; short sellers having to buy back shares they borrowed to bet on the market going down. This tends to squeeze price up in a frenzy to cover.
SPY also busted back up through that all important area of SPY 280 and we are only 2% from making new historic highs. Remember, the technology sector (XLK) is only up 17% from the “dot.com” high of 2000, 19 years ago! In addition, the S&P 500 index is the same price it was a year and a half ago. Price has been consolidating this entire time to “adjust” to the steep expansion that occurred between early 2016 and early 2018. Remember me writing about an unsustainable slope in 2017?
So, through my eyes, price is “preparing” for another expansion cycle. Will this begin now or will we re-visit SPY 265/270? While no one knows the answer to that question either, I think it is certainly possible to get down there again. It would sure be a stronger “foundation” to expand from but price may never get there again and if you wait for that you will miss the boat entirely. What we are trying to do here is nudge our positioning and exposure to constantly changing market conditions to reduce risk or increase reward. I think we can start nudging again…a little. By the way, the other choice is to do nothing and just hope.
As time intervals decrease it becomes more difficult to “nudge” accurately. And, what we are really trying to do is avoid the meat of any longer term bear market/recession. It can be done…I’ve done it multiple times. (But, as “they” say…”Past Performance Does Not Guarantee Future Results”.) So, unless the broader market (include SPY, DIA, IWM, QQQ, etc) begins to fail at primary support levels this 18 month consolidation should lead us into another expansion cycle that could last another 12-18 months.
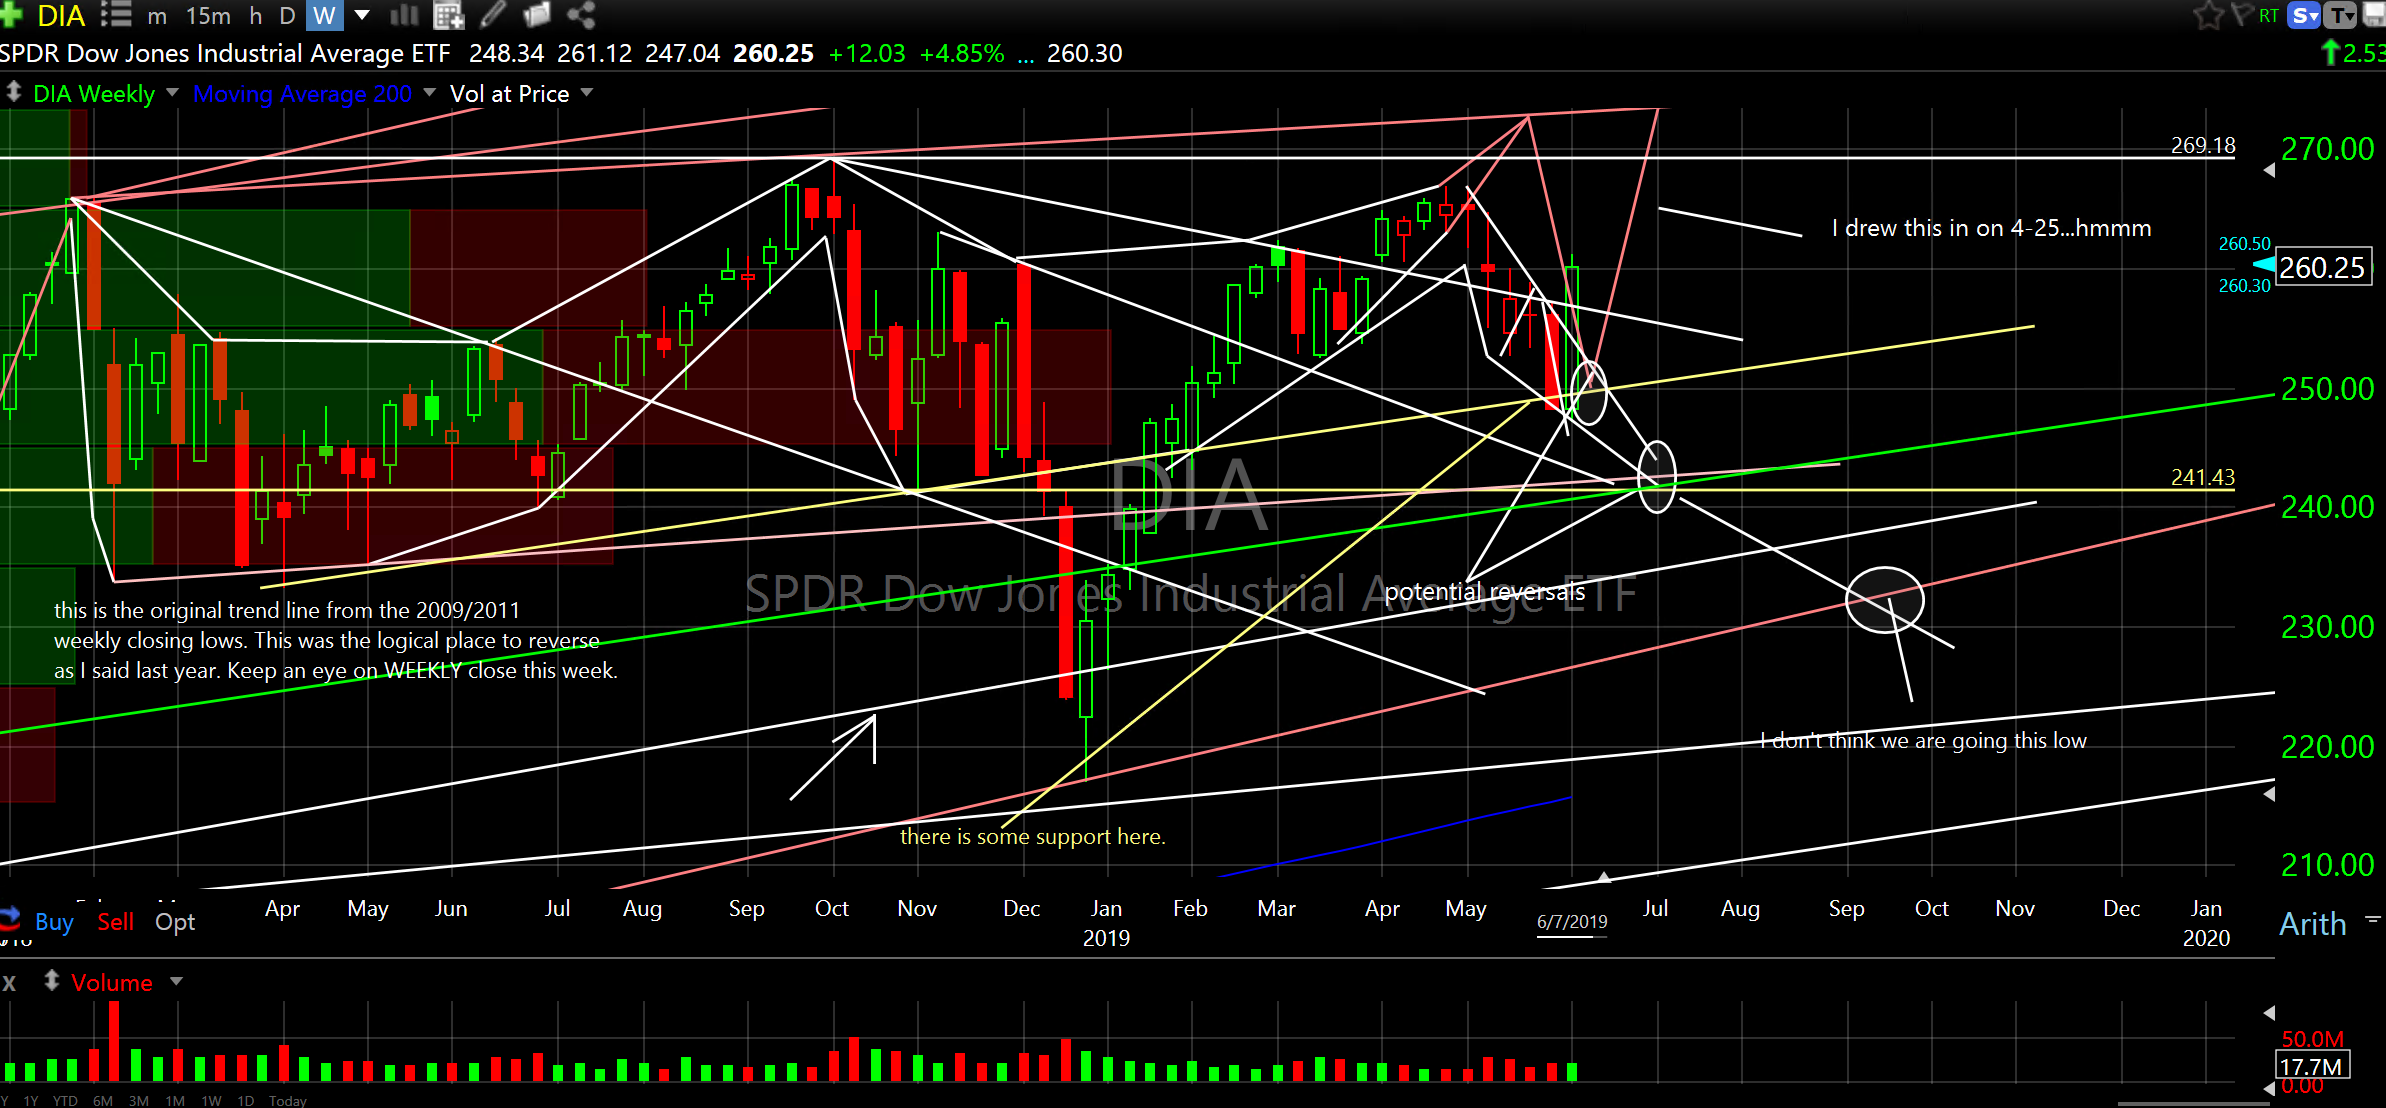
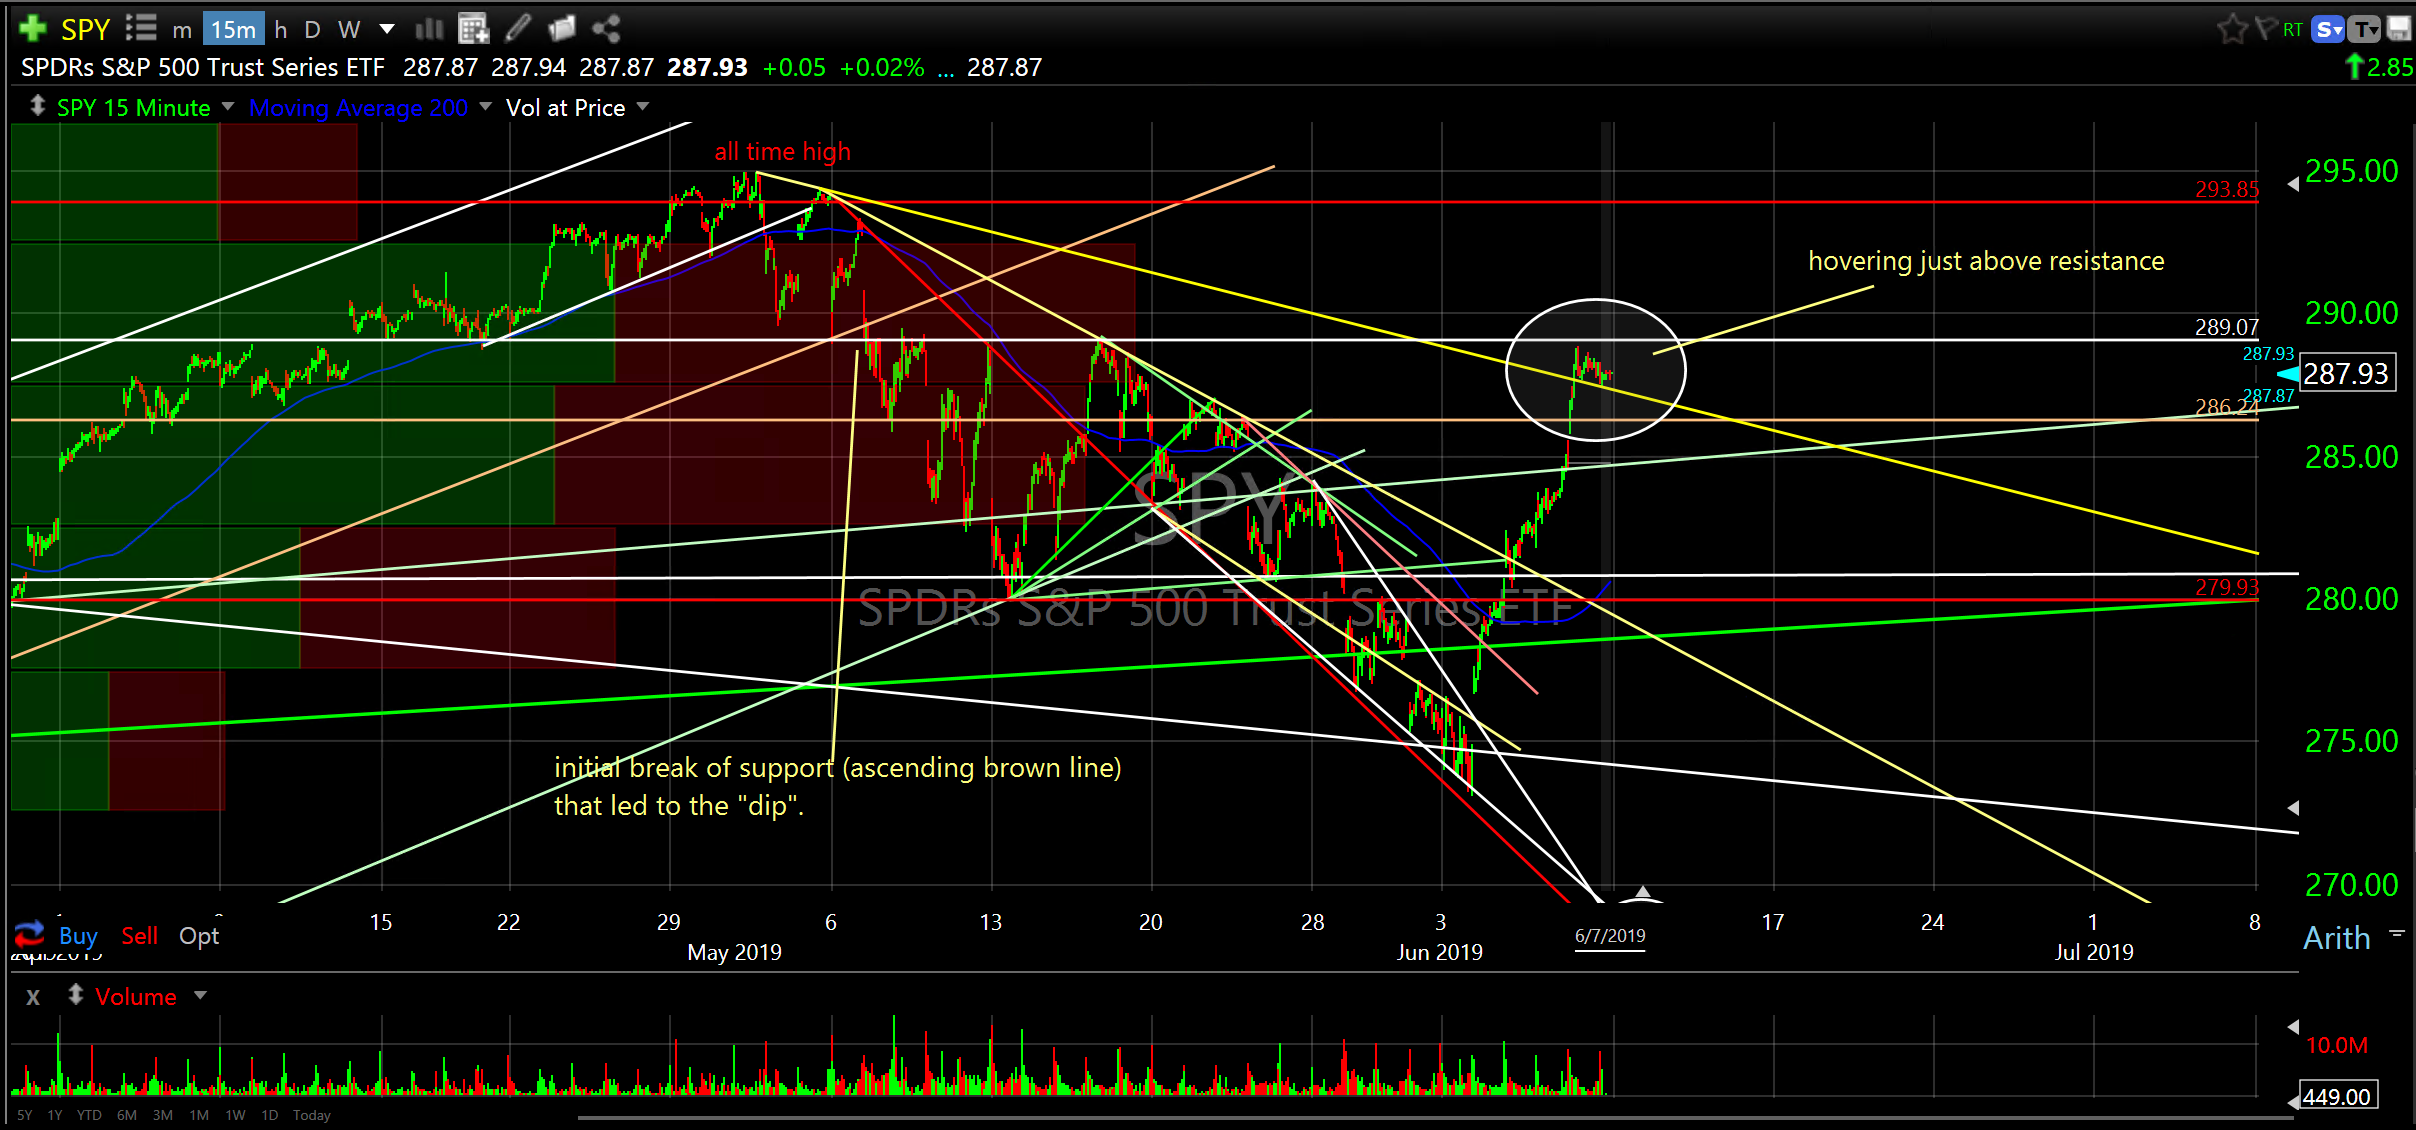
Please review charts of SPY and DIA. Please note the size of this weeks gain on the weekly DIA chart. Check out the 15min chart of SPY that shows price action for the past two months.
Down Jones Index ETF (DIA) daily
S&P 500 Index ETF (SPY) 15 minute
So, now what? Do we hold what we have? Do we buy more?
There are positions open that I am concerned with but not enough to sell. But, please get out of any position you are uncomfortable with.
Here are some entries to ponder…
Intel Corp (INTC) weekly
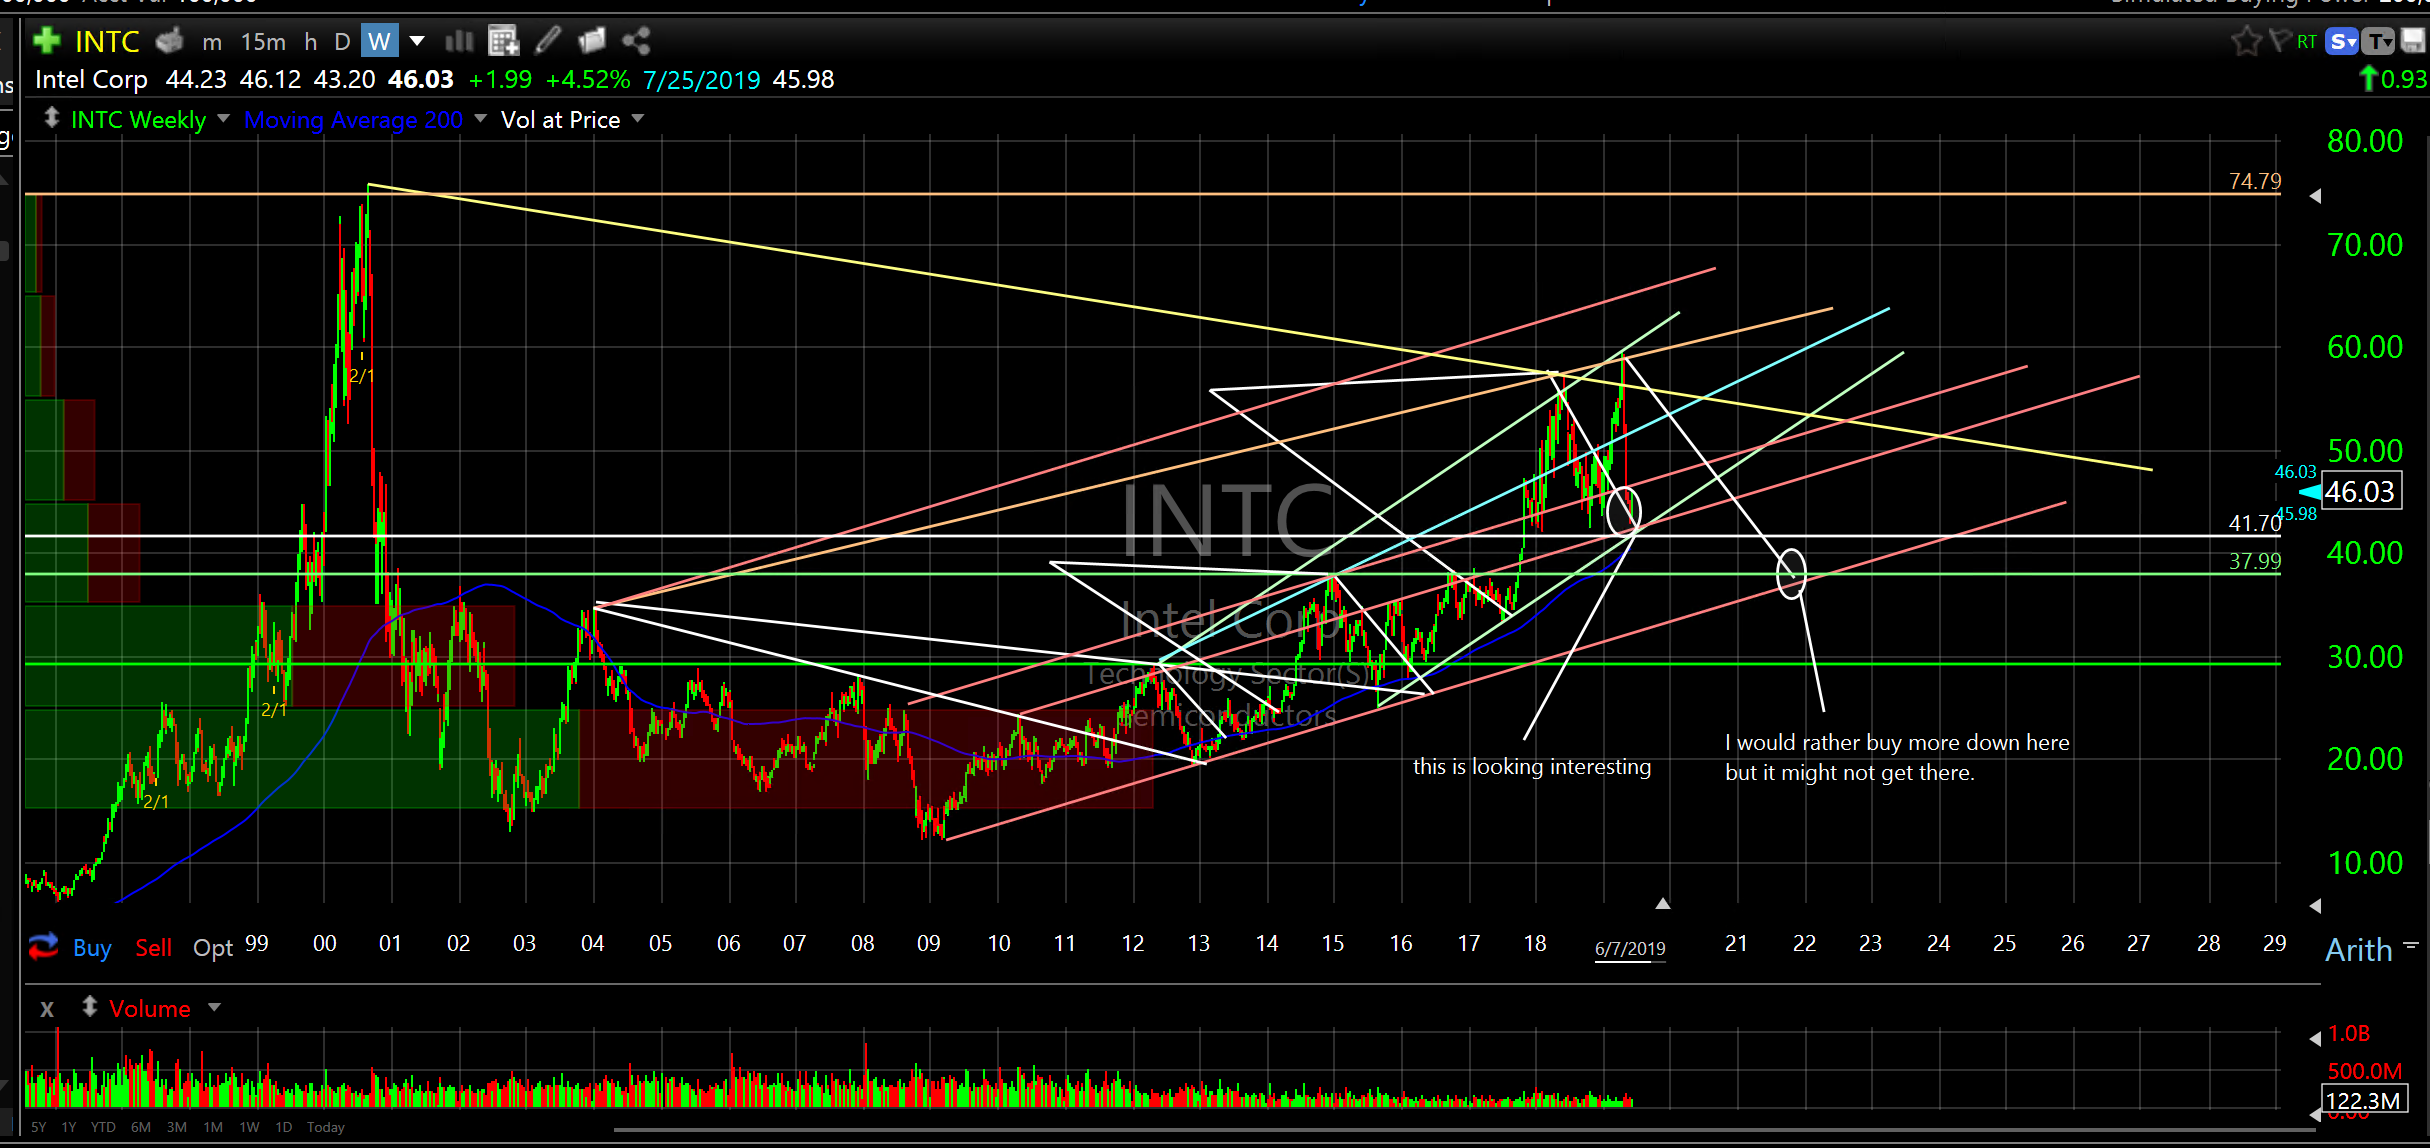
Intel Corp (INTC) weekly
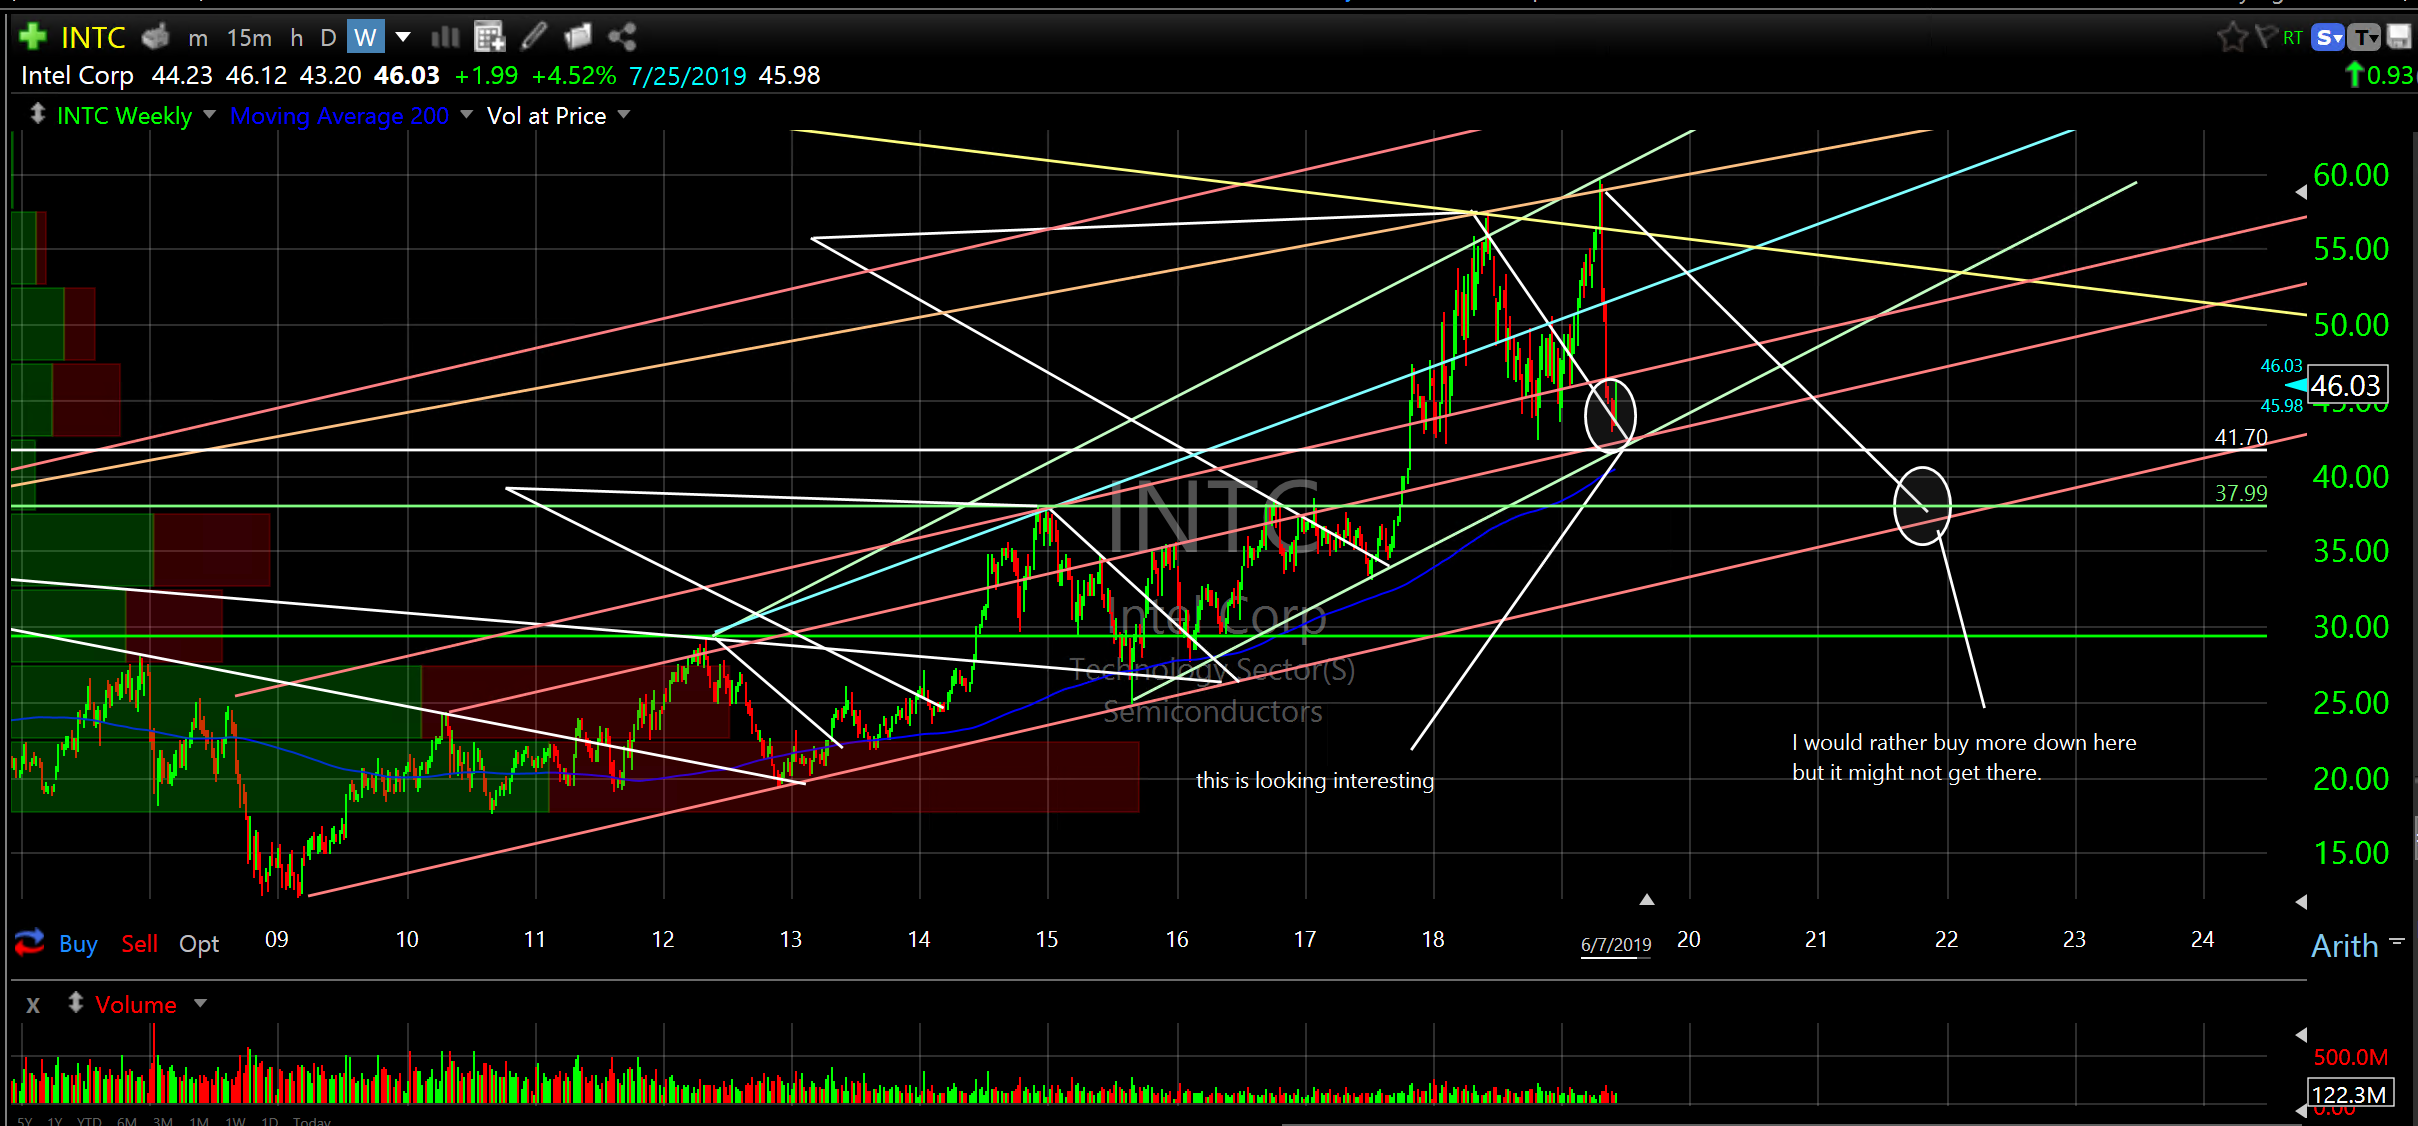
Intel Corp (INTC) looks awesome. I might buy some Monday morning. Please review both charts. If I do buy I will send out a note.
Sonos (SONO) daily
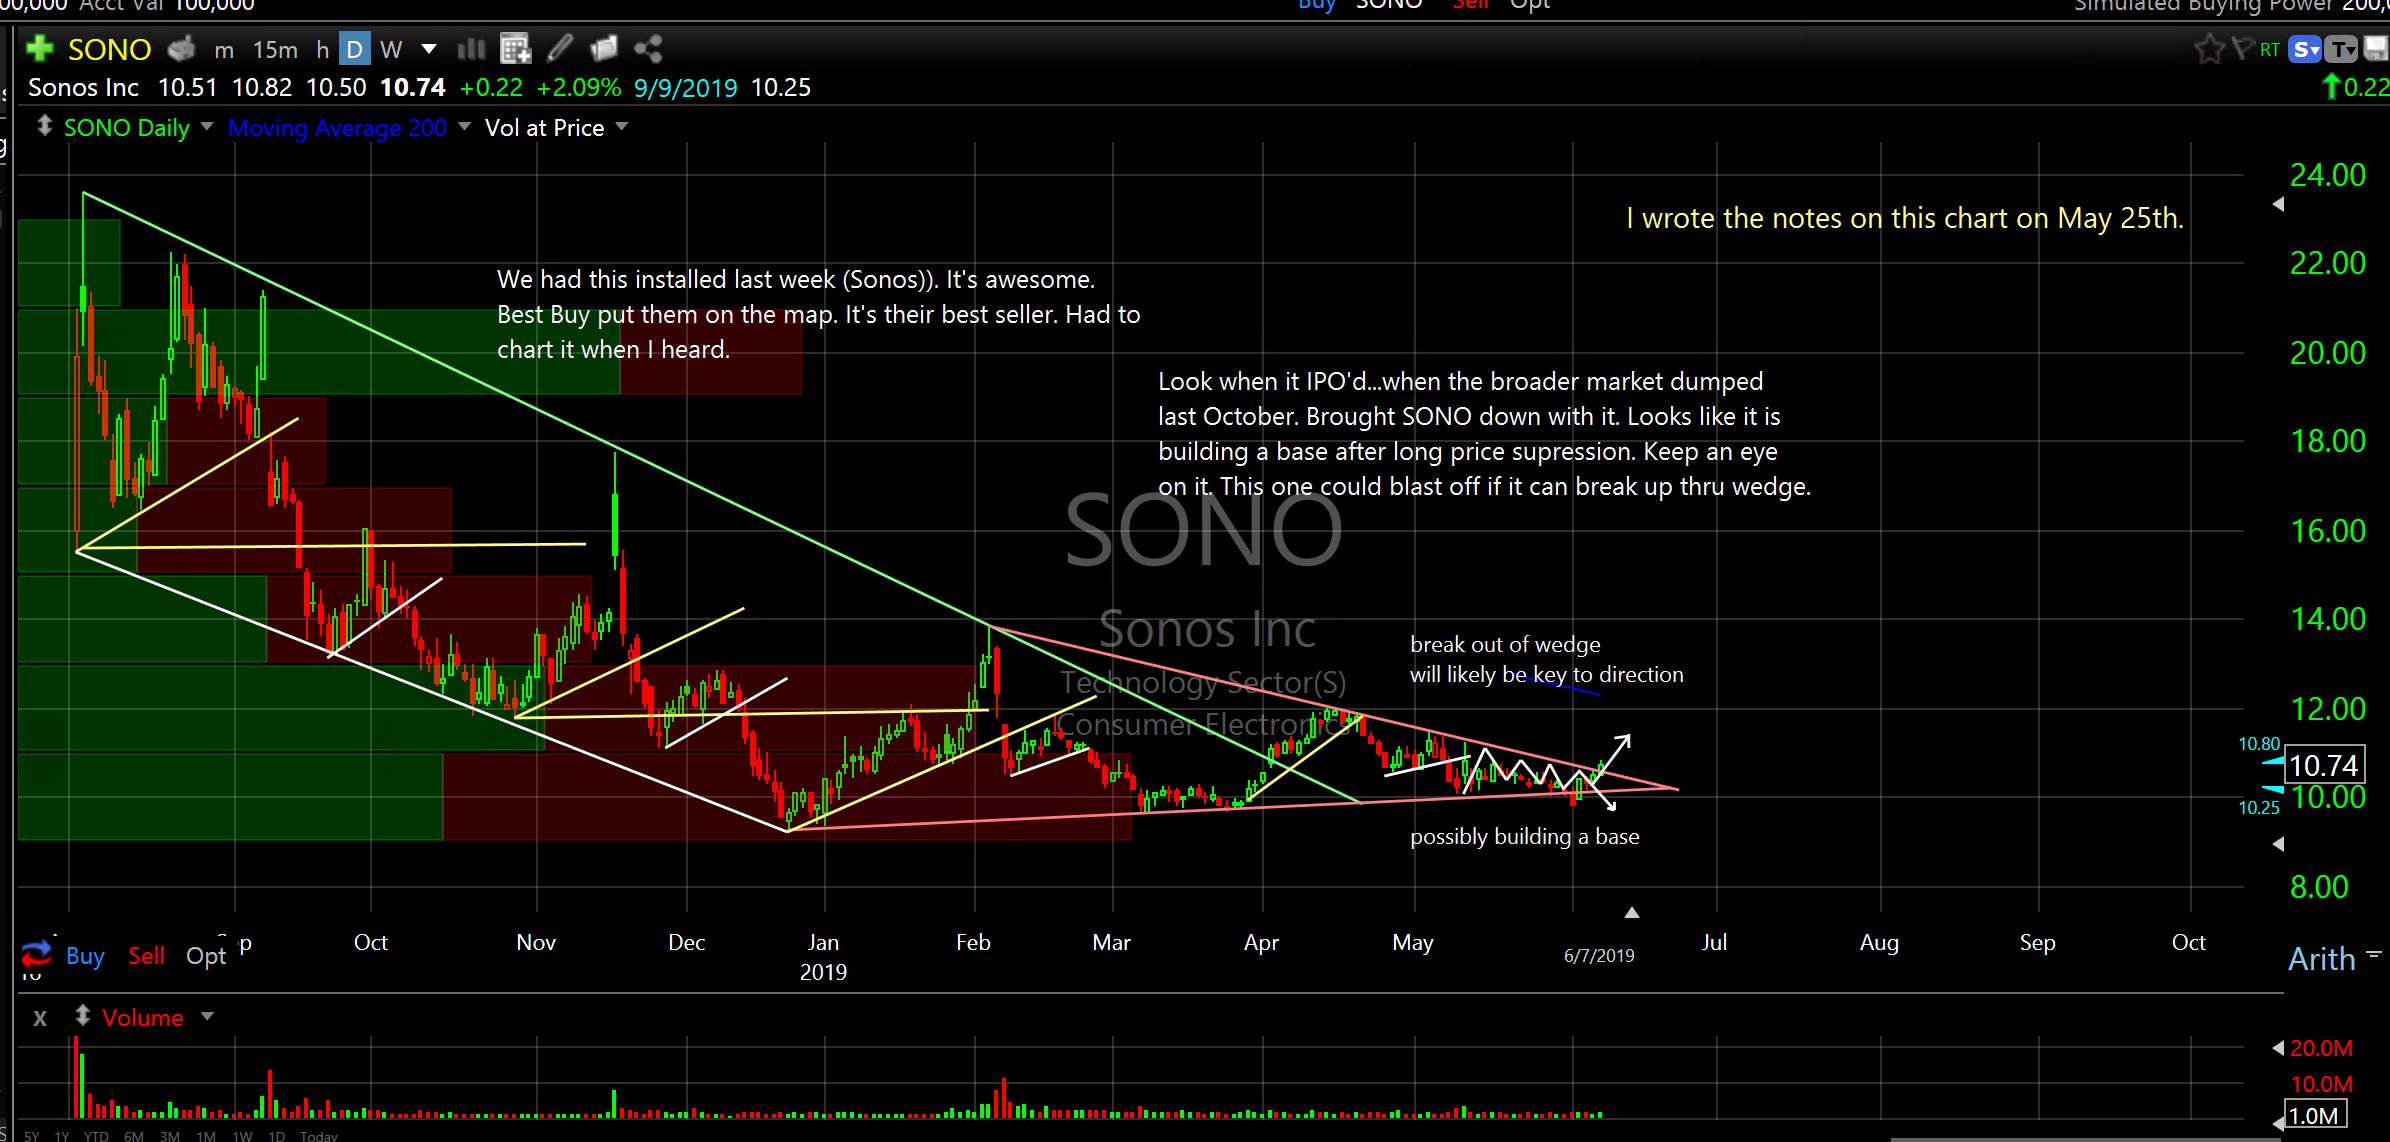
Sonos (SONO) daily
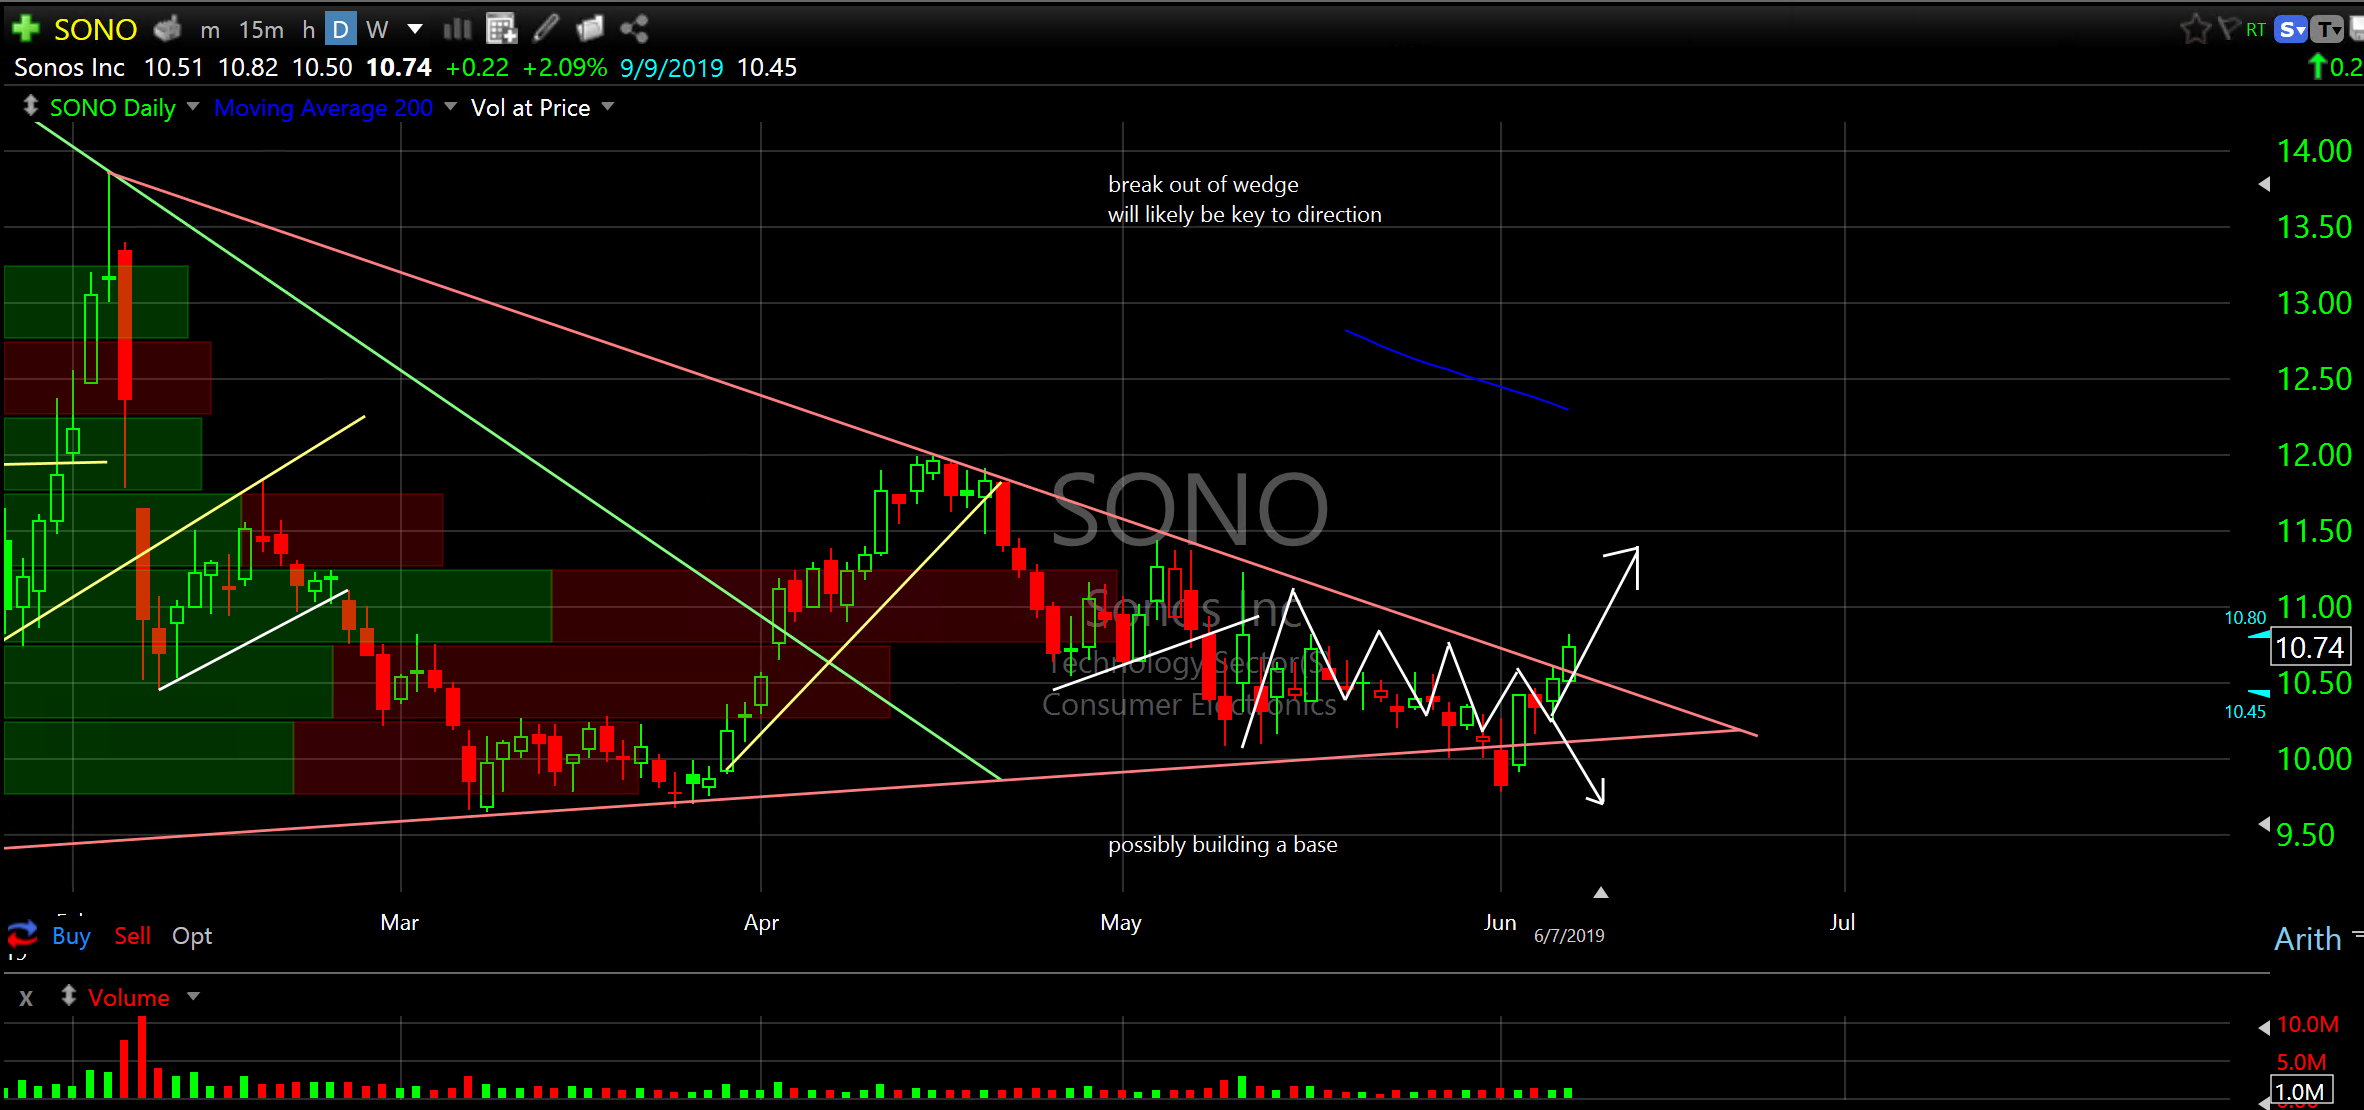
Sonos (SONO) broke out of it’s wedge. Turn up the volume baby. I’m a buyer on Monday. Two charts above.
Uber Technologies (UBER) 60 minute
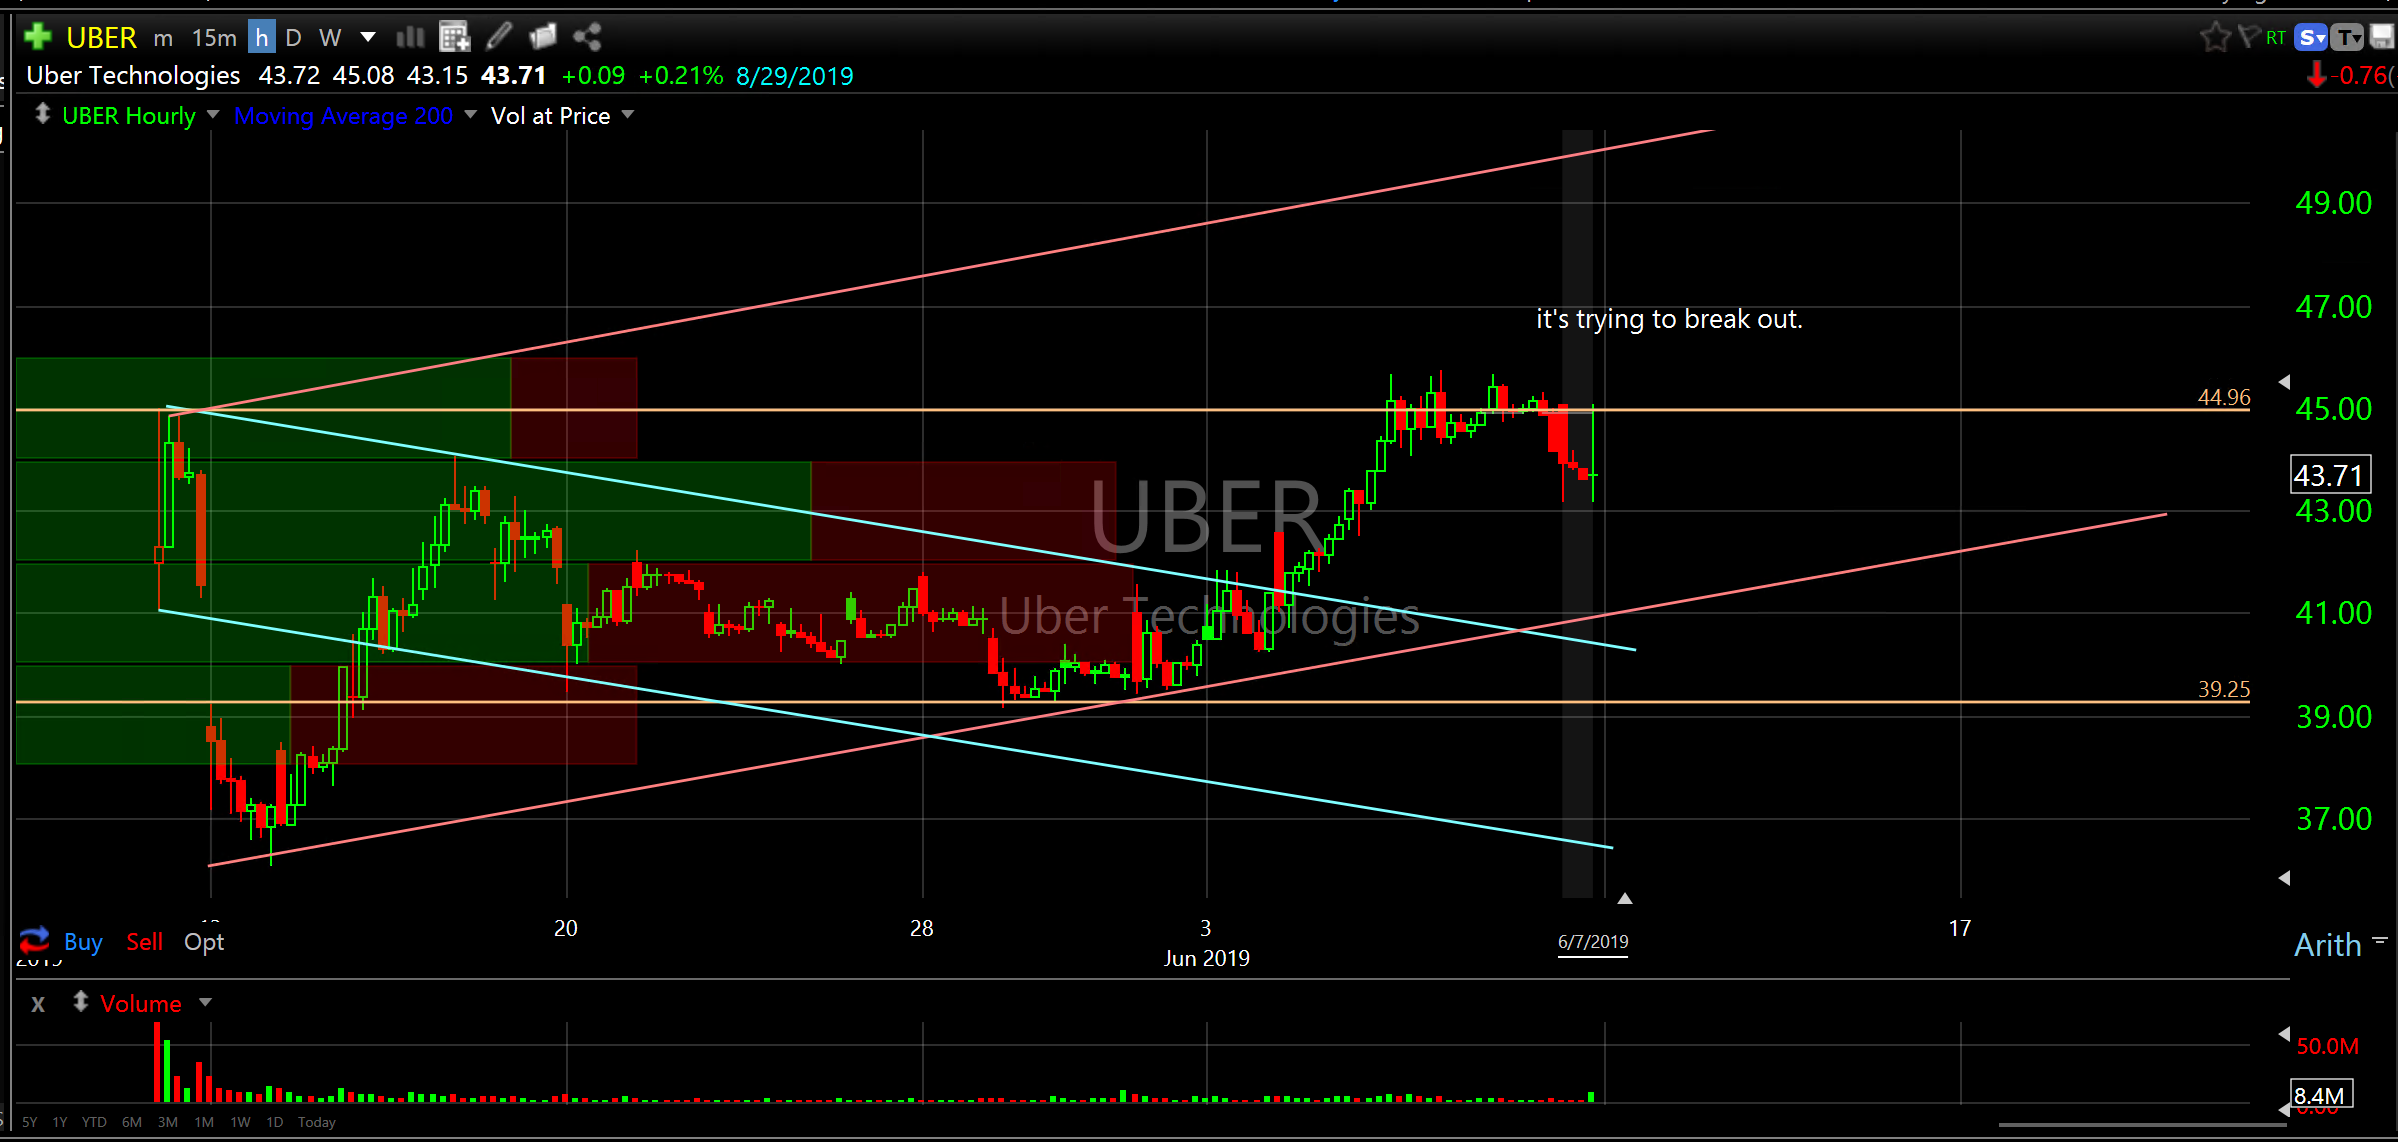
I’ve got my eye on Uber Technologies (UBER). It just went public last month and popped this week but ran right into a little resistance. It might trade back down into the ascending red line which would be a better entry if it gets bid up there, however, I might start a small position if it breaks above. Not much history so potential volatility and risk is higher. I will send out a note if/when I buy.
Kellogg Co (K) weekly
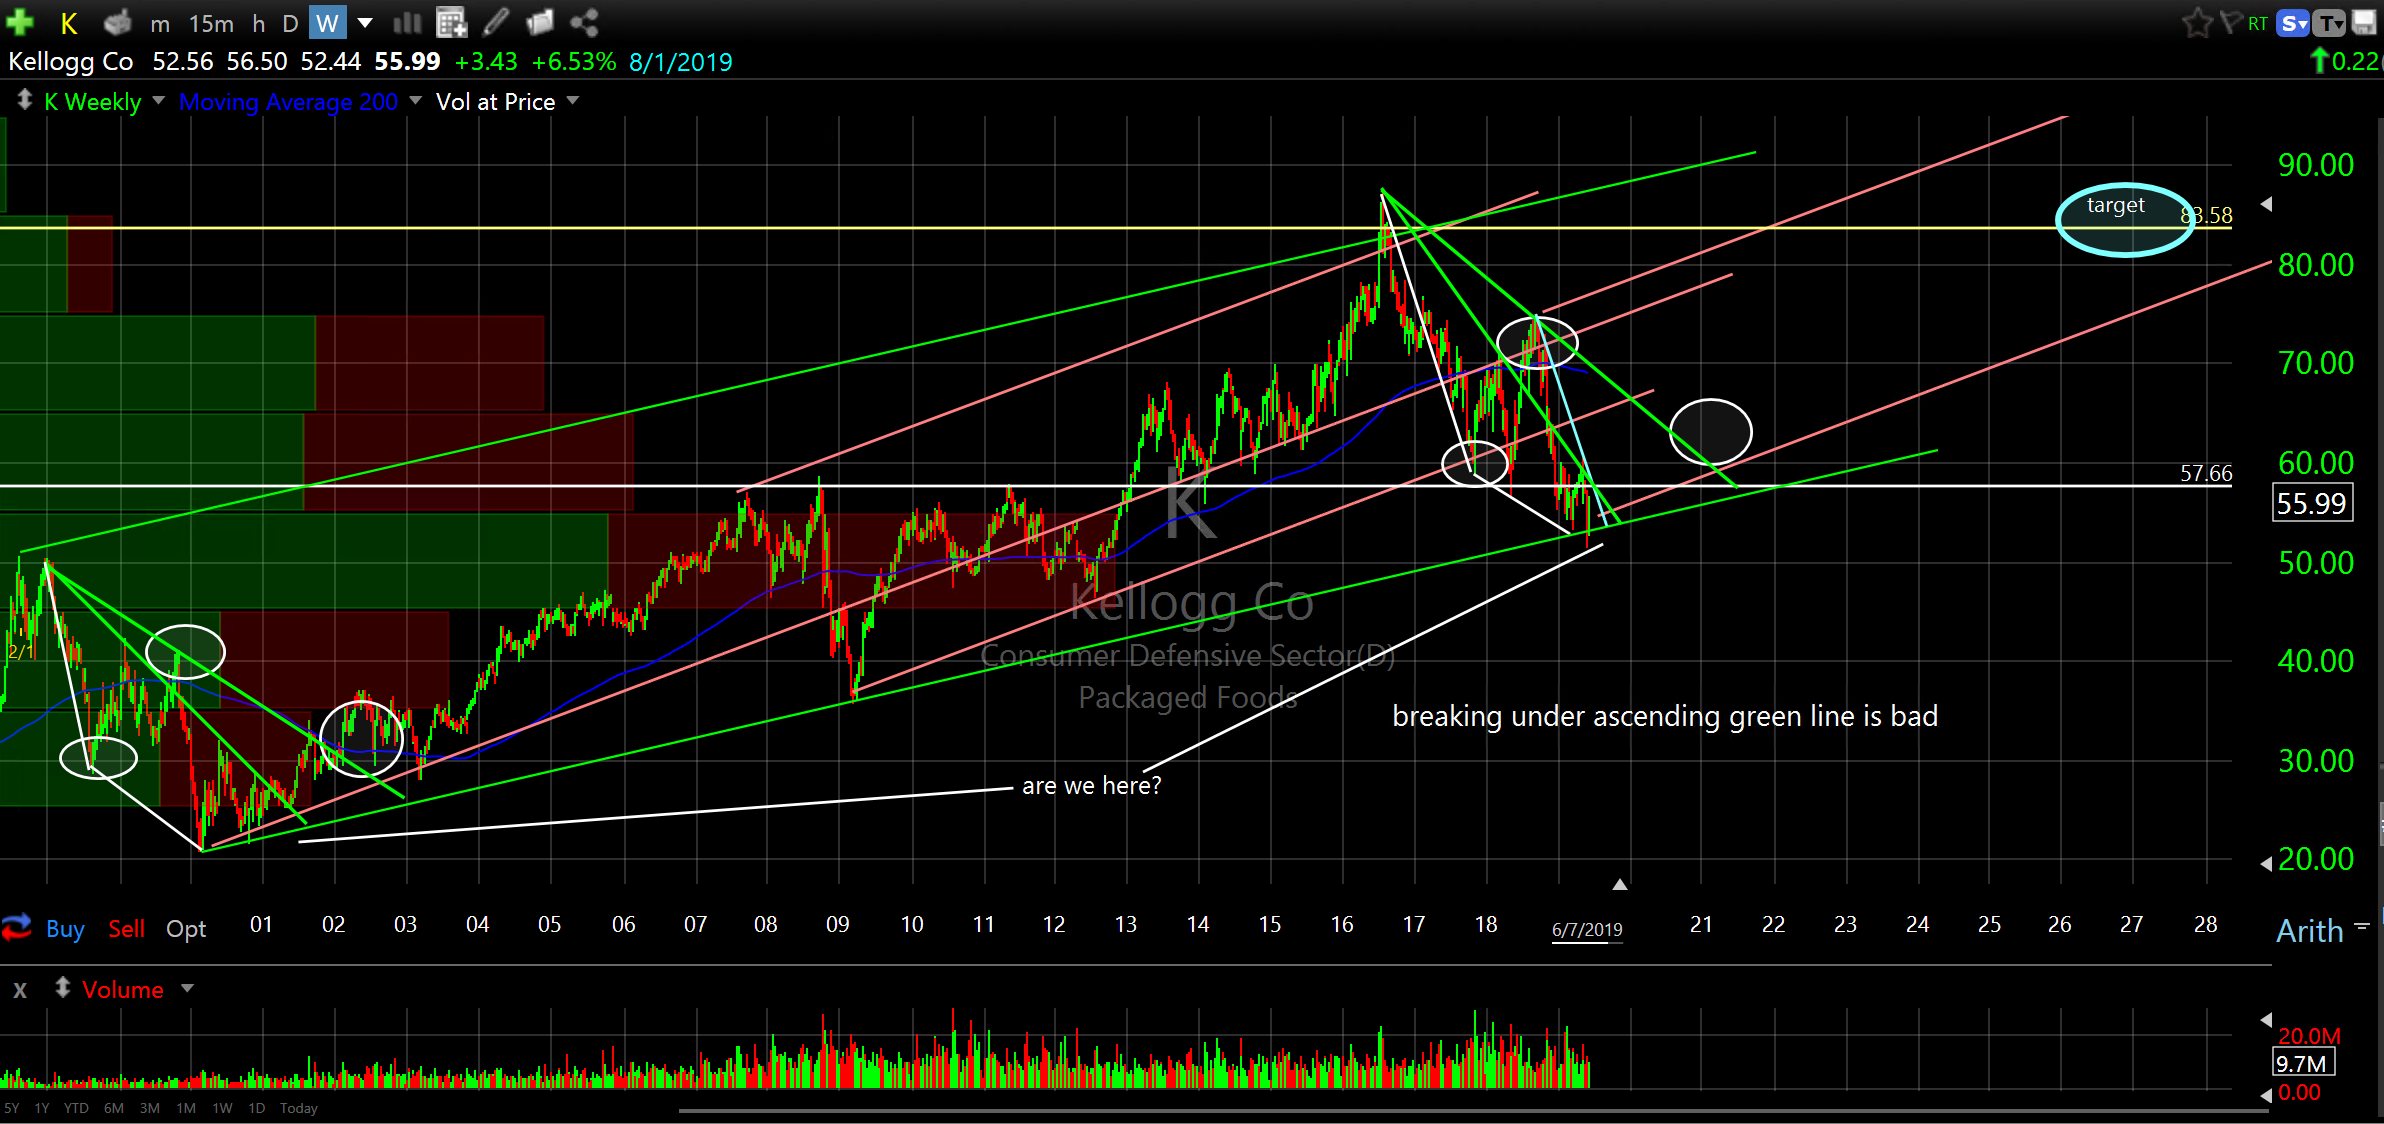
Check out Kellogg Co (K). I do like Cheez-Its. Keeping an eye on this to break up through resistance.
Twitter, Inc (TWTR) daily
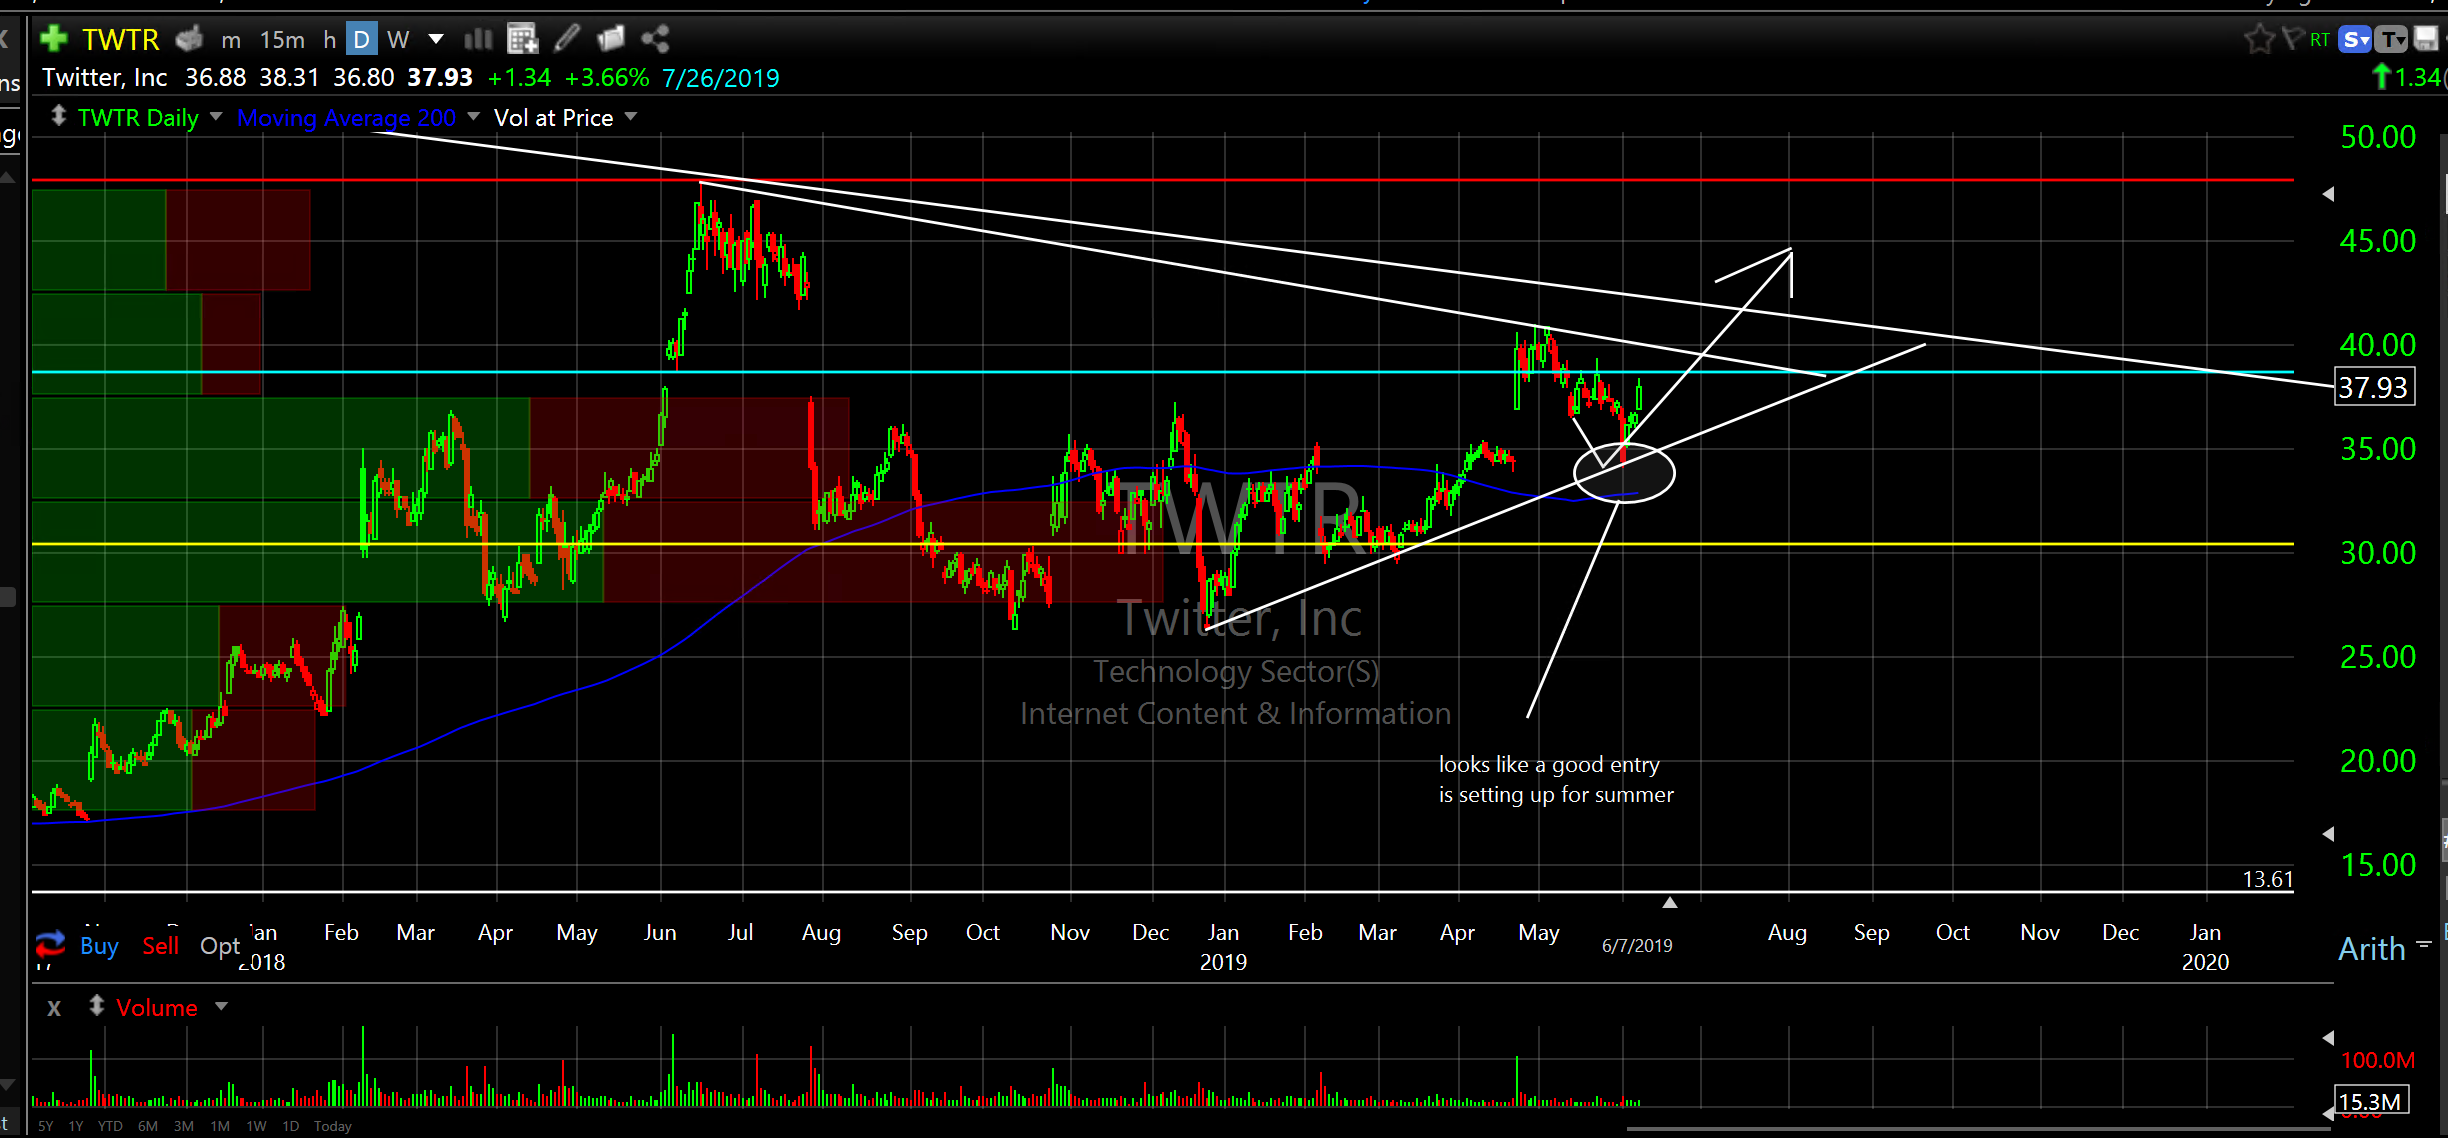
I have been watching Twitter, Inc (TWTR) for a long time. I wrote the notes on the chart about a month ago. Maybe it’s time to establish a small position. It sure looks like it wants to bust up through resistance. It would be more conservative to wait for a break out but considering the looks of this chart I will start a position on Monday.
Make sure you understand what you are buying. Do some due diligence. I am not your financial advisor. At the least go to finviz.com and plug in the symbol and read the info. I am not a fundamental analyst. I am a technical analyst. I’ve got nothing against those guys by the way. Anything that helps. Anything that works. You should know how I feel about this subject.
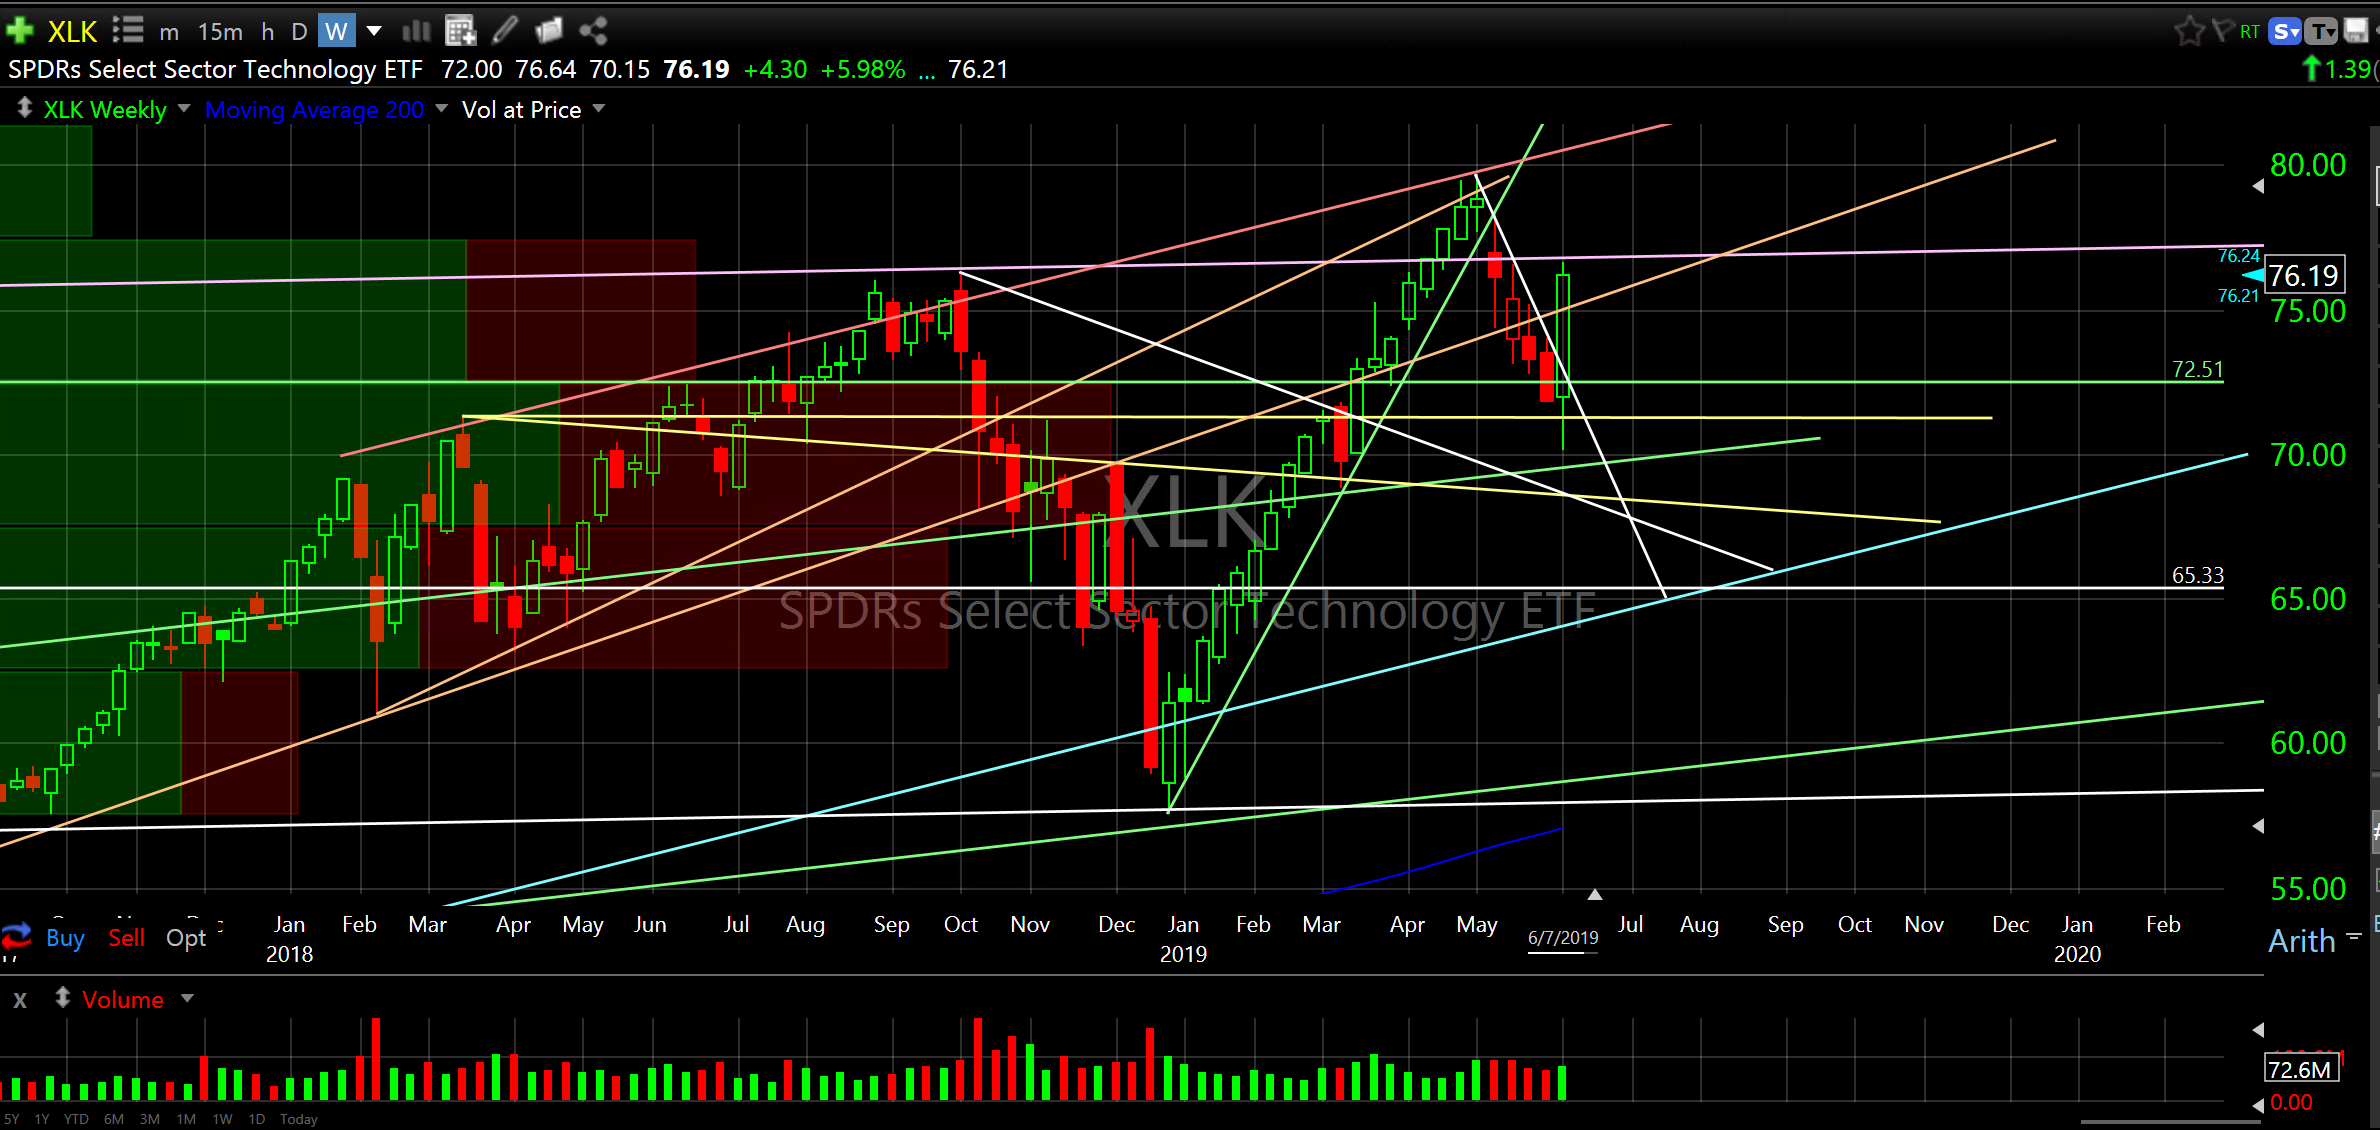
Technology (XLK) weekly
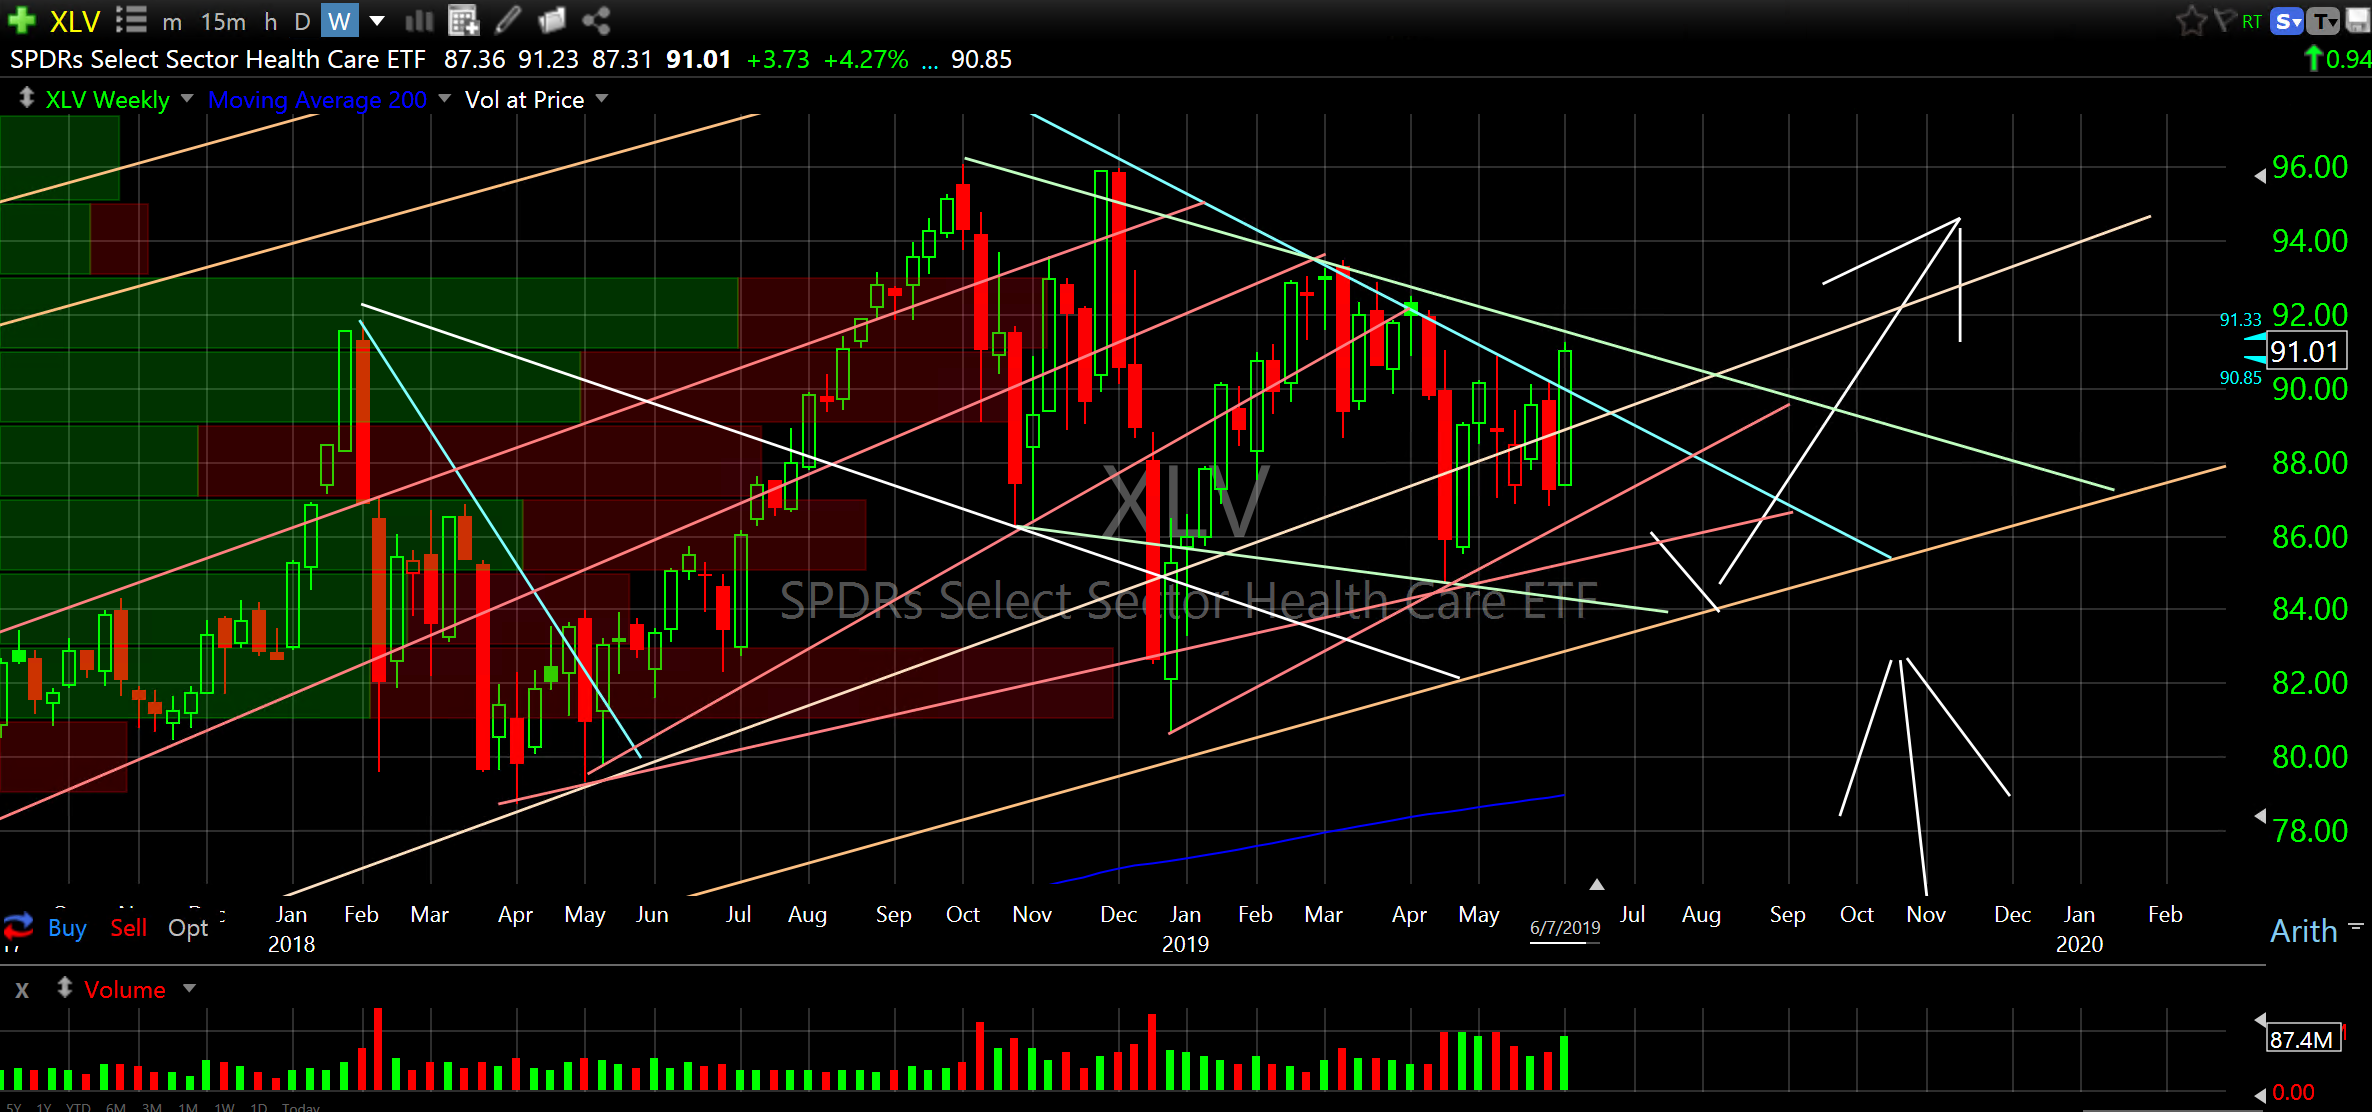
Health Care (XLV) weekly
Basic Materials (XLB) weekly
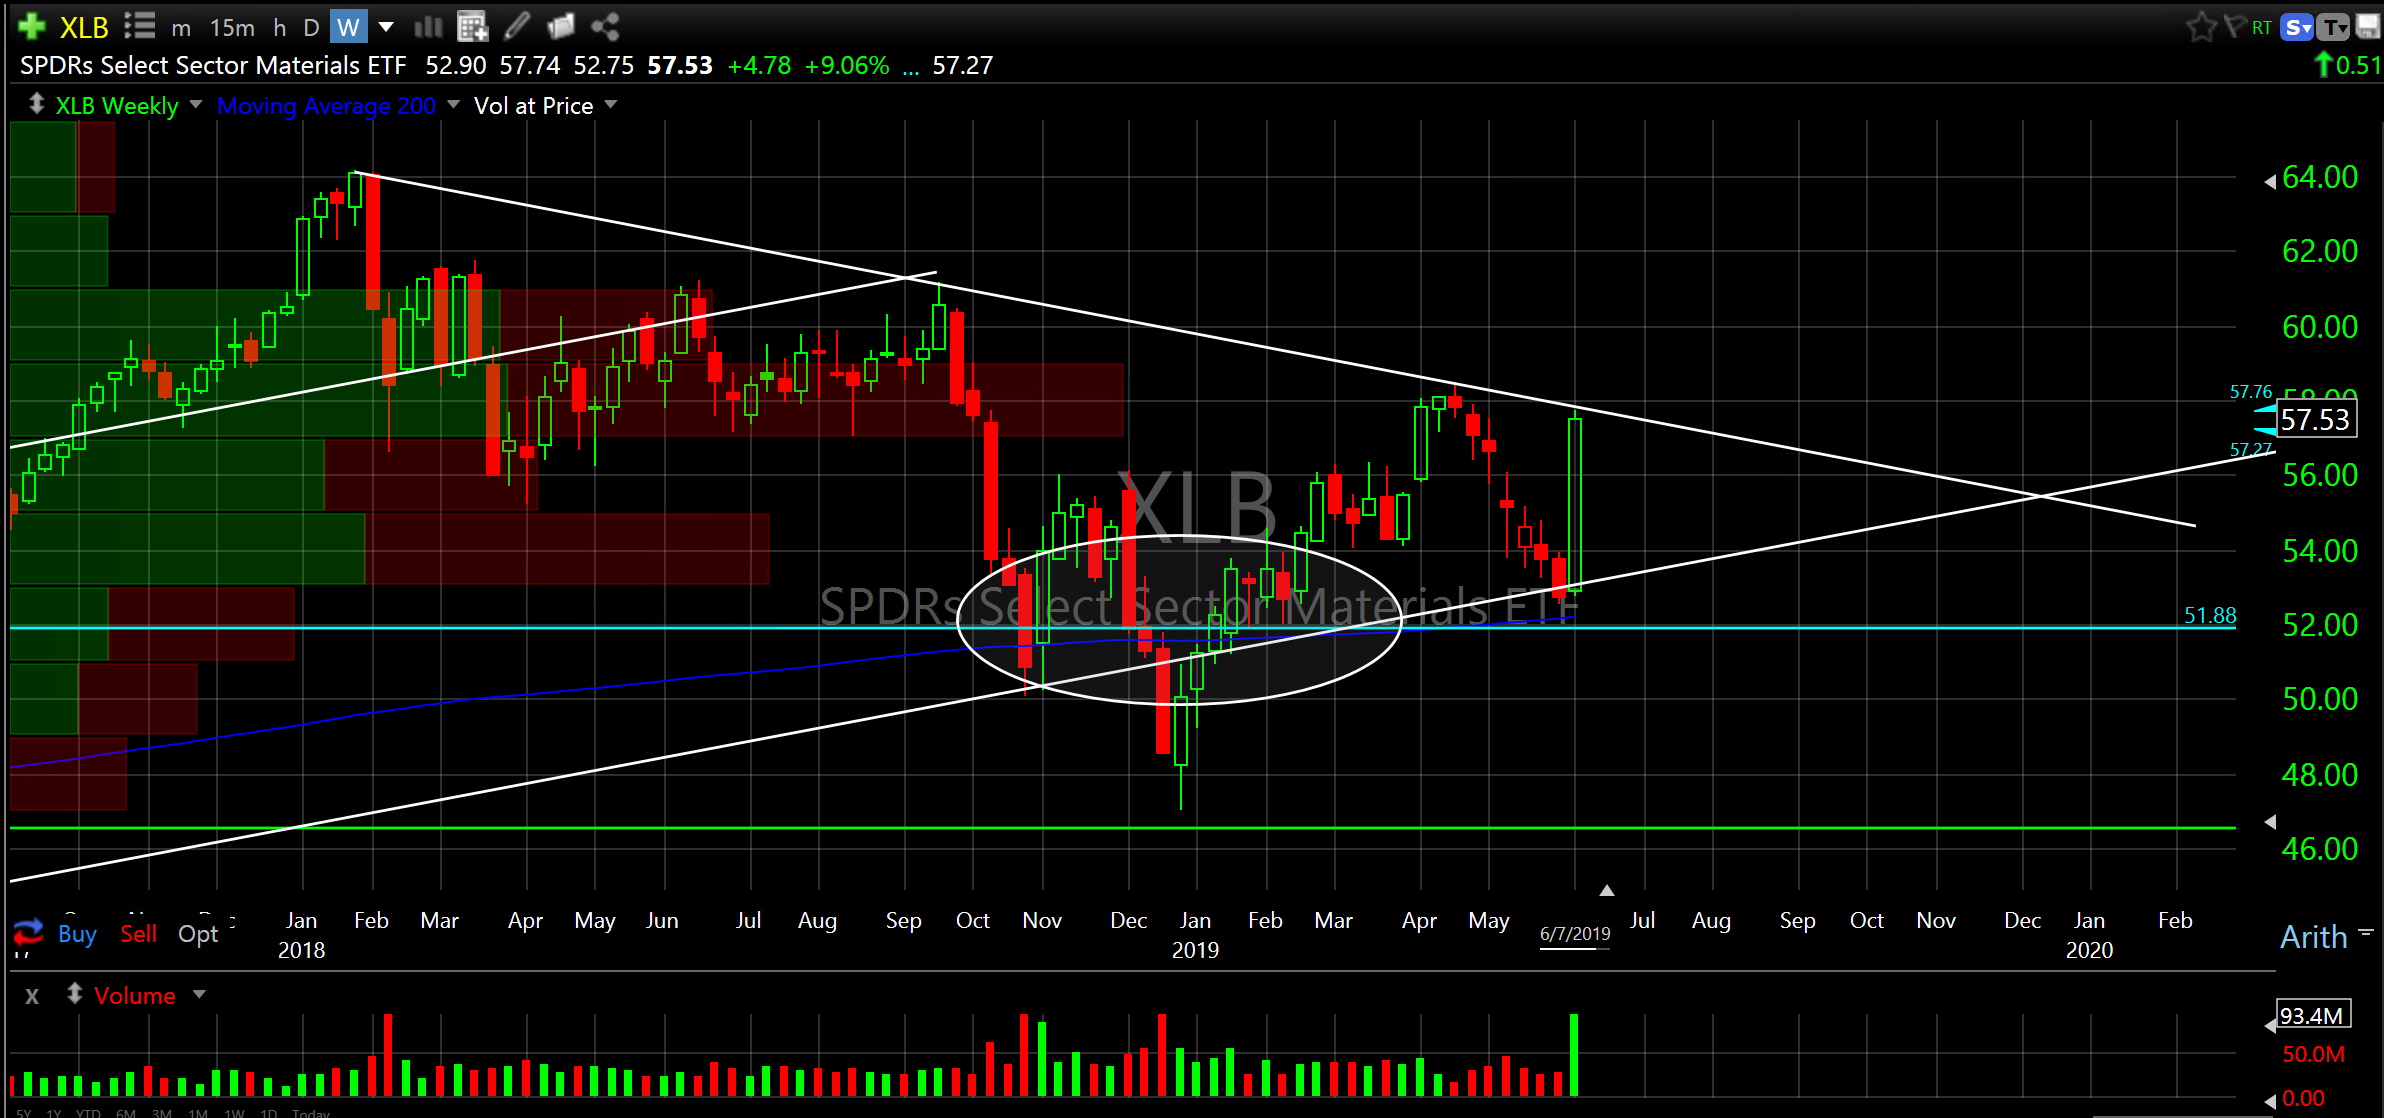
You are almost done. Check out the following sector ETF’s. Technology (XLK), Health Care (XLV) and Basic Materials (XLB) have traded back up to and ended the week right at resistance, hmmm…pullback soon or another rip right up through those bastards.?
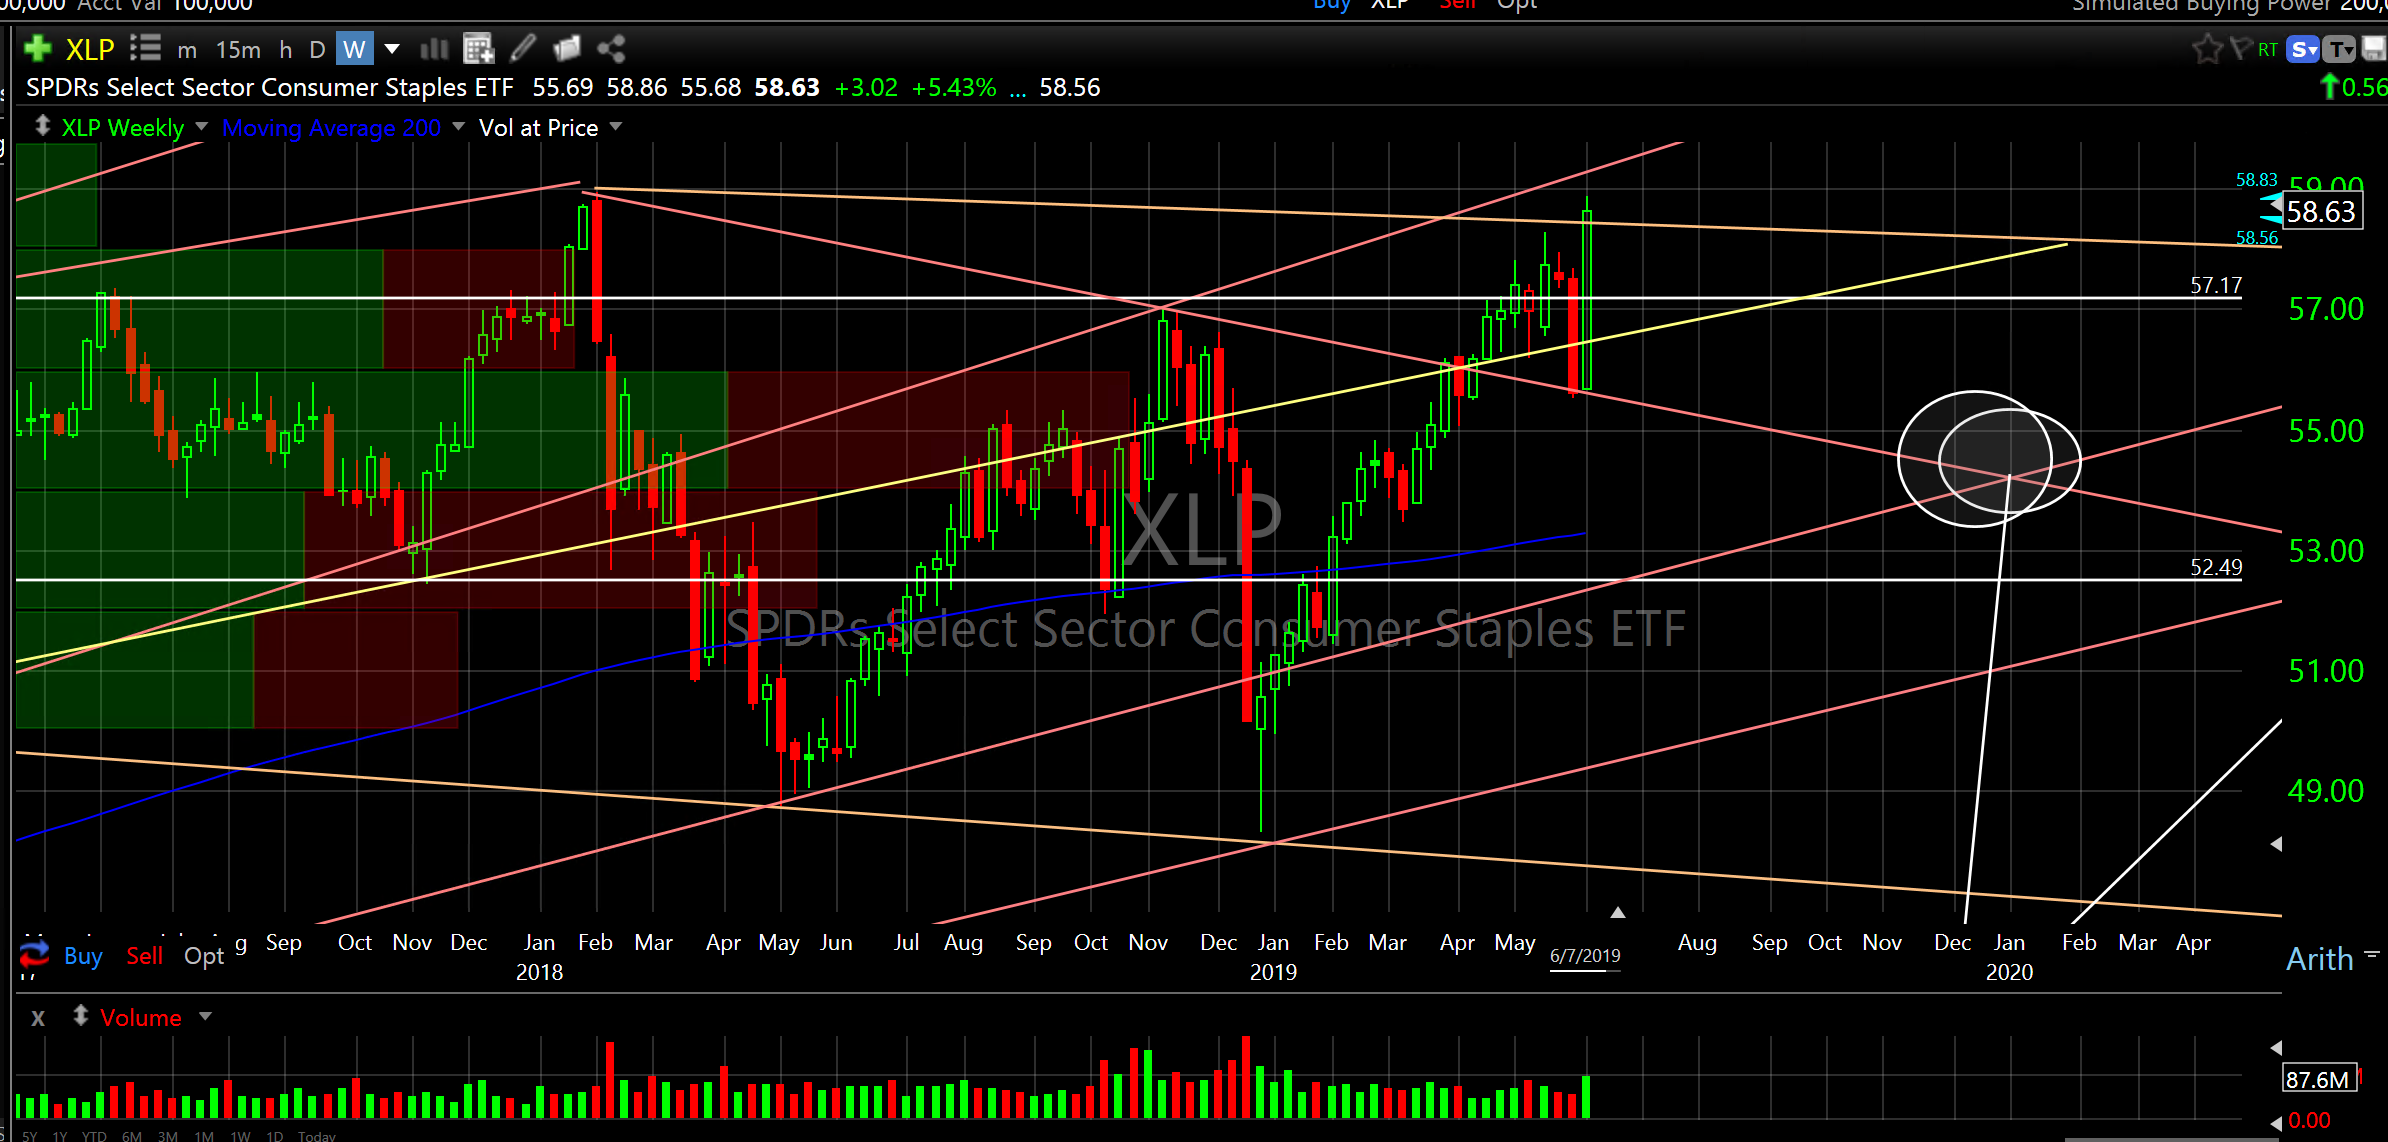
Consumer Staples (XLP) weekly
Utilities (XLU) weekly
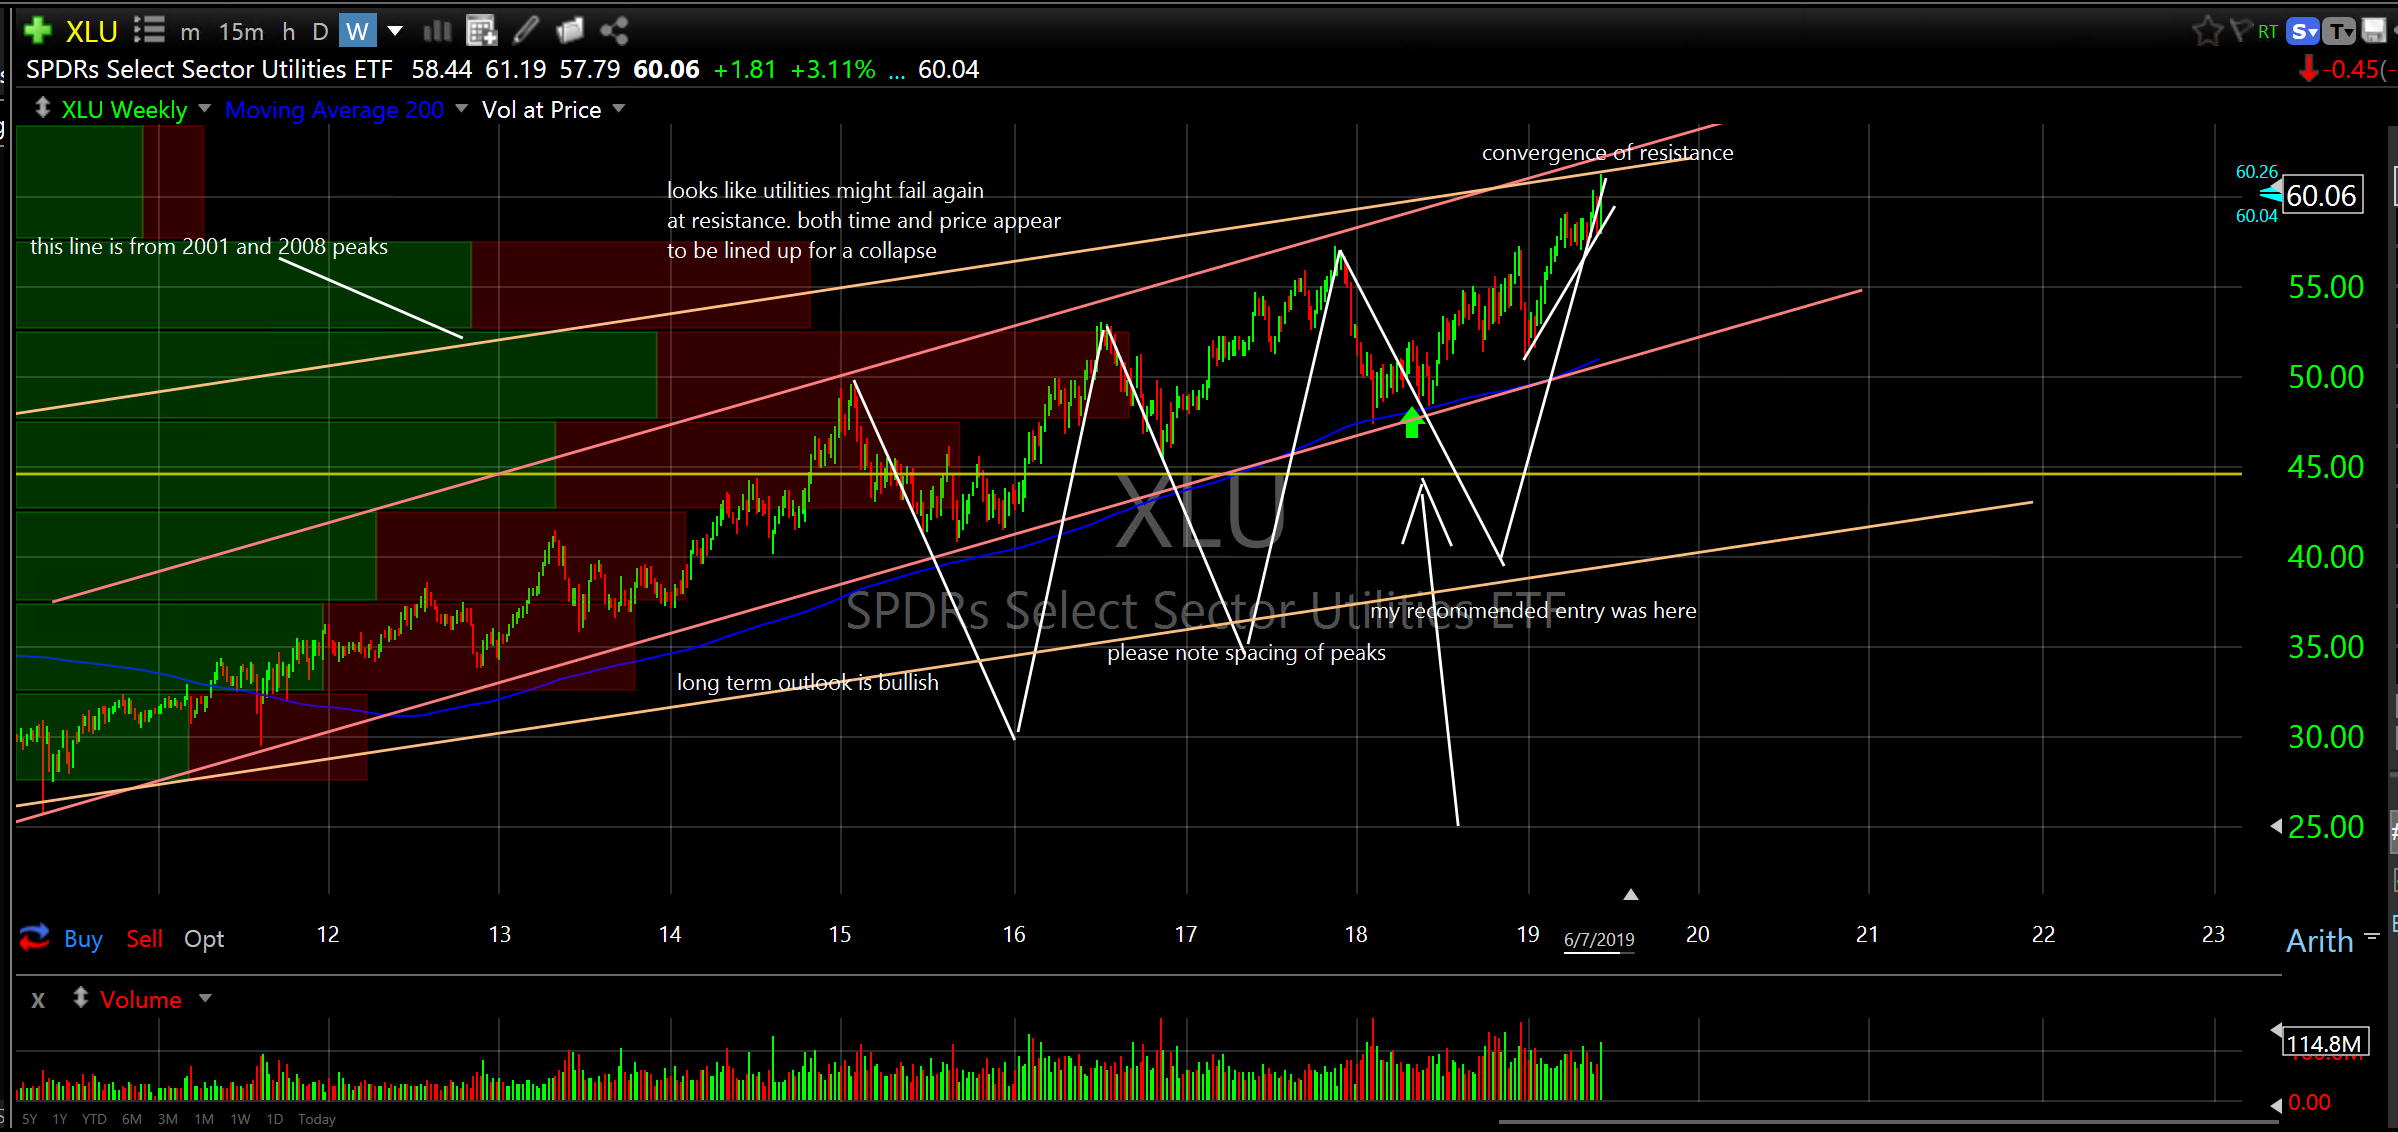
Consumer Staples (XLP) has made a new high. Utilities (XLU) are banging on the ceiling again…dip coming?
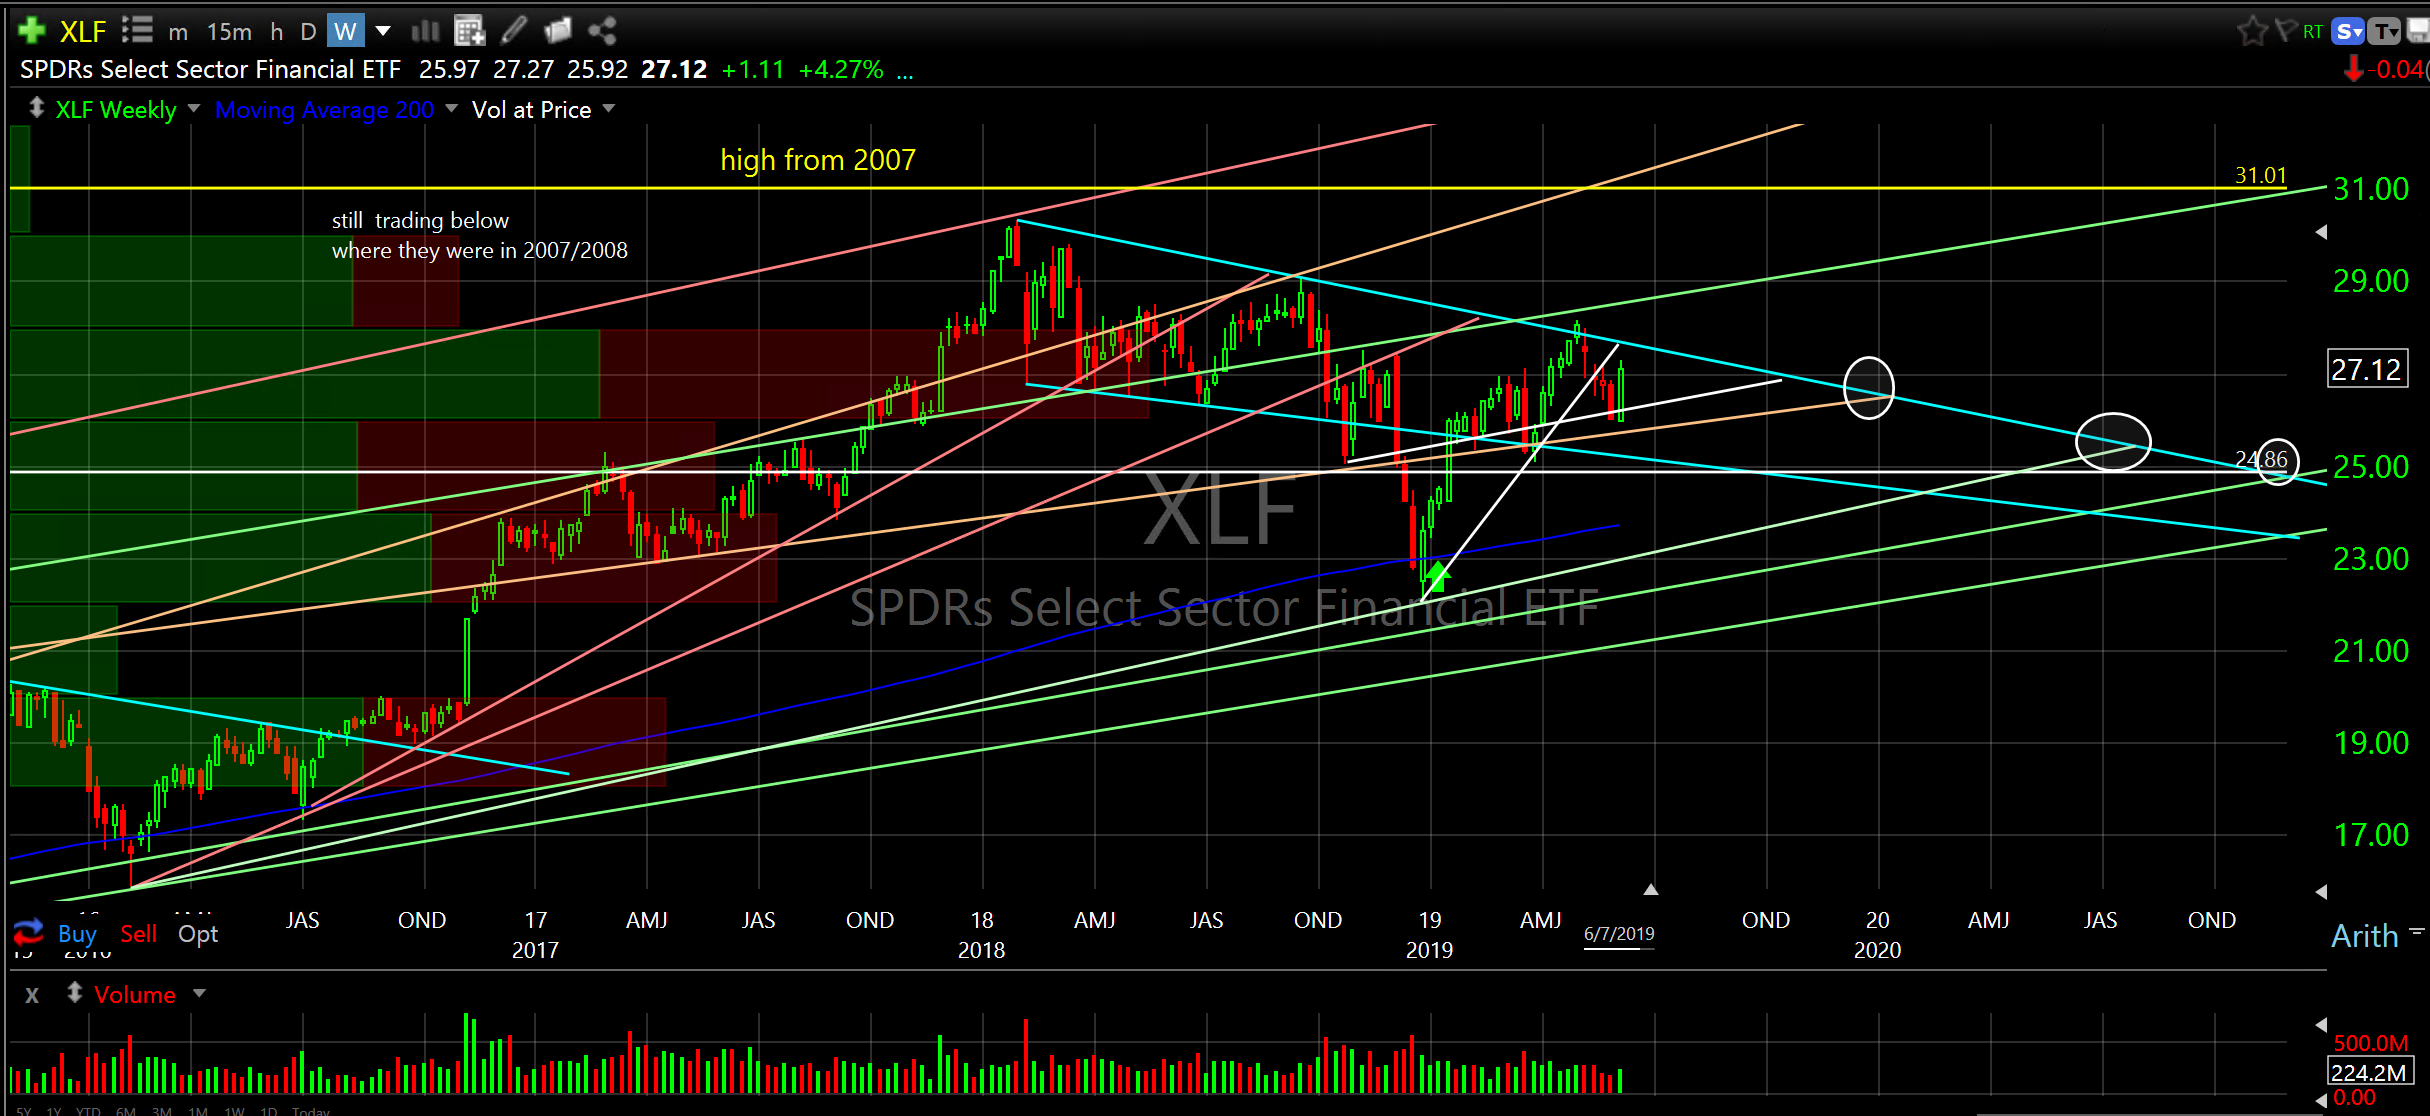
Financials (XLF) weekly
Real Estate (XLRE) daily
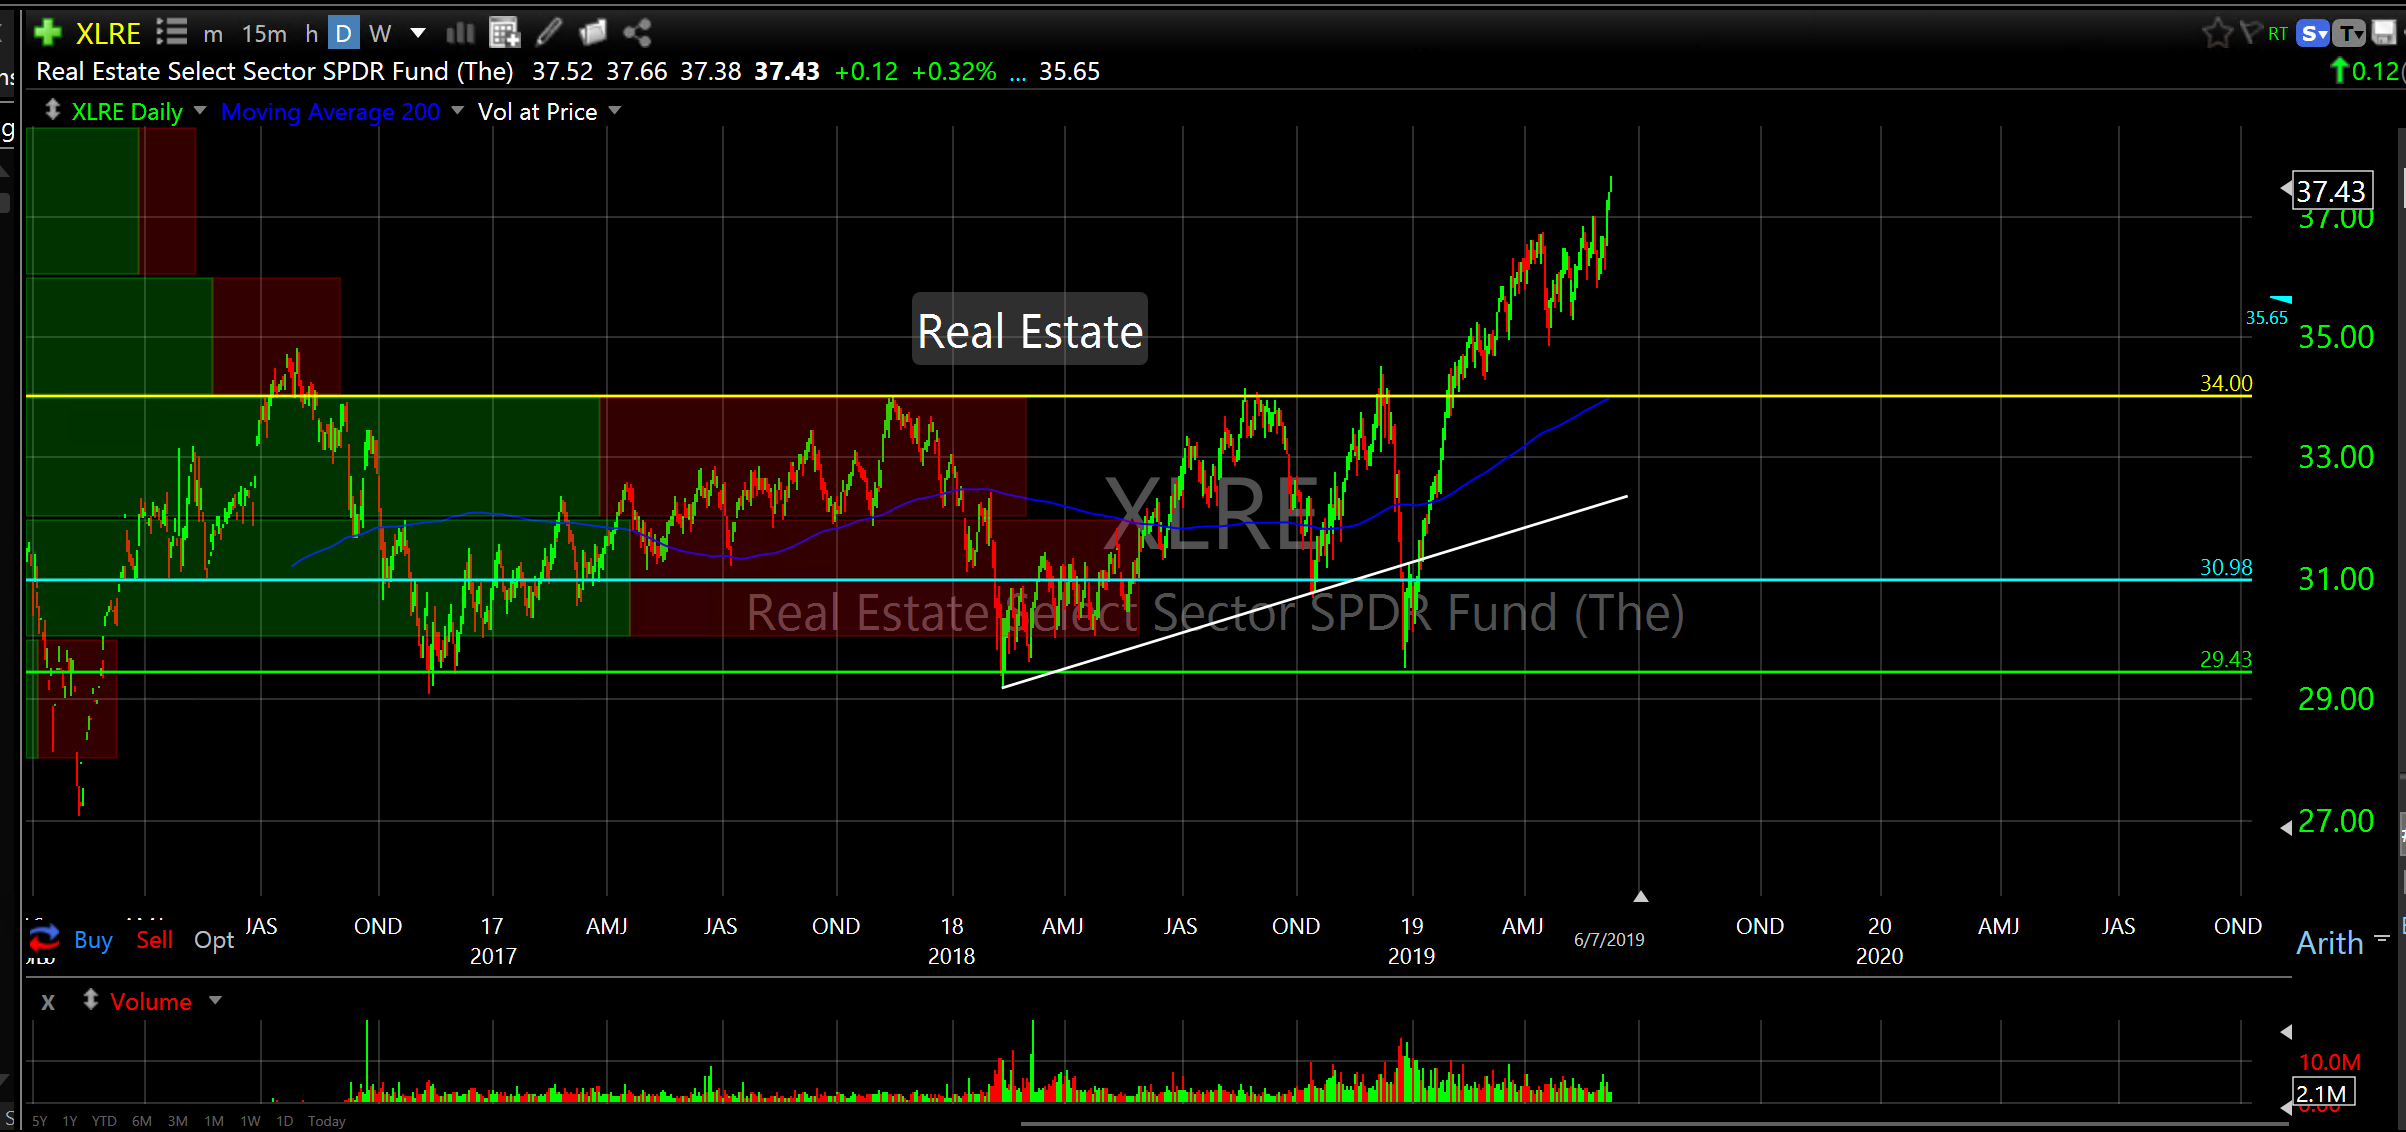
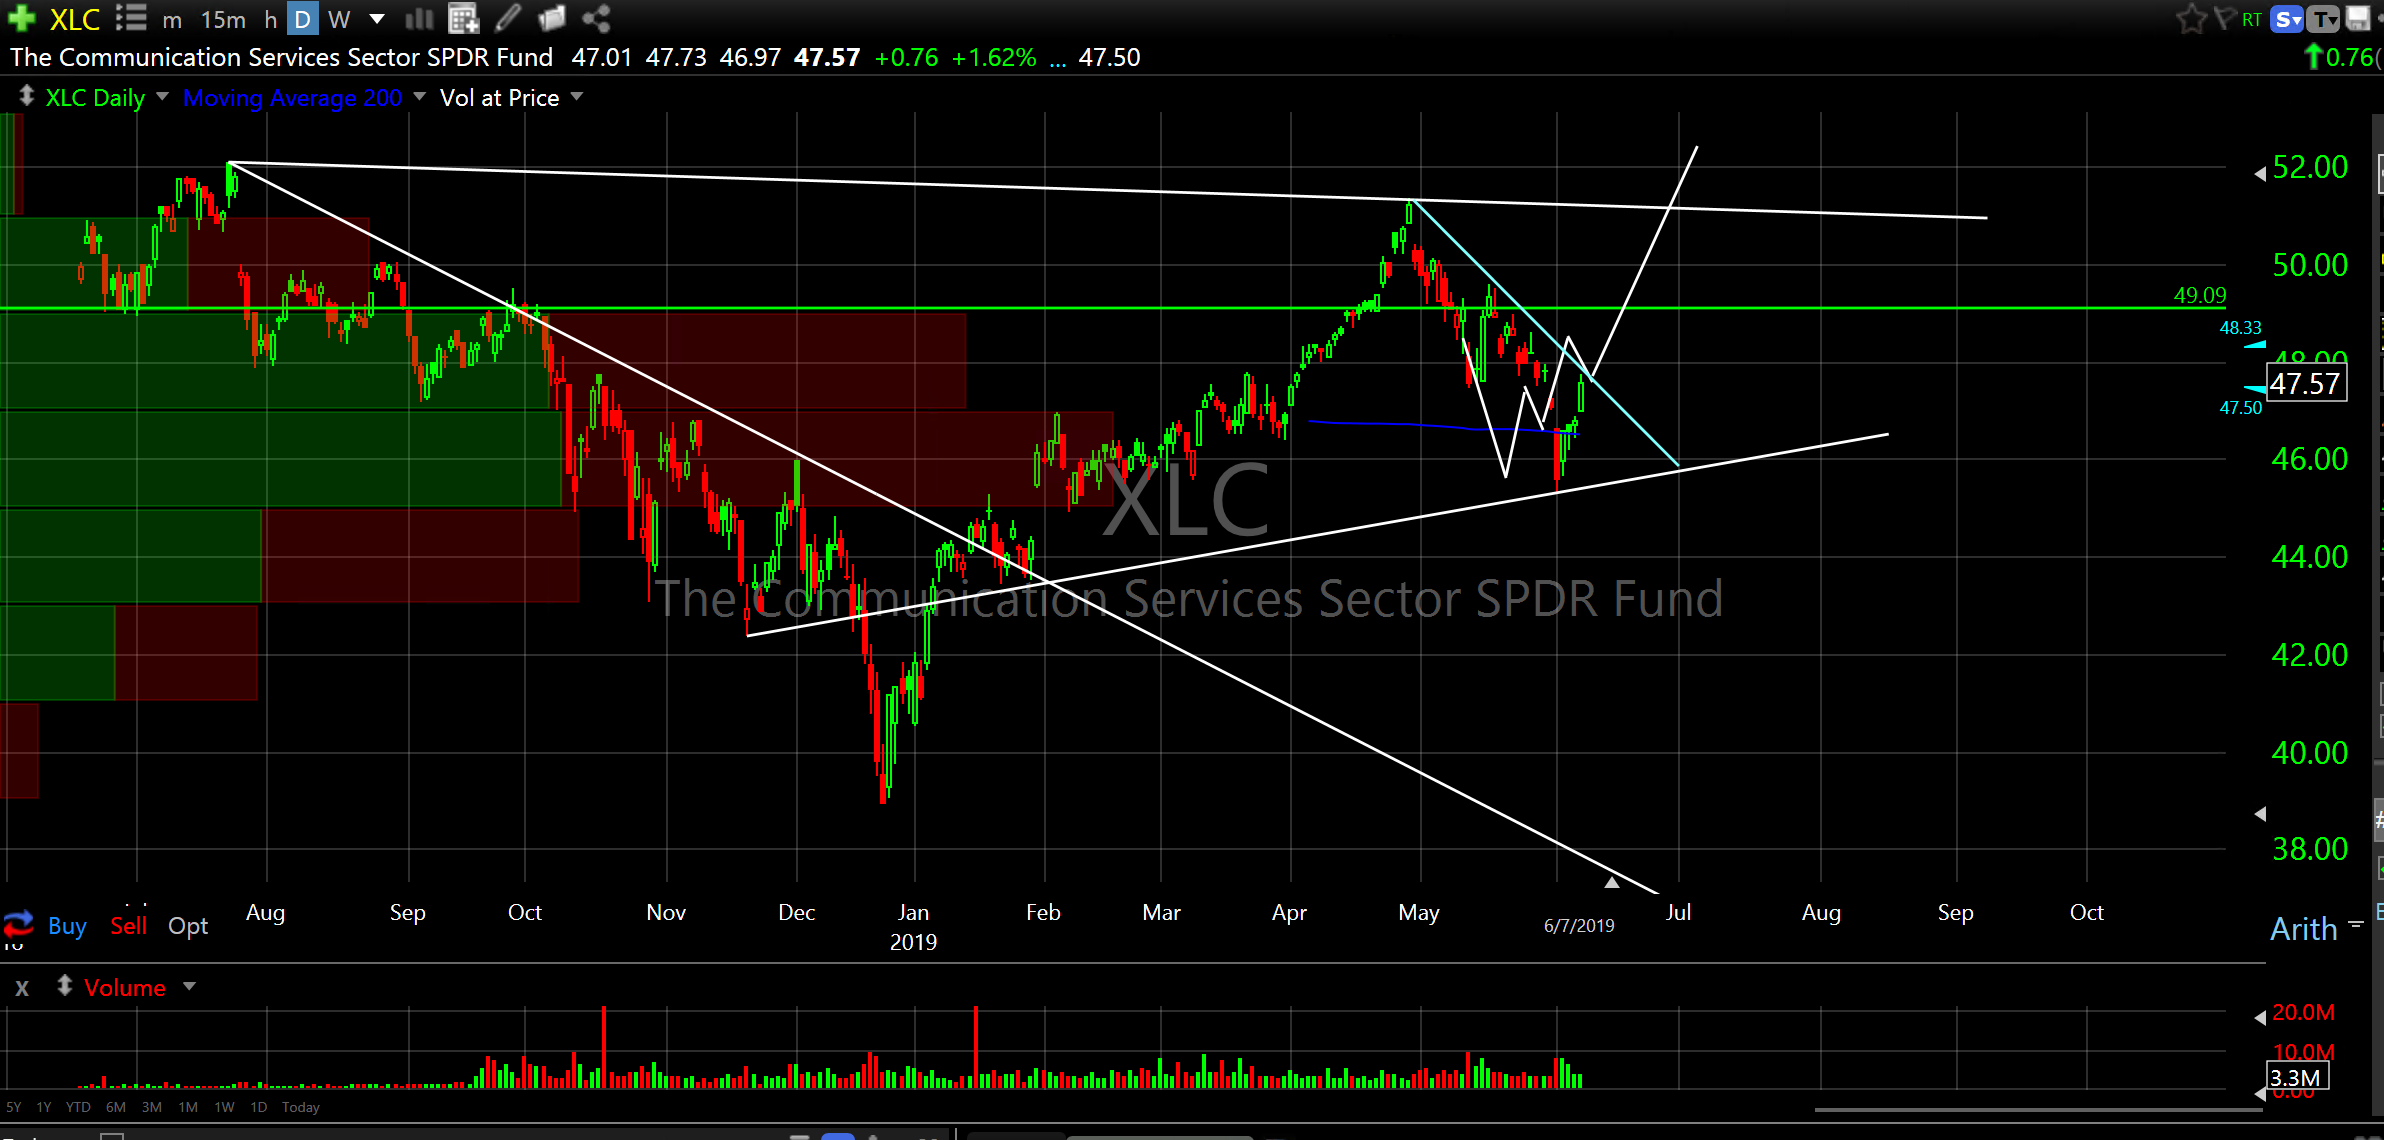
Financials (XLF) are almost back to resistance as well. Real Estate (XLRE) is on fire (I think I missed that one). And, the Communication Services sector ETF (XLC) has me paying attention…a little…Facebook Inc (FB) needs to clear resistance first as it represents 18% of this ETF. Check out the charts below. What do you think?
Communication Services sector ETF (XLC) daily
I would really like your opinions by the way. If you like a company maybe I would like the company. Just sayin no need to be shy.
If you are feeling underexposed you might want to consider owning the following 630 companies; the 500 companies in the S&P 500 Index, the 100 companies in the Nasdaq Invesco QQQ Trust and the 30 companies in the Dow. The symbols for these are SPY, QQQ and DIA respectively. This way you get exposure but without the risk of owning one company. Go to ETFdb.com and just plug in the symbol to get more info on ETF components, etc.
And finally, “Where’s the Beef?” Beyond Meat Inc (BYND) went public earlier this month. It’s up over 200%. Really? $8.33 billion market cap. Must be a hell of a Double Double..if you’re into that sort of thing. Just watching for now.
The Trade Desk Inc (TTD) weekly
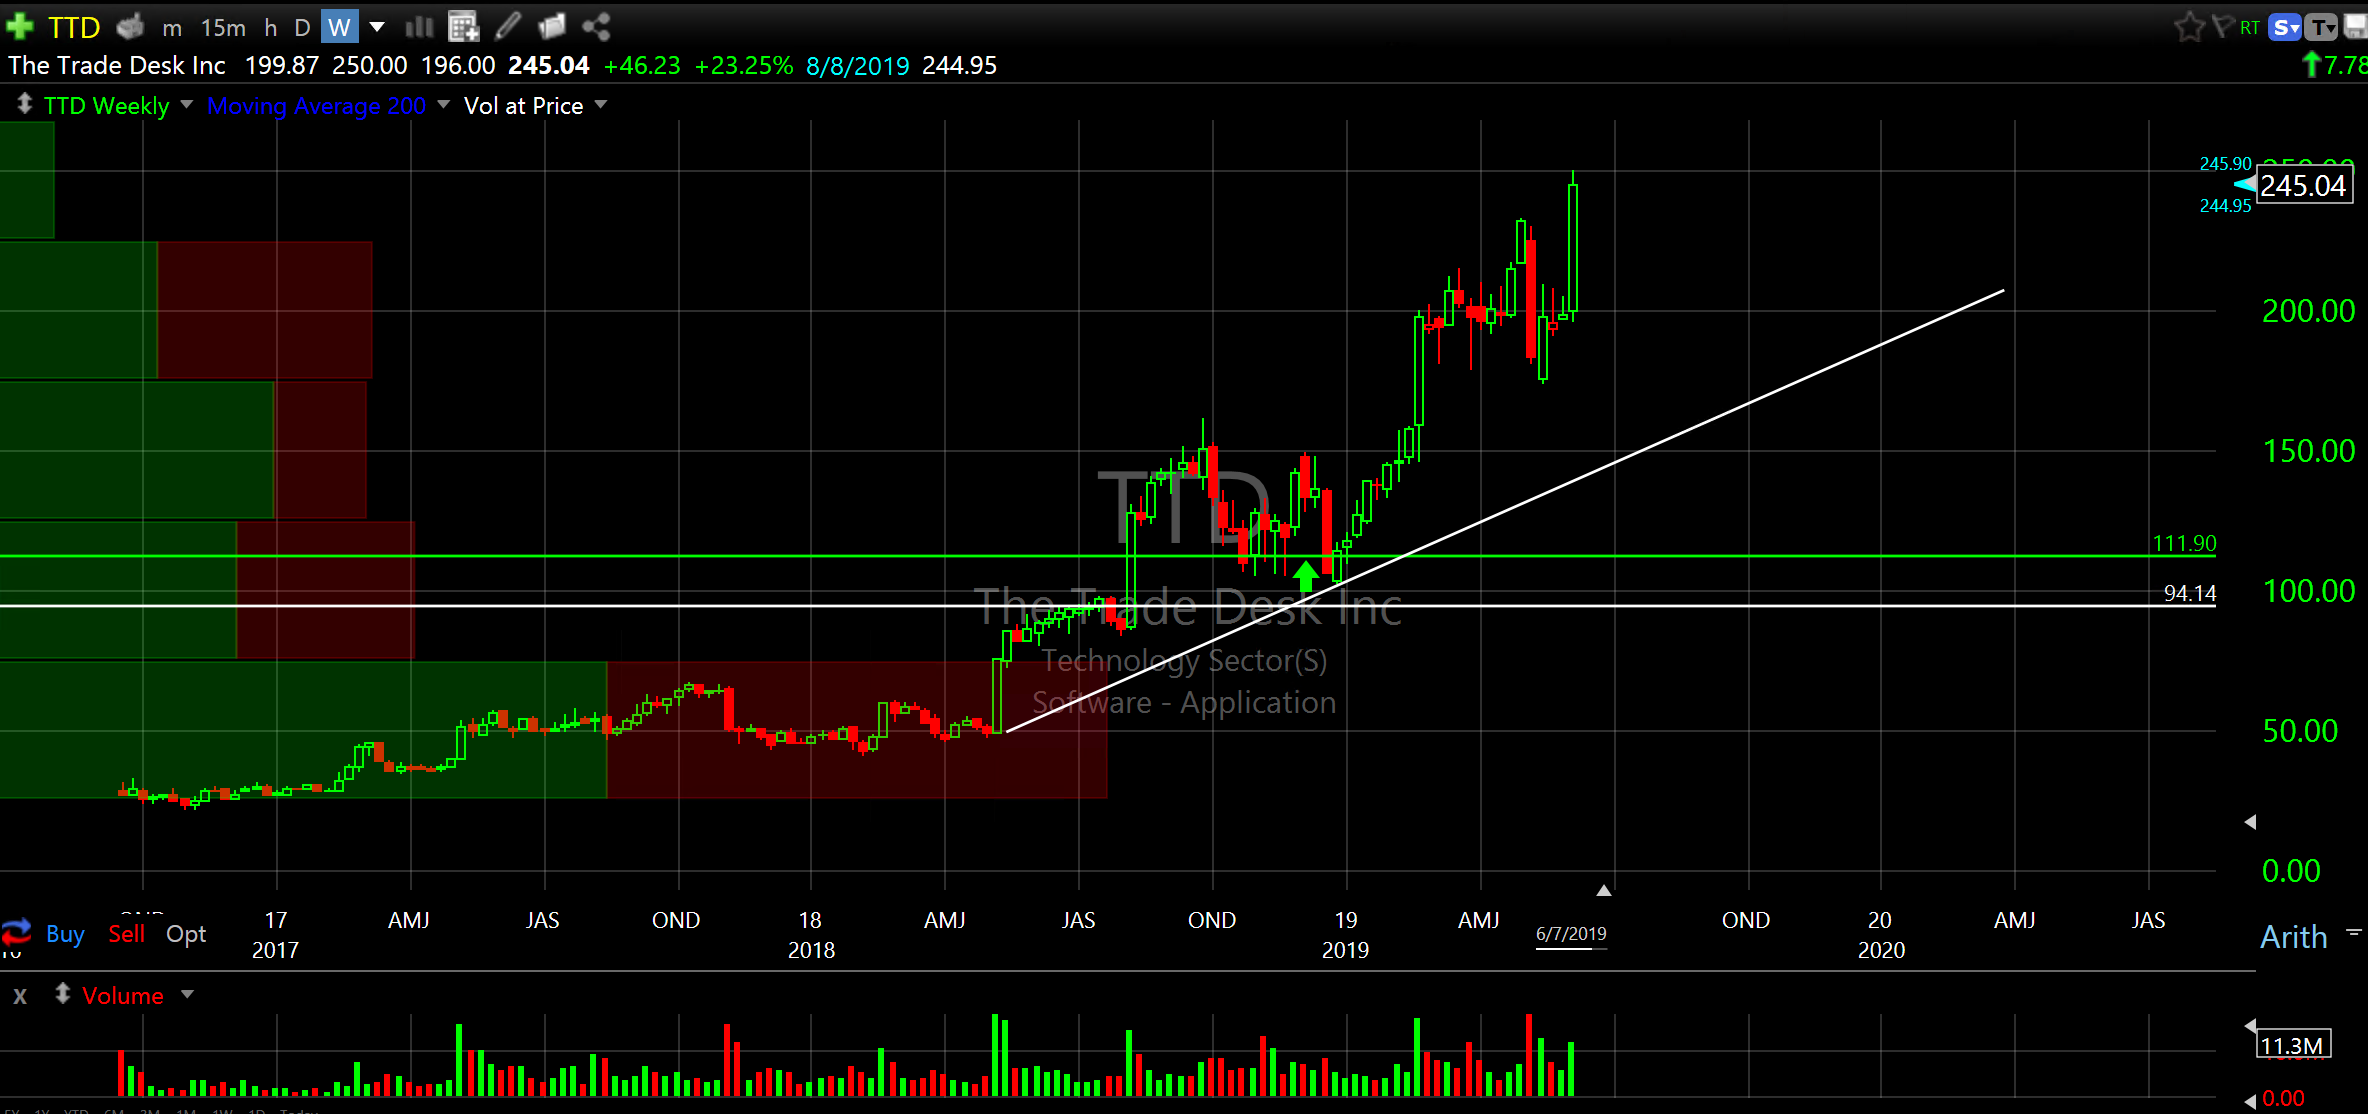
One more…I sure would like to buy The Trade Desk Inc (TTD) a little lower. It’s up over 150% this year. Yowza.
Actually, there are lots of companies I would like to buy. I’m just trying to do it slowly and not all at once. I’m trying to buy them at low risk prices at the same time the broader market signals expansion.
So, I’m not getting too aggressive as the broader market did not (yet) reverse from the lower support zone. It was a good reversal but I would feel better had we reversed from the lower level. But, we take what we get and try and make the best decisions. I will start nudging slowly. It ain’t all clear but it’s a lot better than it was.
That’s all folks,
Don