Finally, cooler weather…
Broader Market Review
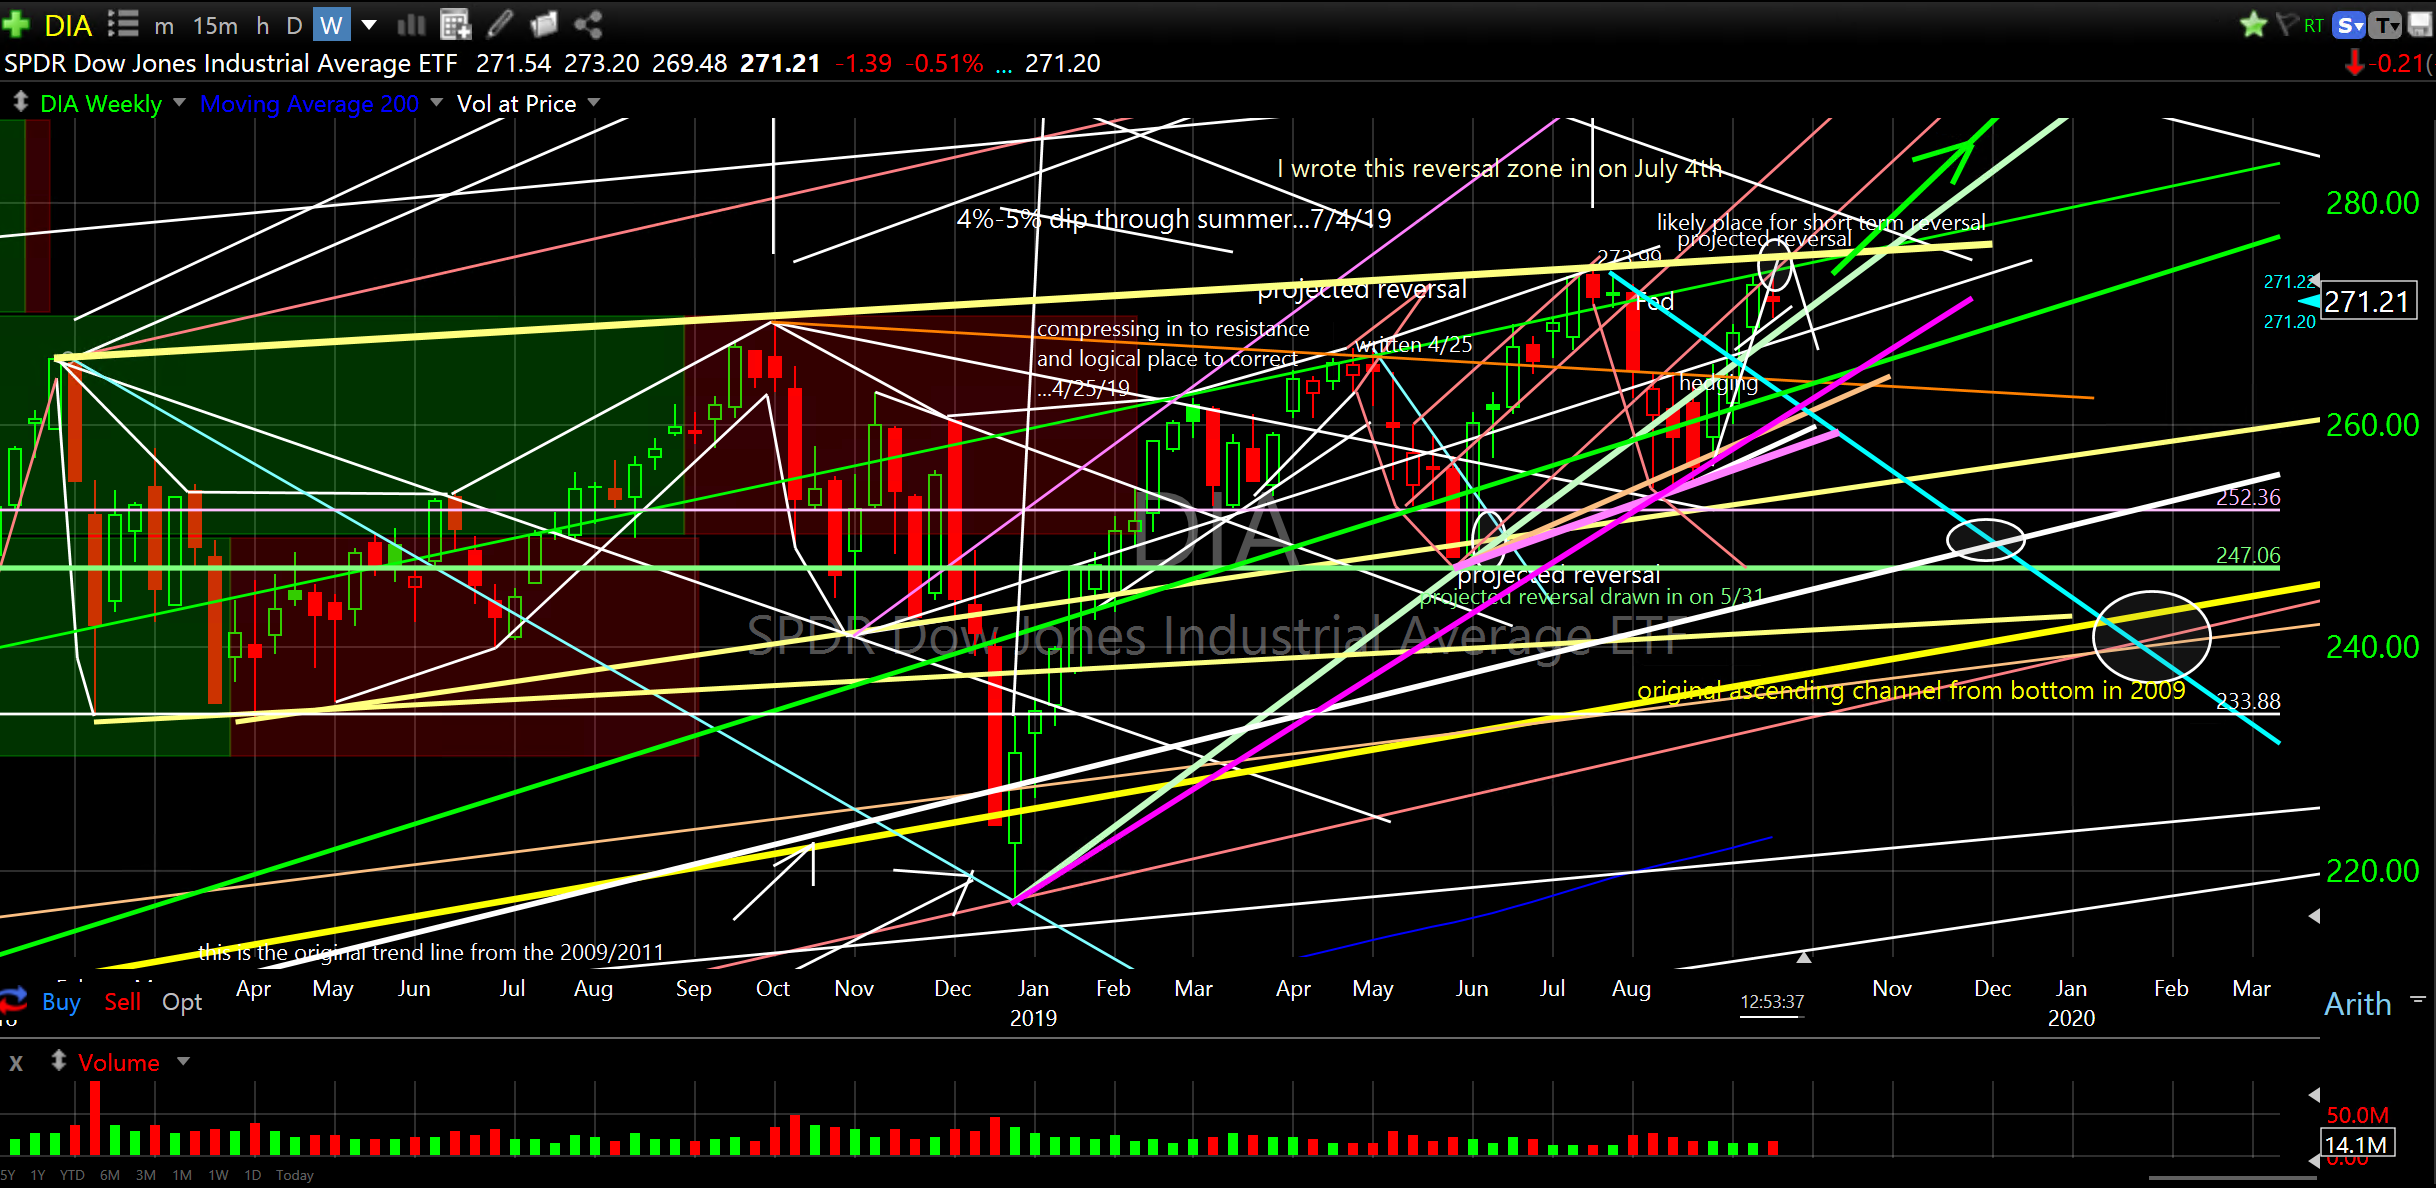
It was an uneventful week except for some market confusion following the Fed announcement of a 25 basis point cut on Wednesday and the short lived spike in crude oil. Meanwhile the Dow continues its march higher towards the ascending yellow line (see chart) which is the upper band of the consolidation zone from early 2018. This is the level to watch. We are very close and how price reacts to this level over the coming weeks will be quite telling. My expectation for higher prices well into 2020 remains unchanged due to all of the evidence I have presented over the past few months. Could we get another dip prior to or immediately after reaching/breaching the yellow line? Certainly. Remember, anything is possible. We might even get an October dip (seasonally common). I don’t know.
What I do know is I am preparing for and planning on a robust expansion. Once the broader market releases above the yellow line (could take a couple of attempts) with strength it should move fast with momentum. That will be the confirmation and the time to start pushing the buy buttons. See weekly chart of DIA which shows the massive consolidation zone we have been trading in from early 2018. Once price breaks free of this it should start running.
SPDR Dow Jones Industrial Average ETF (DIA) weekly
Over the last couple of weeks I have shared some of my favorite ETF’s and individual stocks to own going into 2020. I continually make slight revisions to the list with some adds and some drops as price positioning occurs. So, rather than just list all the stocks I’m looking at, I will condense my weekly updates to stocks and ETF’s as I buy them. This is assuming I can hold back from showing you other charts…which I doubt. I think this will make it easier on you and easier on me. If you have other instruments you would like me to chart just email me and I would be happy to.
Entry Ideas
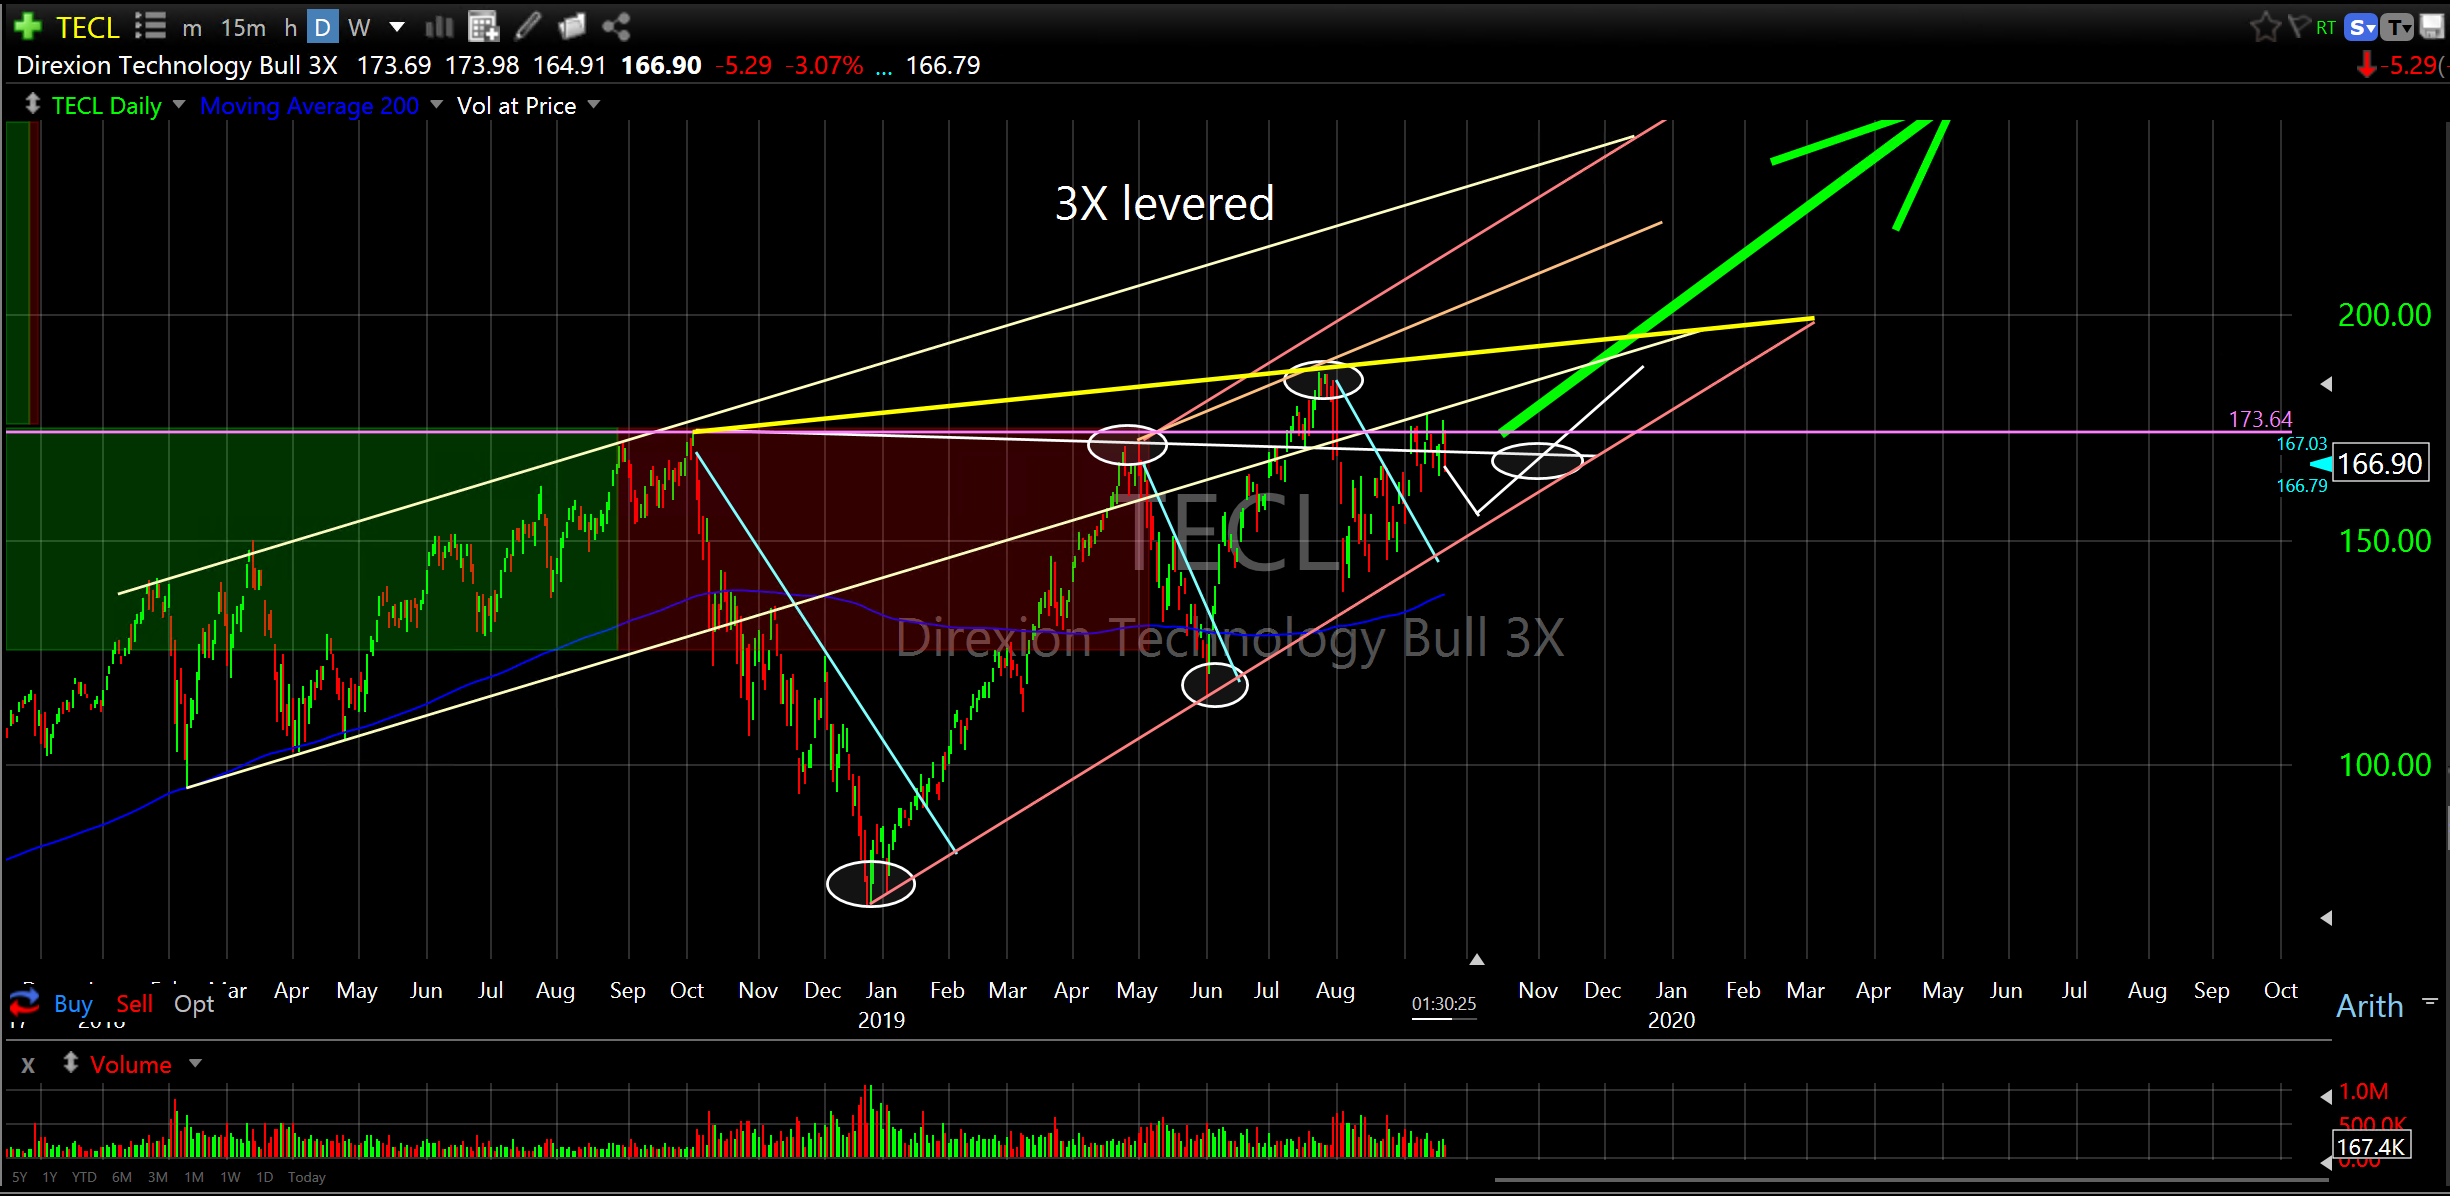
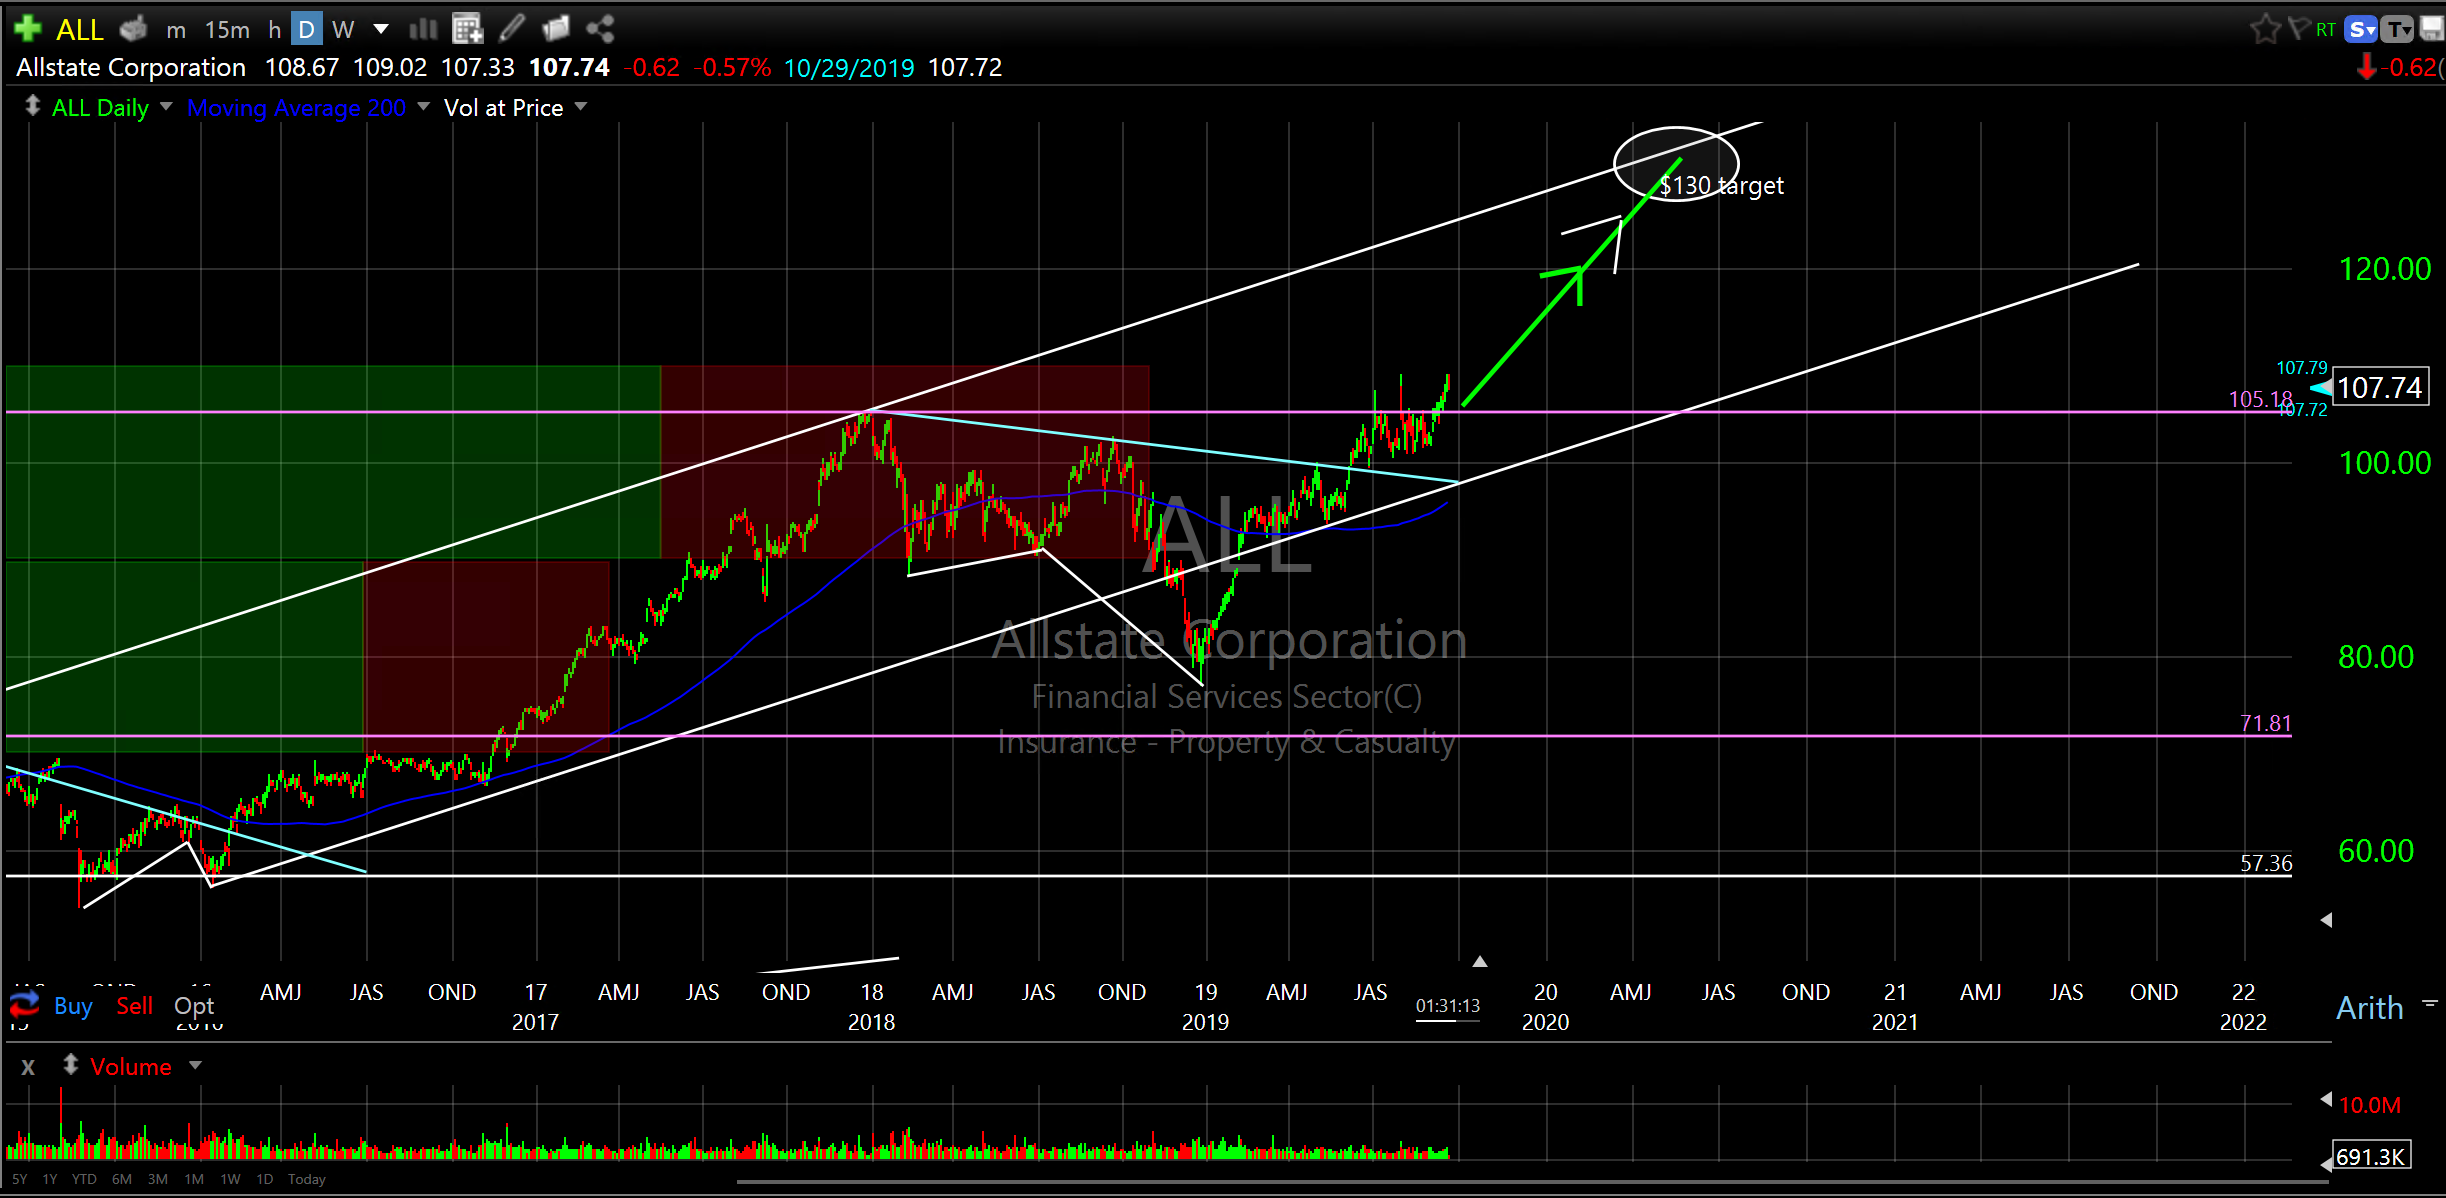
On Friday I bought some Direxion Technology Bull 3X (TECL) and a little Allstate Corporation (ALL). TECL is very aggressive at 3X but I am very bullish. ALL looks a bit more like the broader market and even pays a small dividend. Both charts look good out into 2020. I’m starting the nibbling process early.
Direxion Technology Bull 3X (TECL) daily
Allstate Corporation (AAL) daily
More Charts
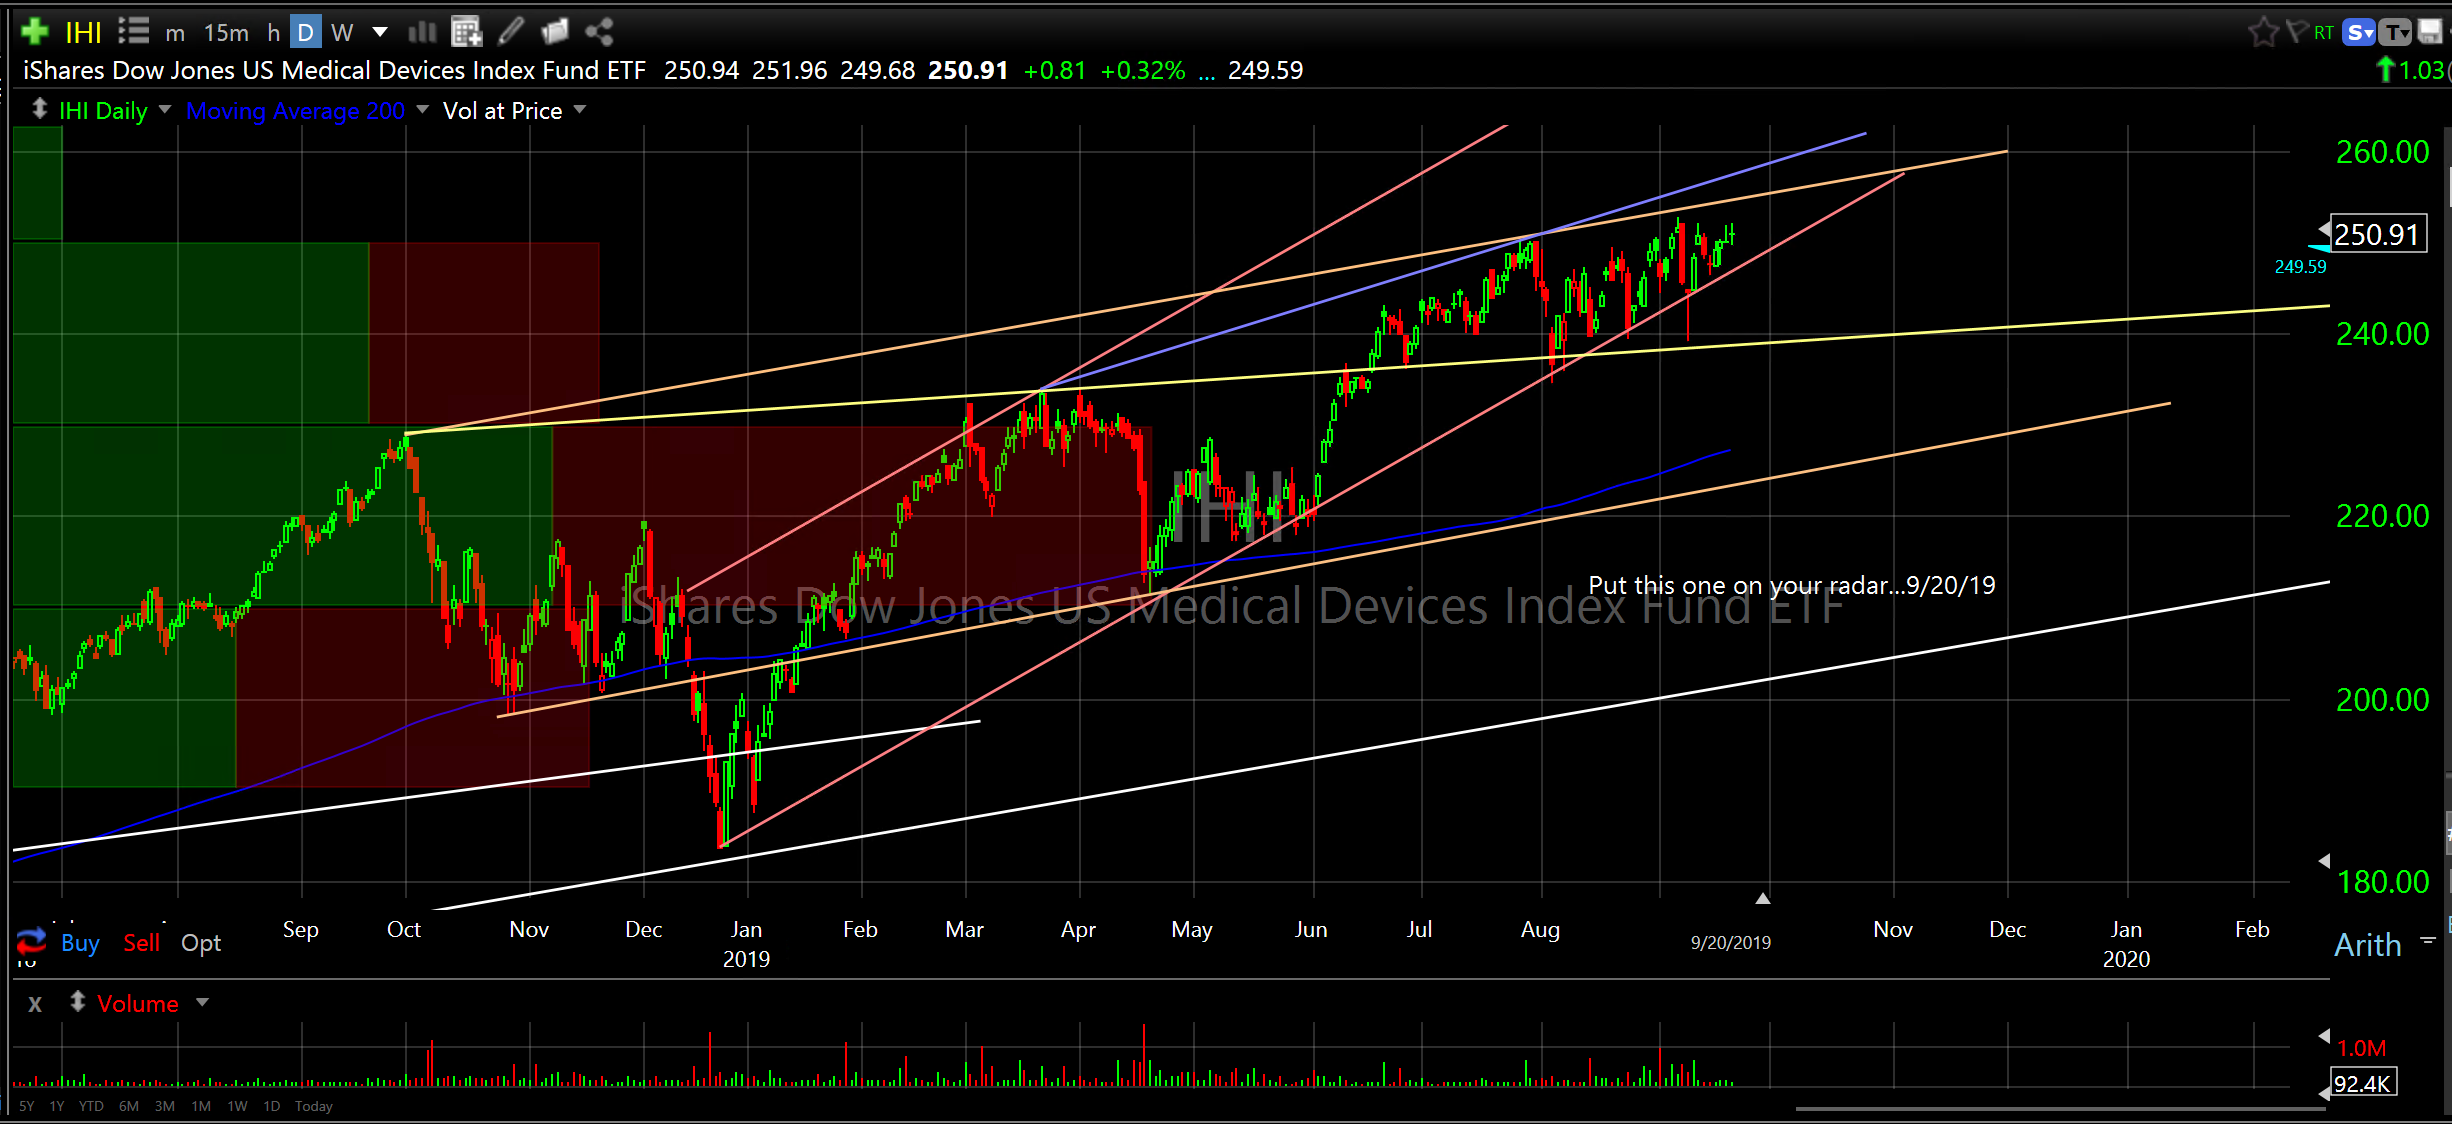
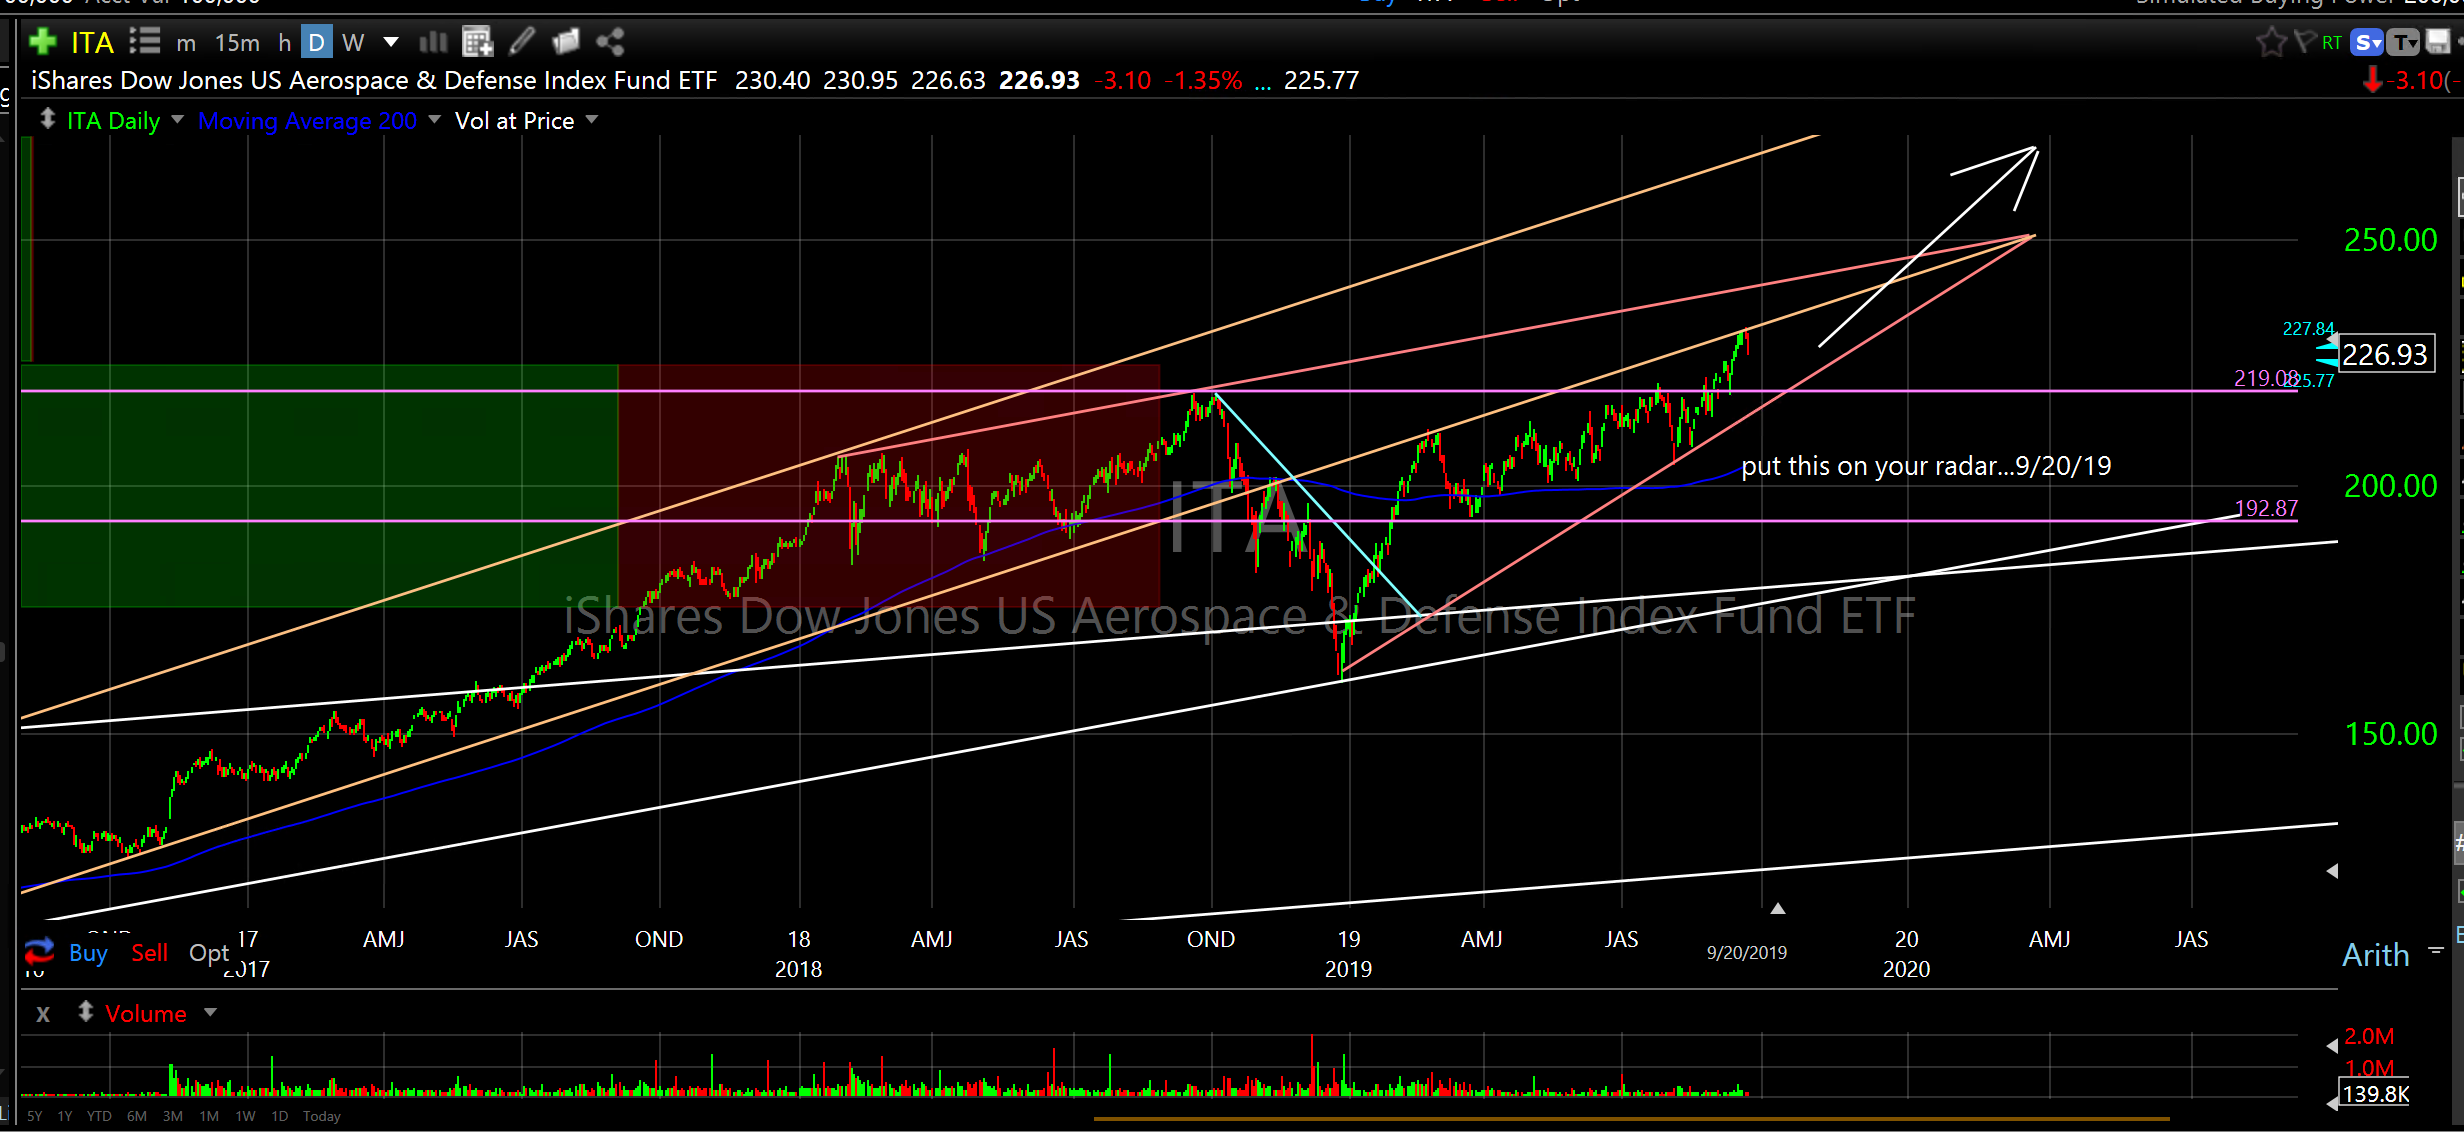
I can’t hold myself back…here are some other instruments/charts that are looking good as well. Put these on your radar.
iShares Dow Jones US Medical Devices Index Fund ETF (IHI) daily
iShares Dow Jones US Aerospace and Defense Index Fund ETF (ITA) daily
Direxion Small Cap Bull 3X Shares (TNA) weekly…I love this chart! Small caps should rip next year. Look at the cycle repetition. Just amazing. Look at it again.
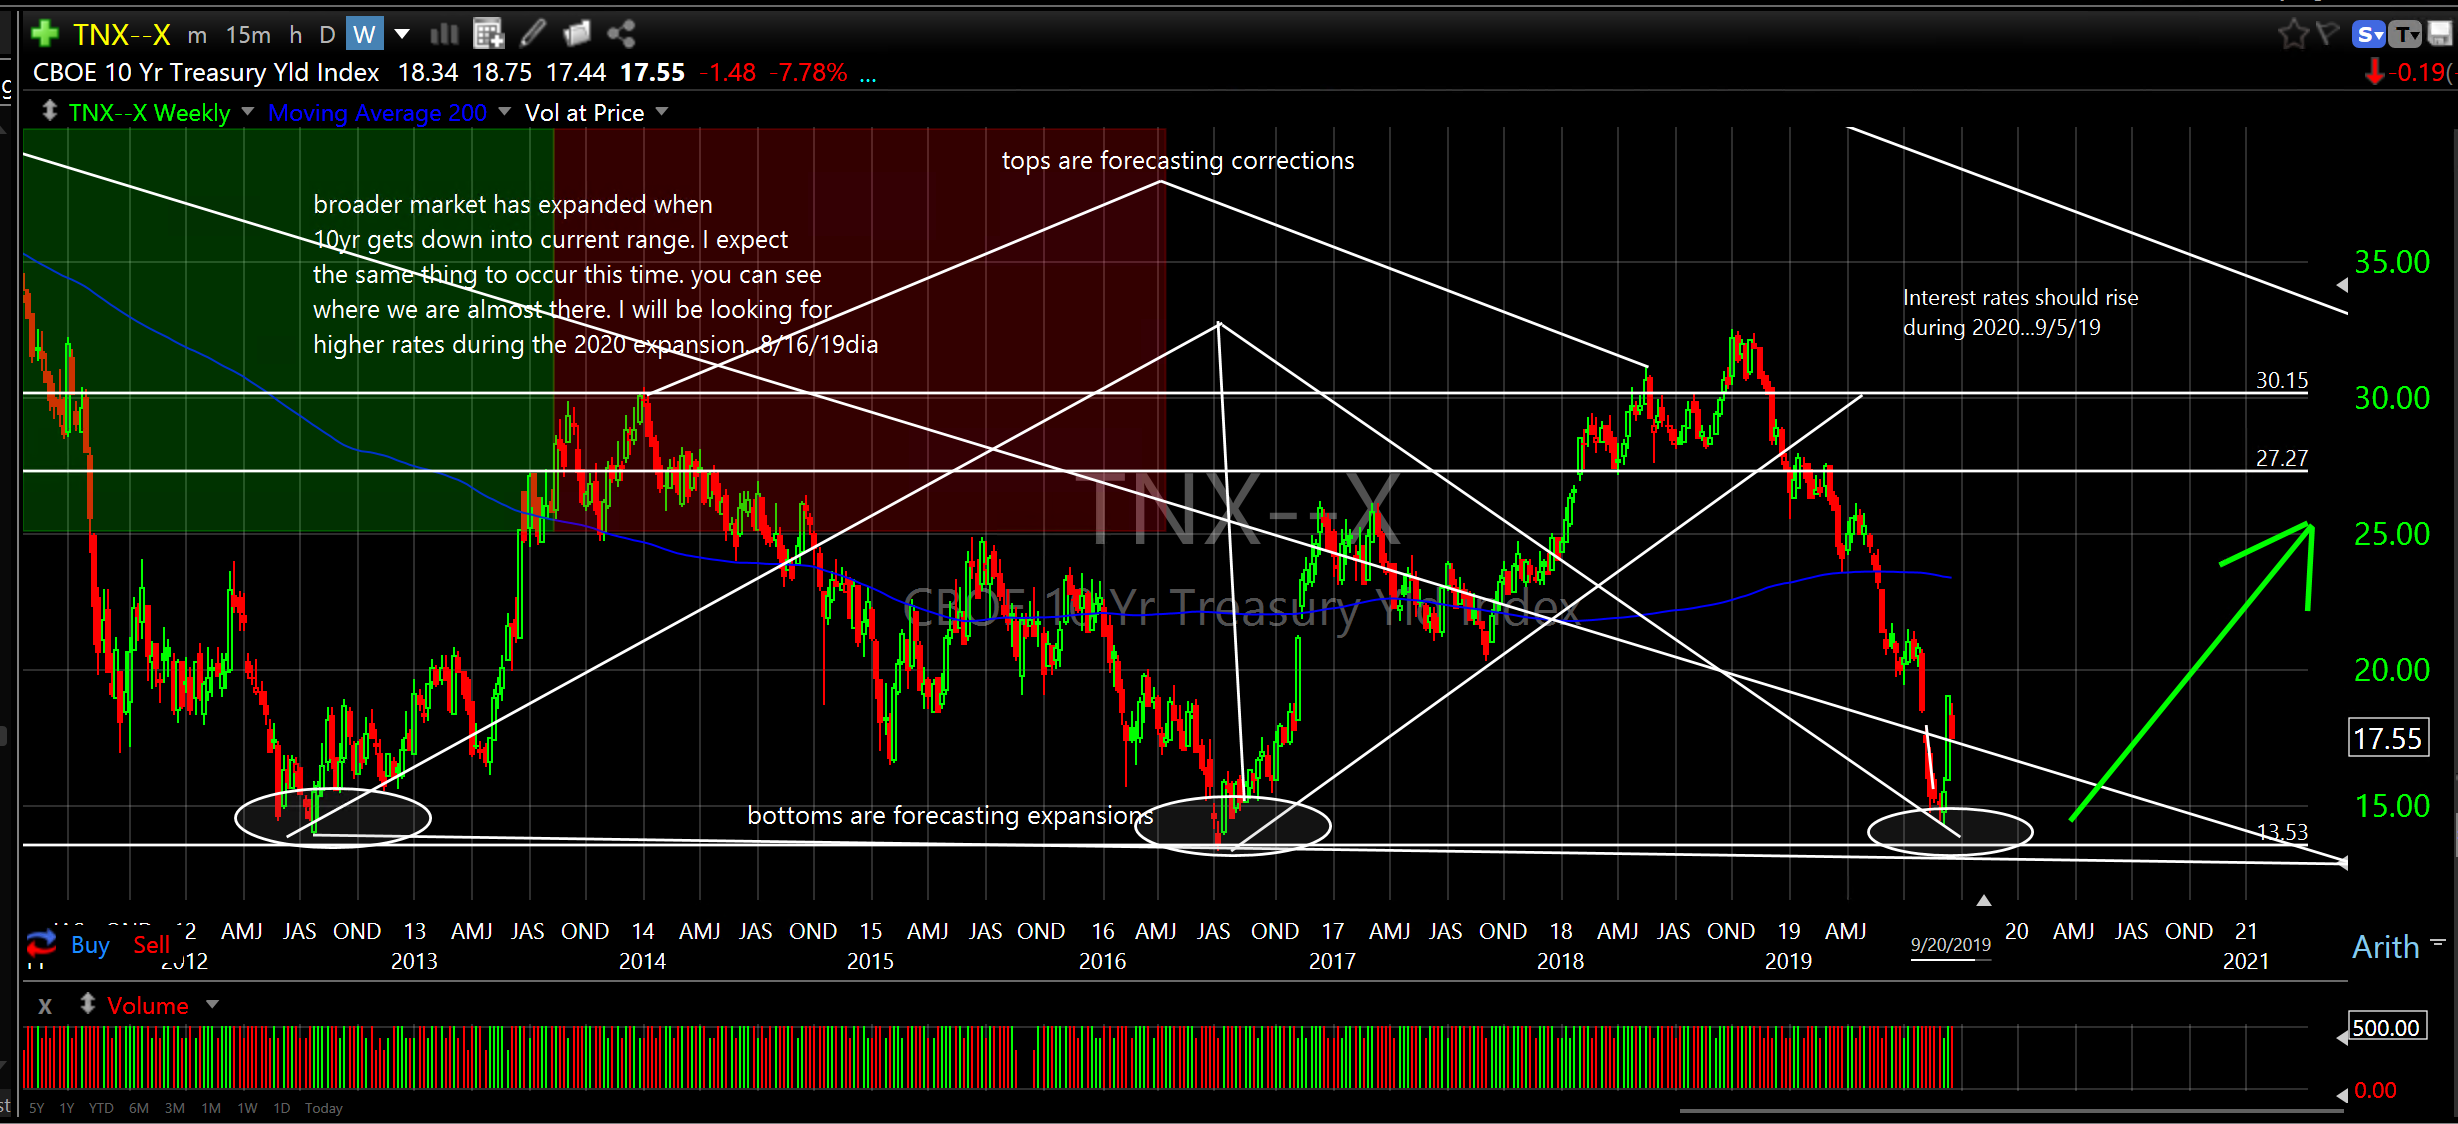
Yield/Equity Expansion Correction Relationship
I will leave you with the chart of the 10 Year Treasury Yield. I have shared this chart many, many times. A picture is worth a thousand words. How can you not love this chart.
CBOE 10 Yr Treasury Yld Index (TNX-X) weekly
Weekly Rant
One more thing…I highly recommend downloading Ray Dialio’s (CEO of Bridgewater Associates) “Principles in Action” app. I just downloaded it on my phone. It is just awesome. He is amazing. I love it. Truly, principles to live by.
He discusses being open minded. Sadly, many are not. When I first became interested in price action/charting it was considered about as valuable as reading Tibetan tea leaves under a full moon while twiddling your thumbs. Today, 35 years later, technical analysis is more widely accepted as a legitimate form of analysis, however, it is still under utilized and mostly misunderstood.
After many decades of being a student of price action there are few things I know to be true…and…believe it or not, most of which is not believed/understood by most (professionals included). Fun fact…a 25 year veteran Financial Advisor with a well known national firm who has been reading my work for the past 1 1/2 years is now a budding convert.
Go ahead and quote me…
Price action is mostly not random.
Price action can be predictable.
Price action is measurably cyclical.
Price action is fractal.
Price action is symmetrical (in time and price).
Price action is repeatable.
Price action can be leveraged.
You can actually know what price “should” do.
I’m probably preaching to the choir as I know if you are reading this you are open minded. Well done.
Happy Fall,
Don