Wrapping up the “Best of the Best” series, I have to include the following companies. They are all positioned to channel higher during the 2020 expansion.
The Walt Disney Company (DIS)

Roku Inc (ROKU)

Shake Shack Inc (SHAK)

Costco Wholesale Corp (COST)..if Costco doesn’t sell it, I don’t need it.

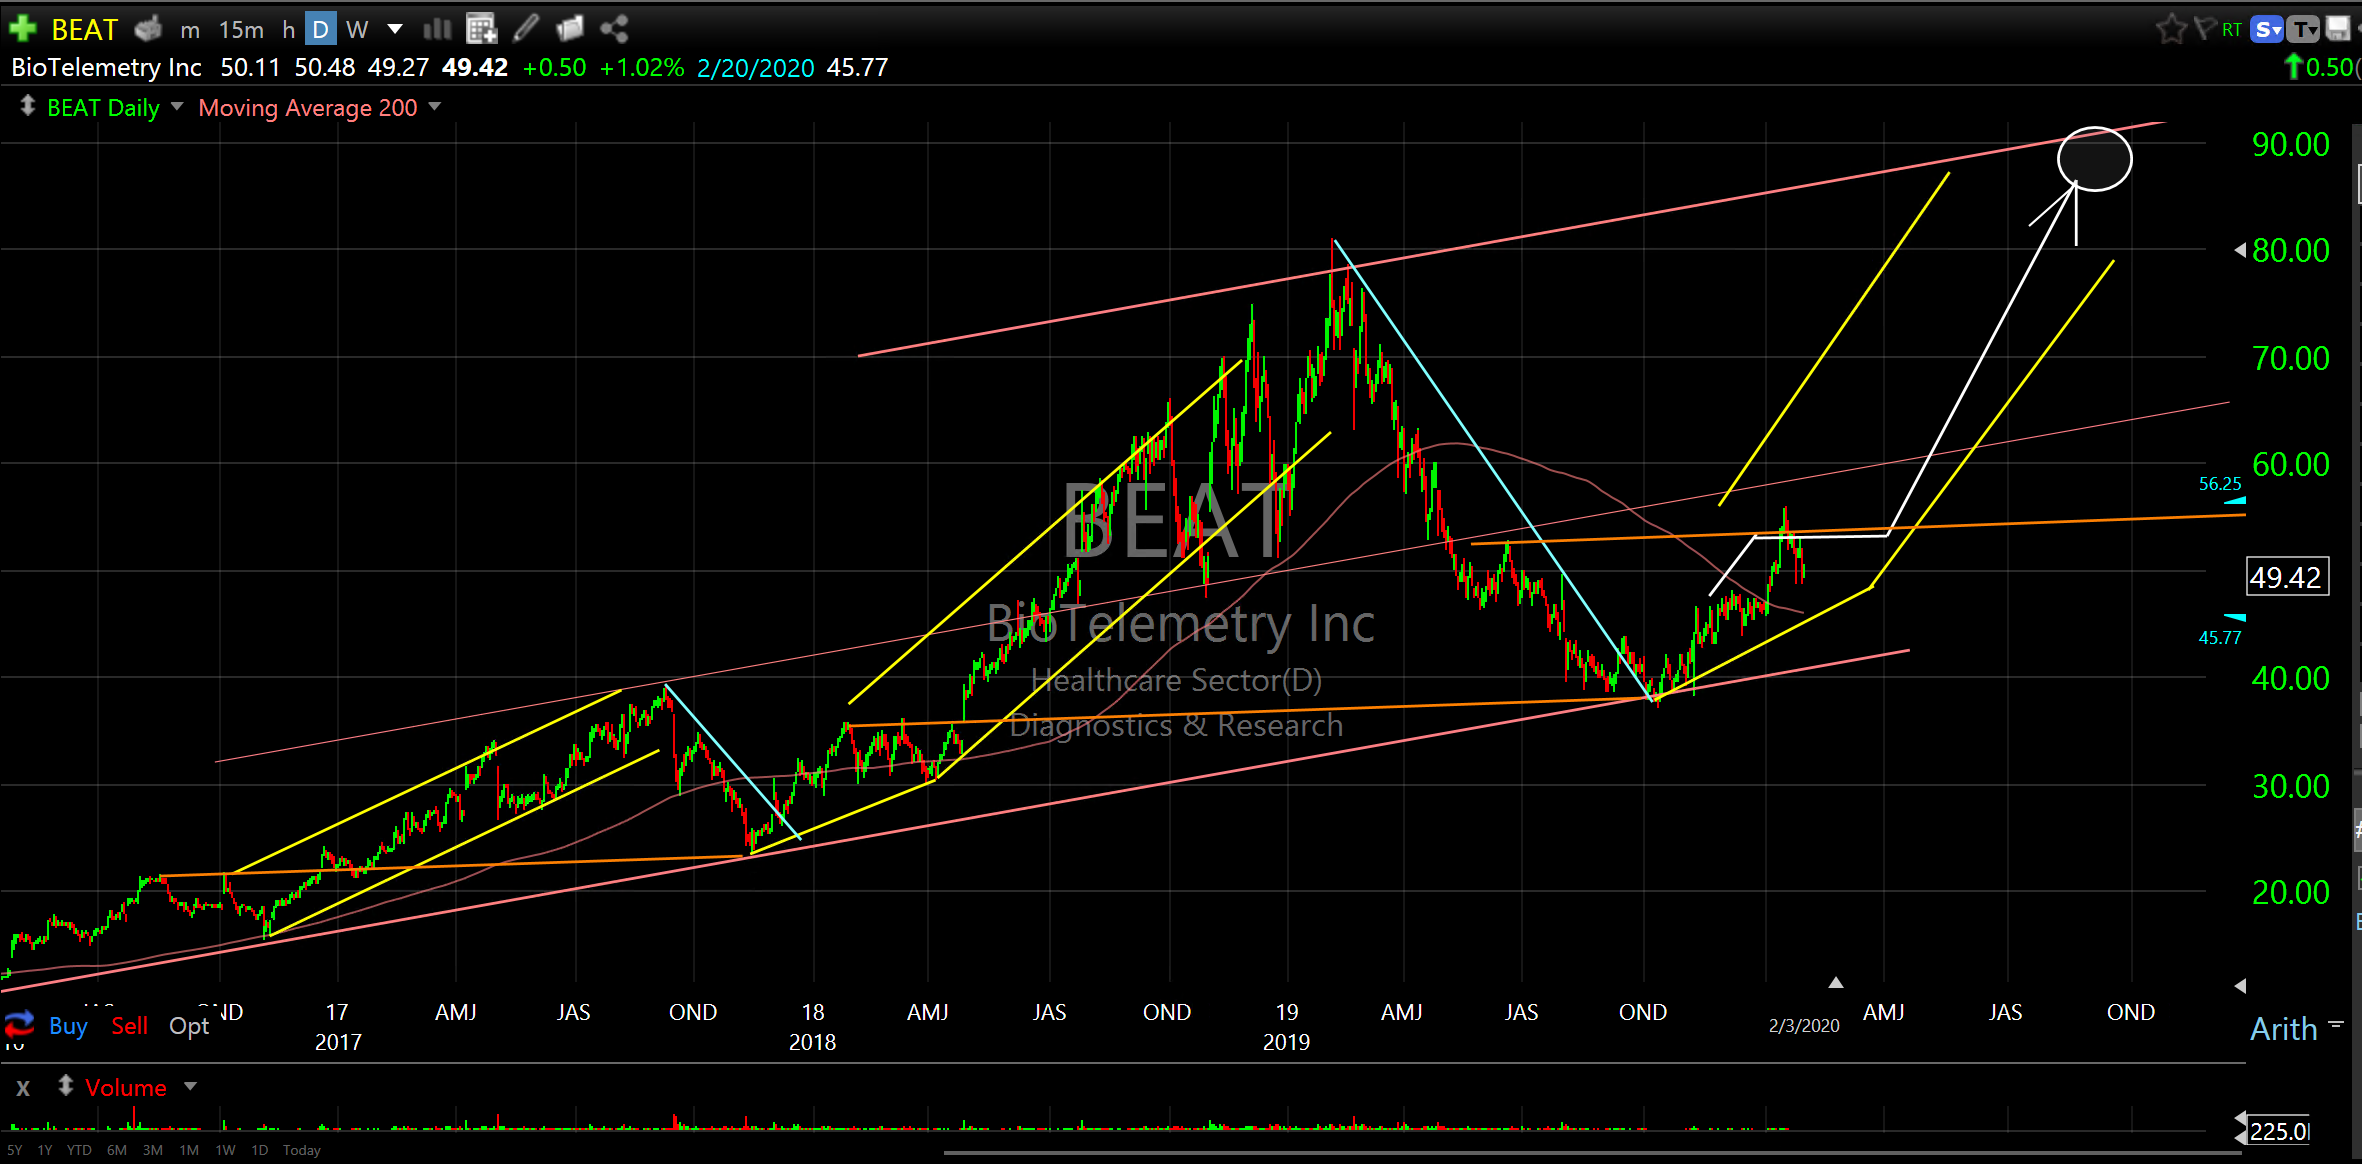
BioTelemetry Inc (BEAT)
PayPal Holdings Inc (PYPL)

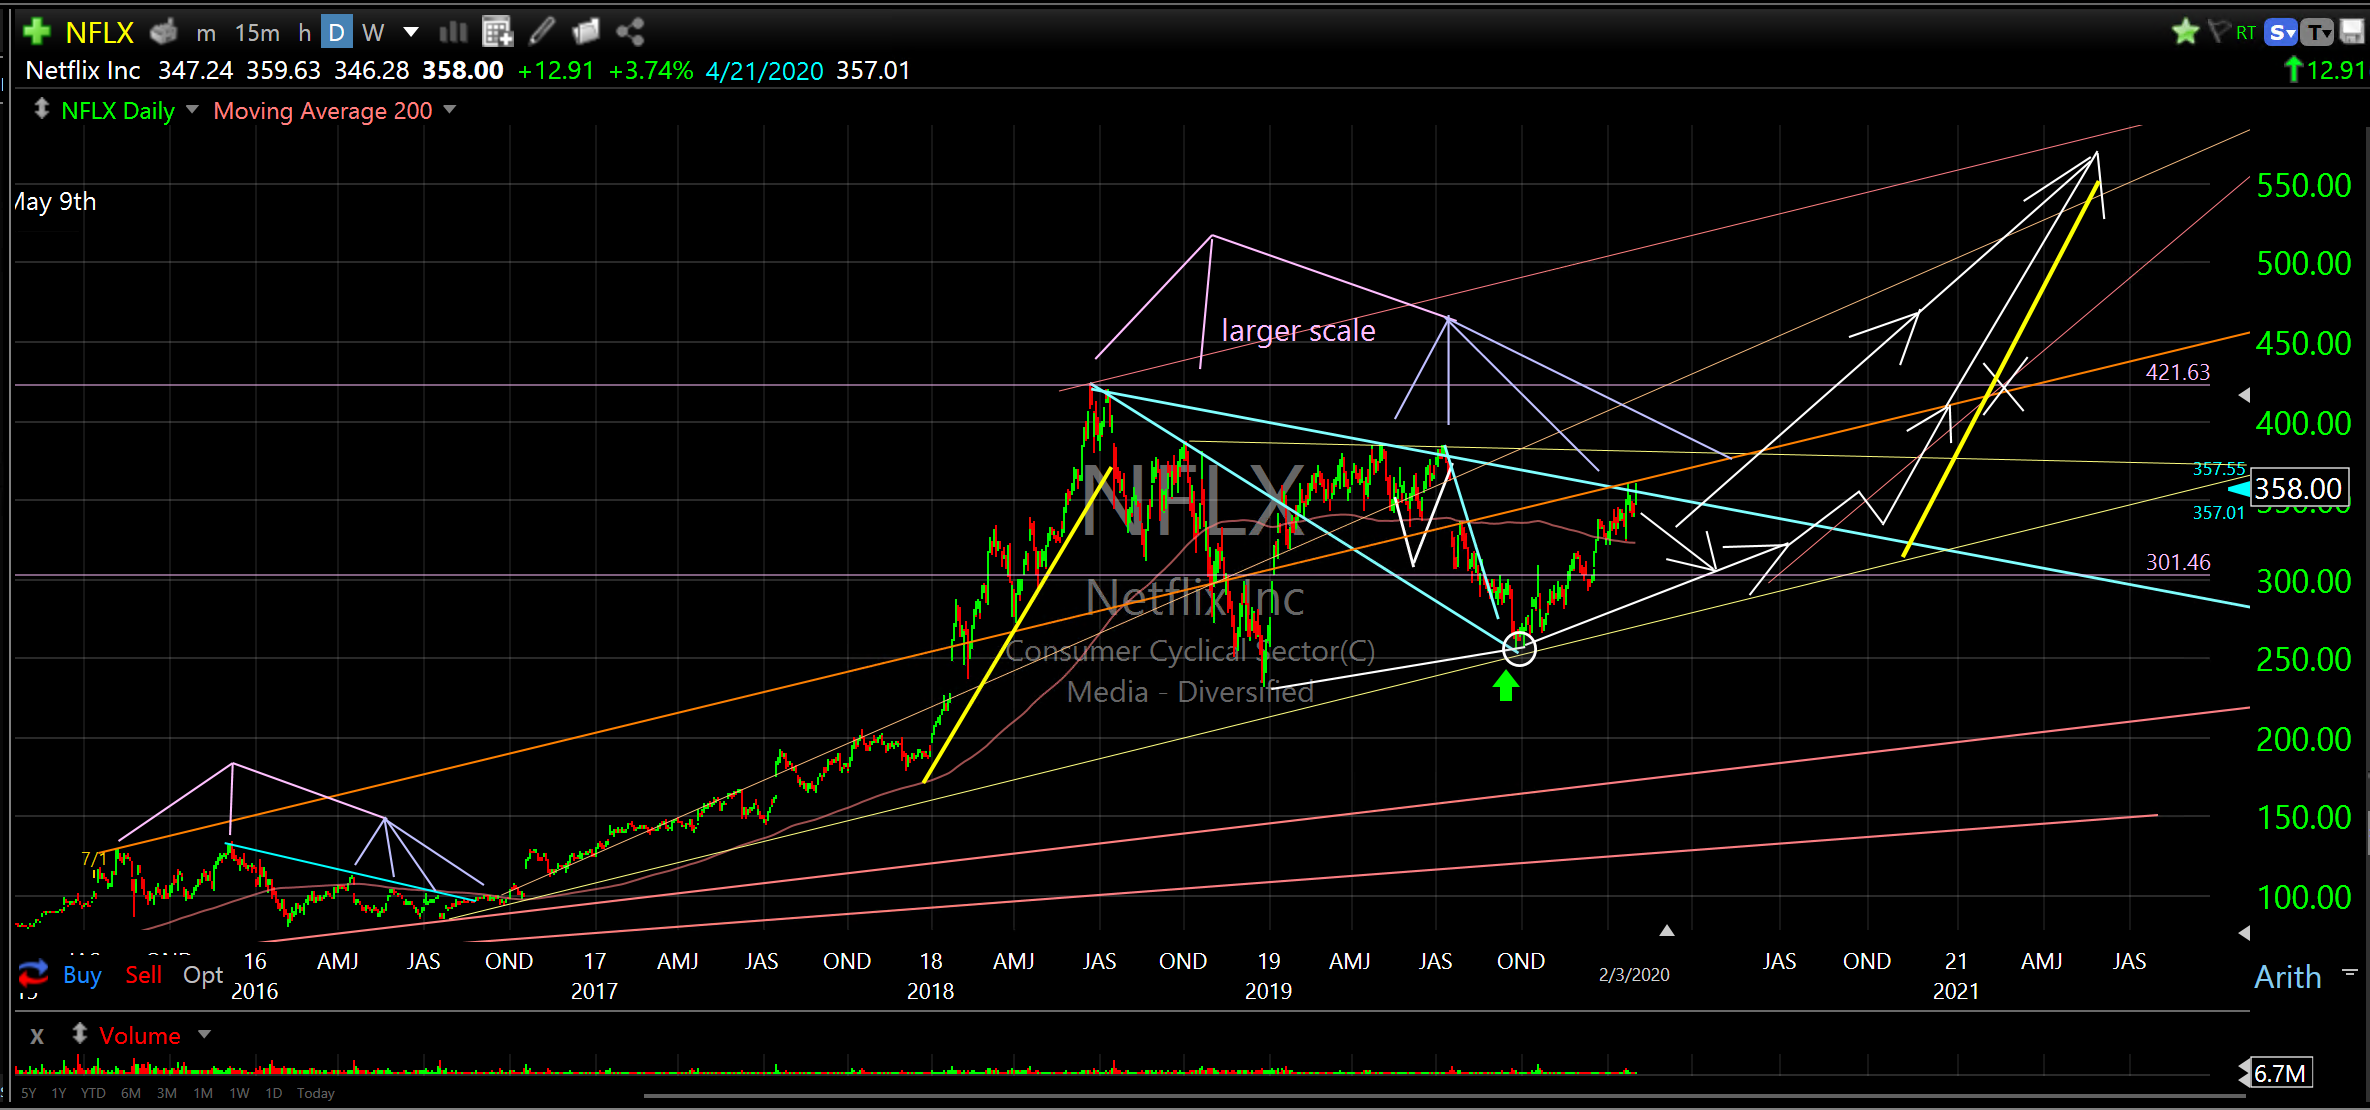
Netflix Inc (NFLX)
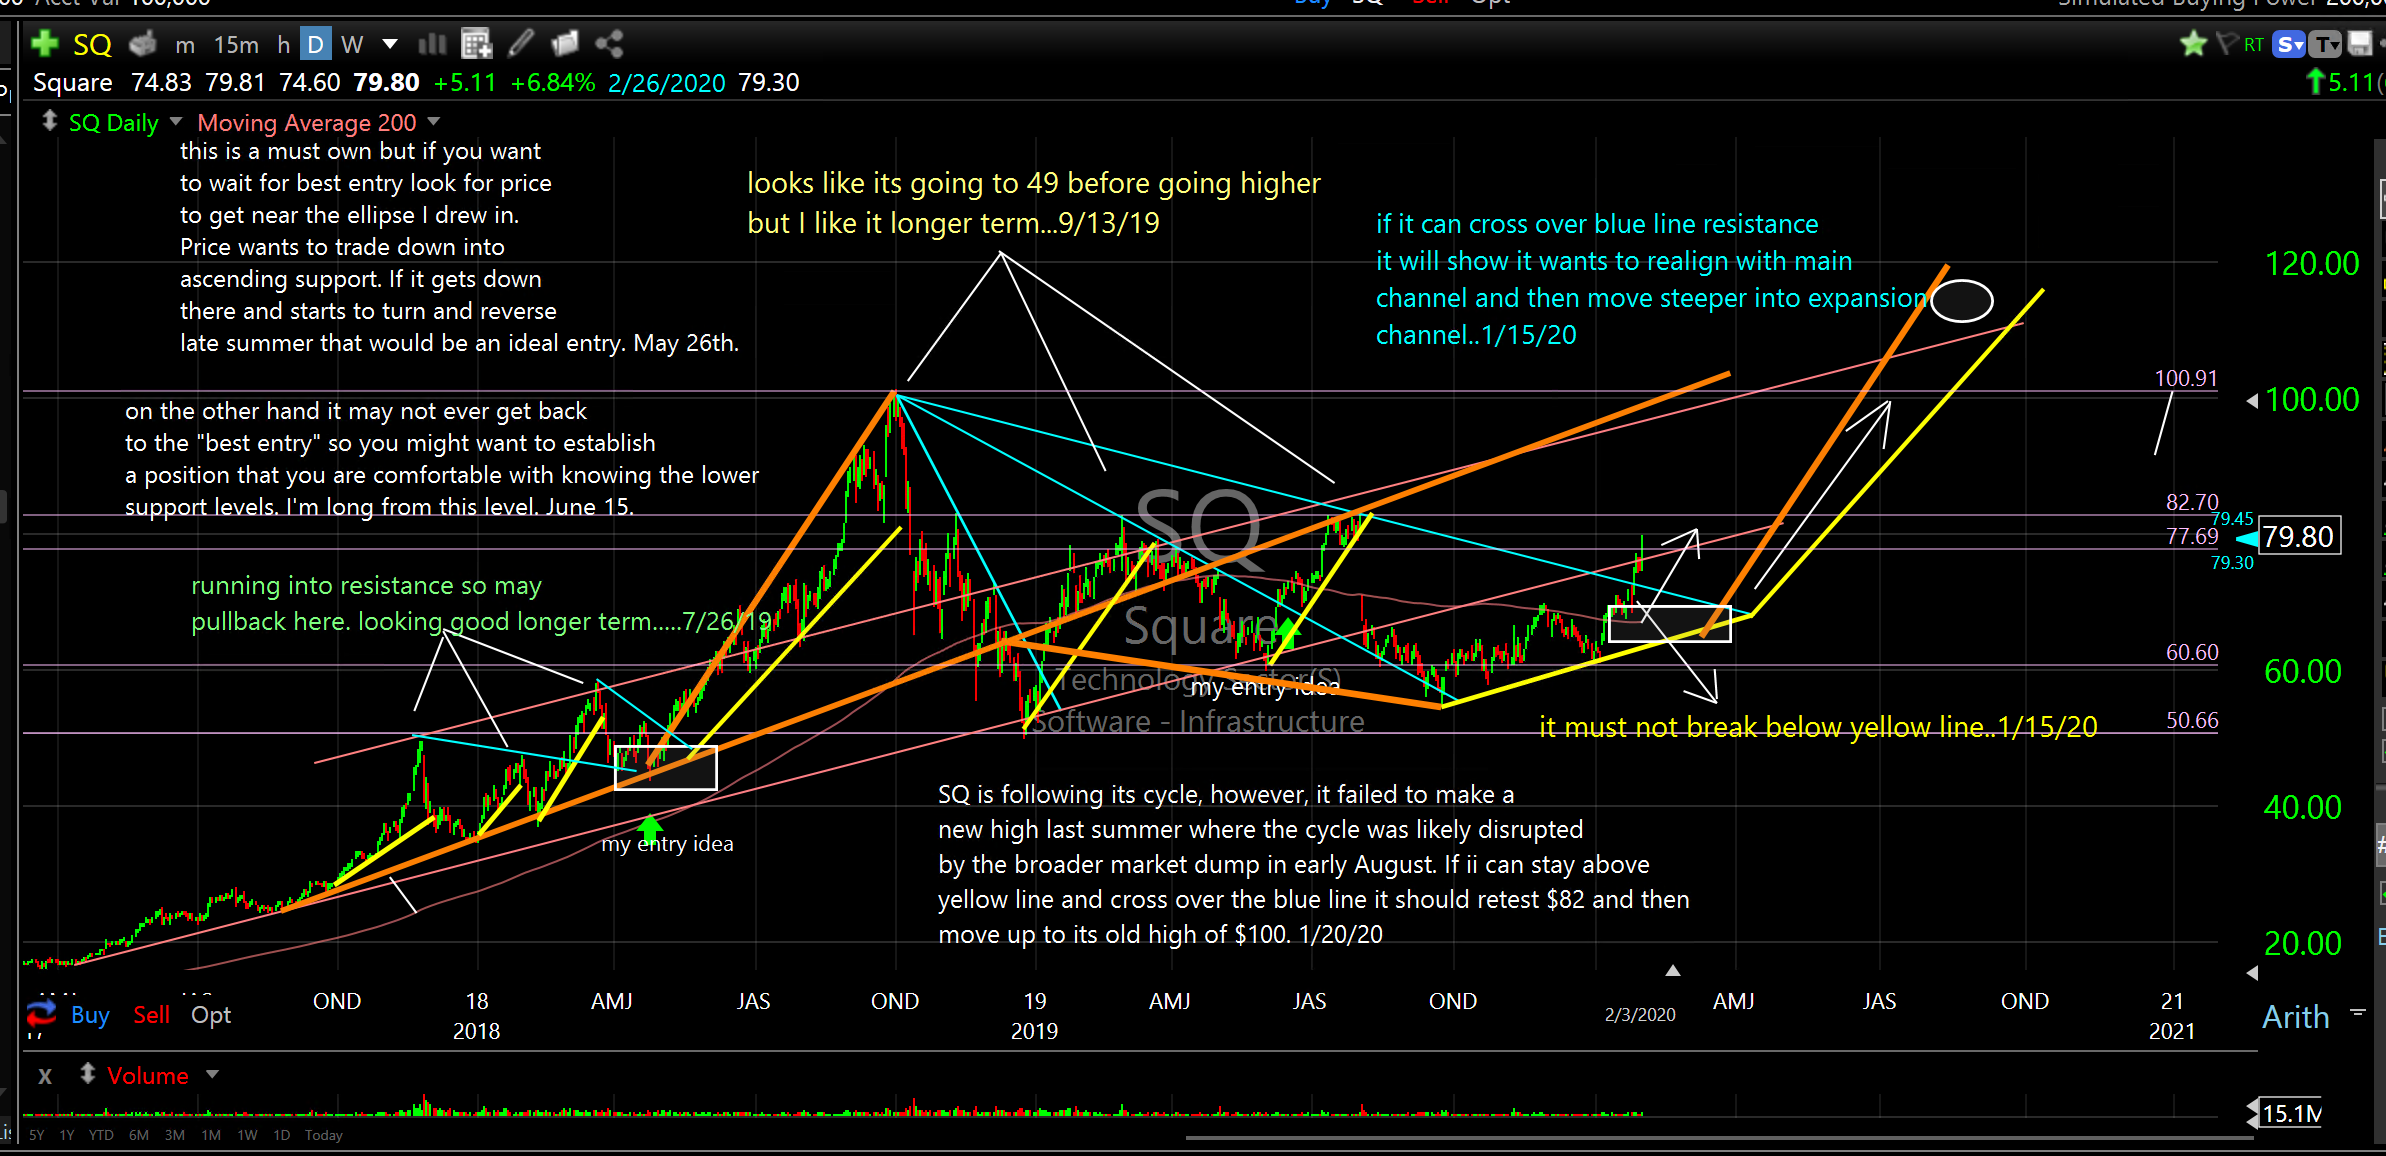
Square (SQ)
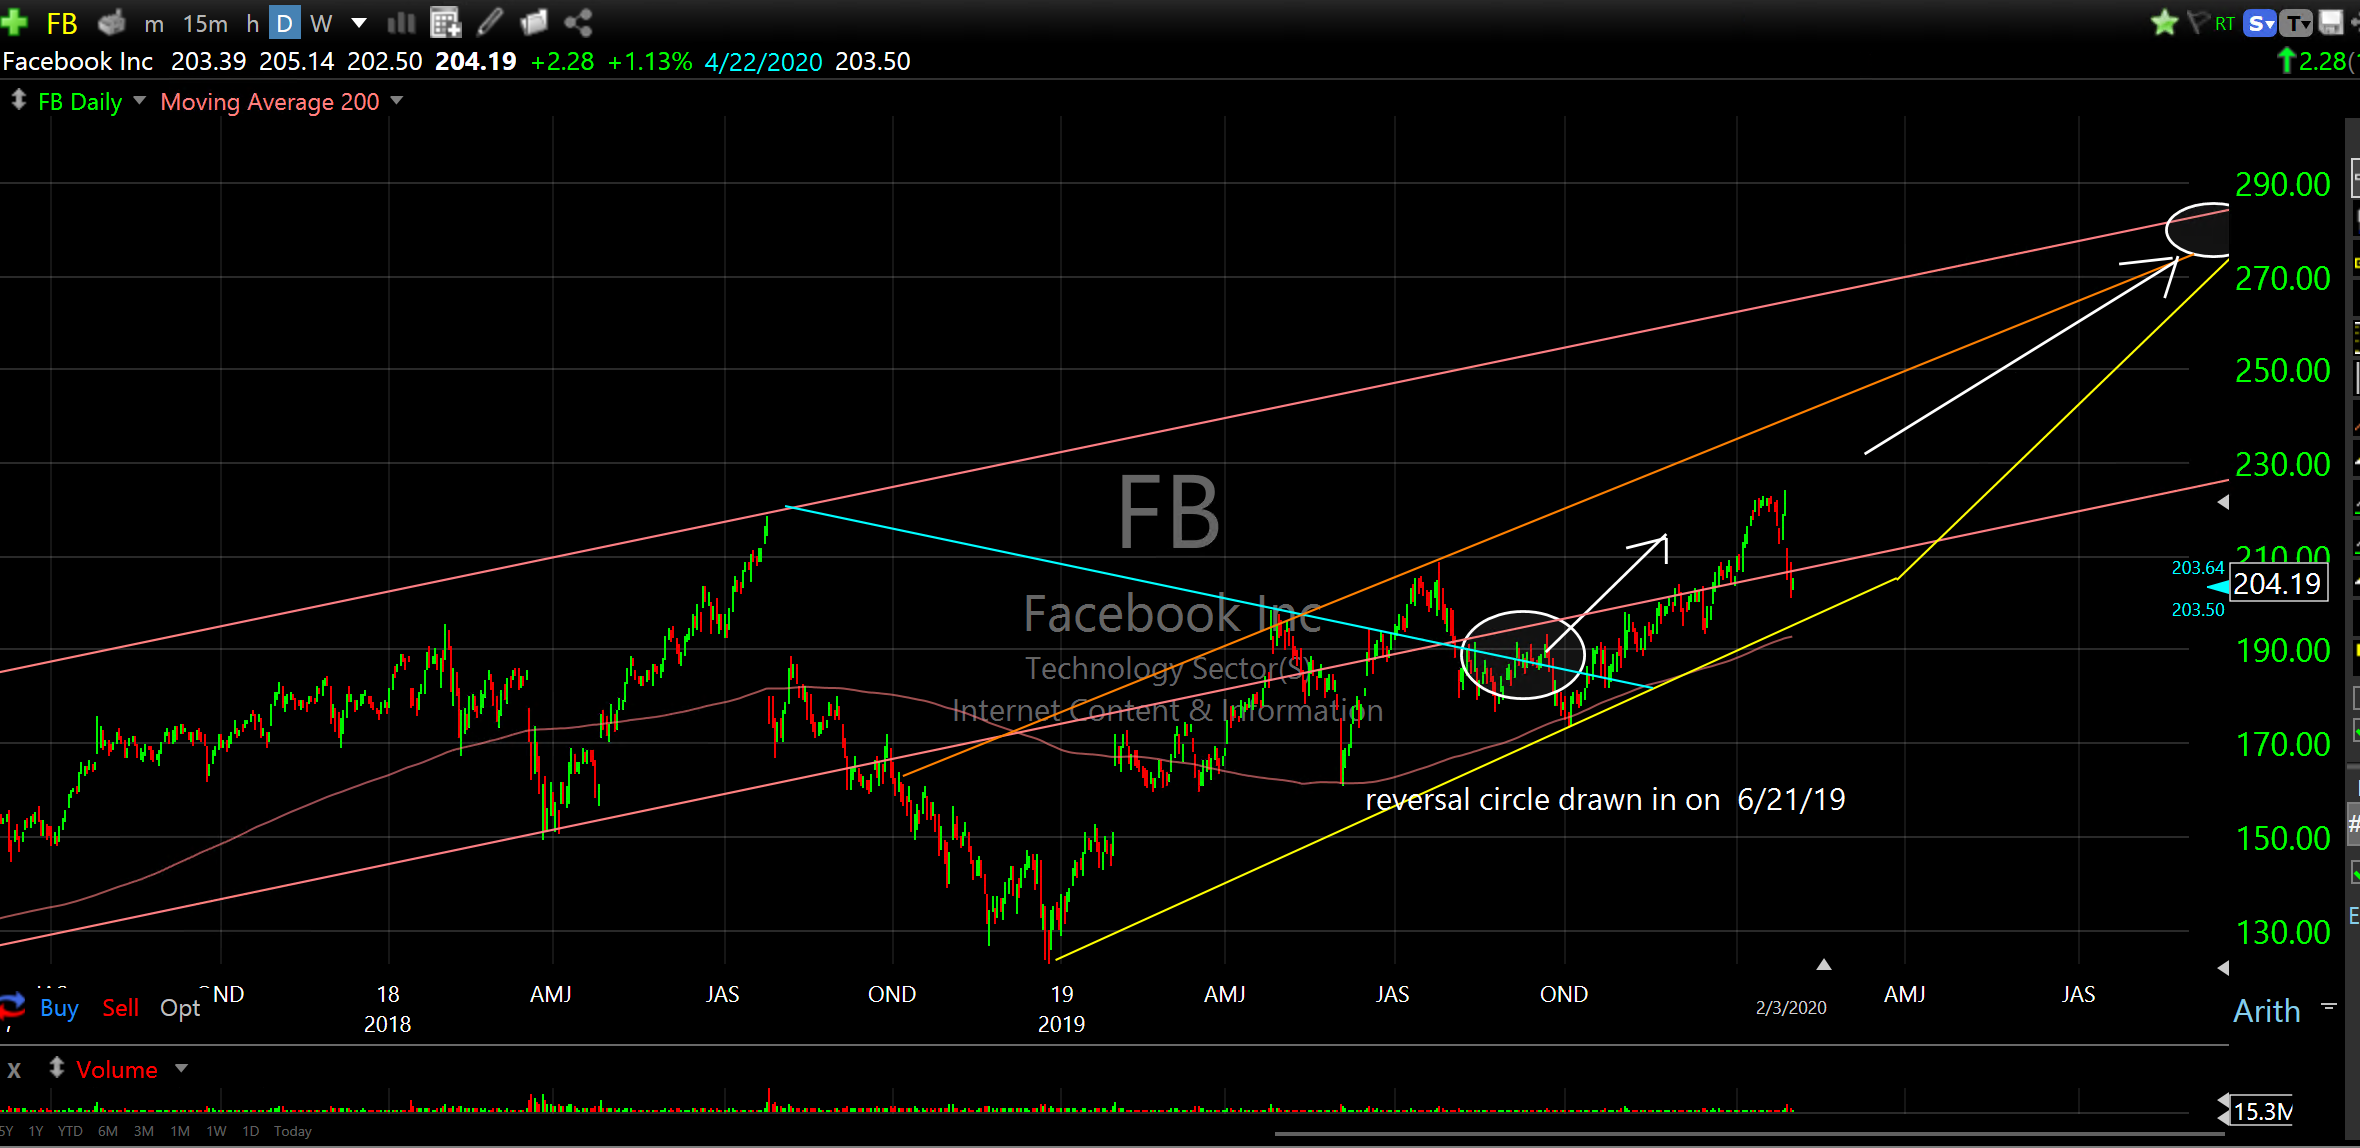
Facebook Inc (FB)
Amazon.Com Inc (AMZN)

Apple Inc (AAPL)

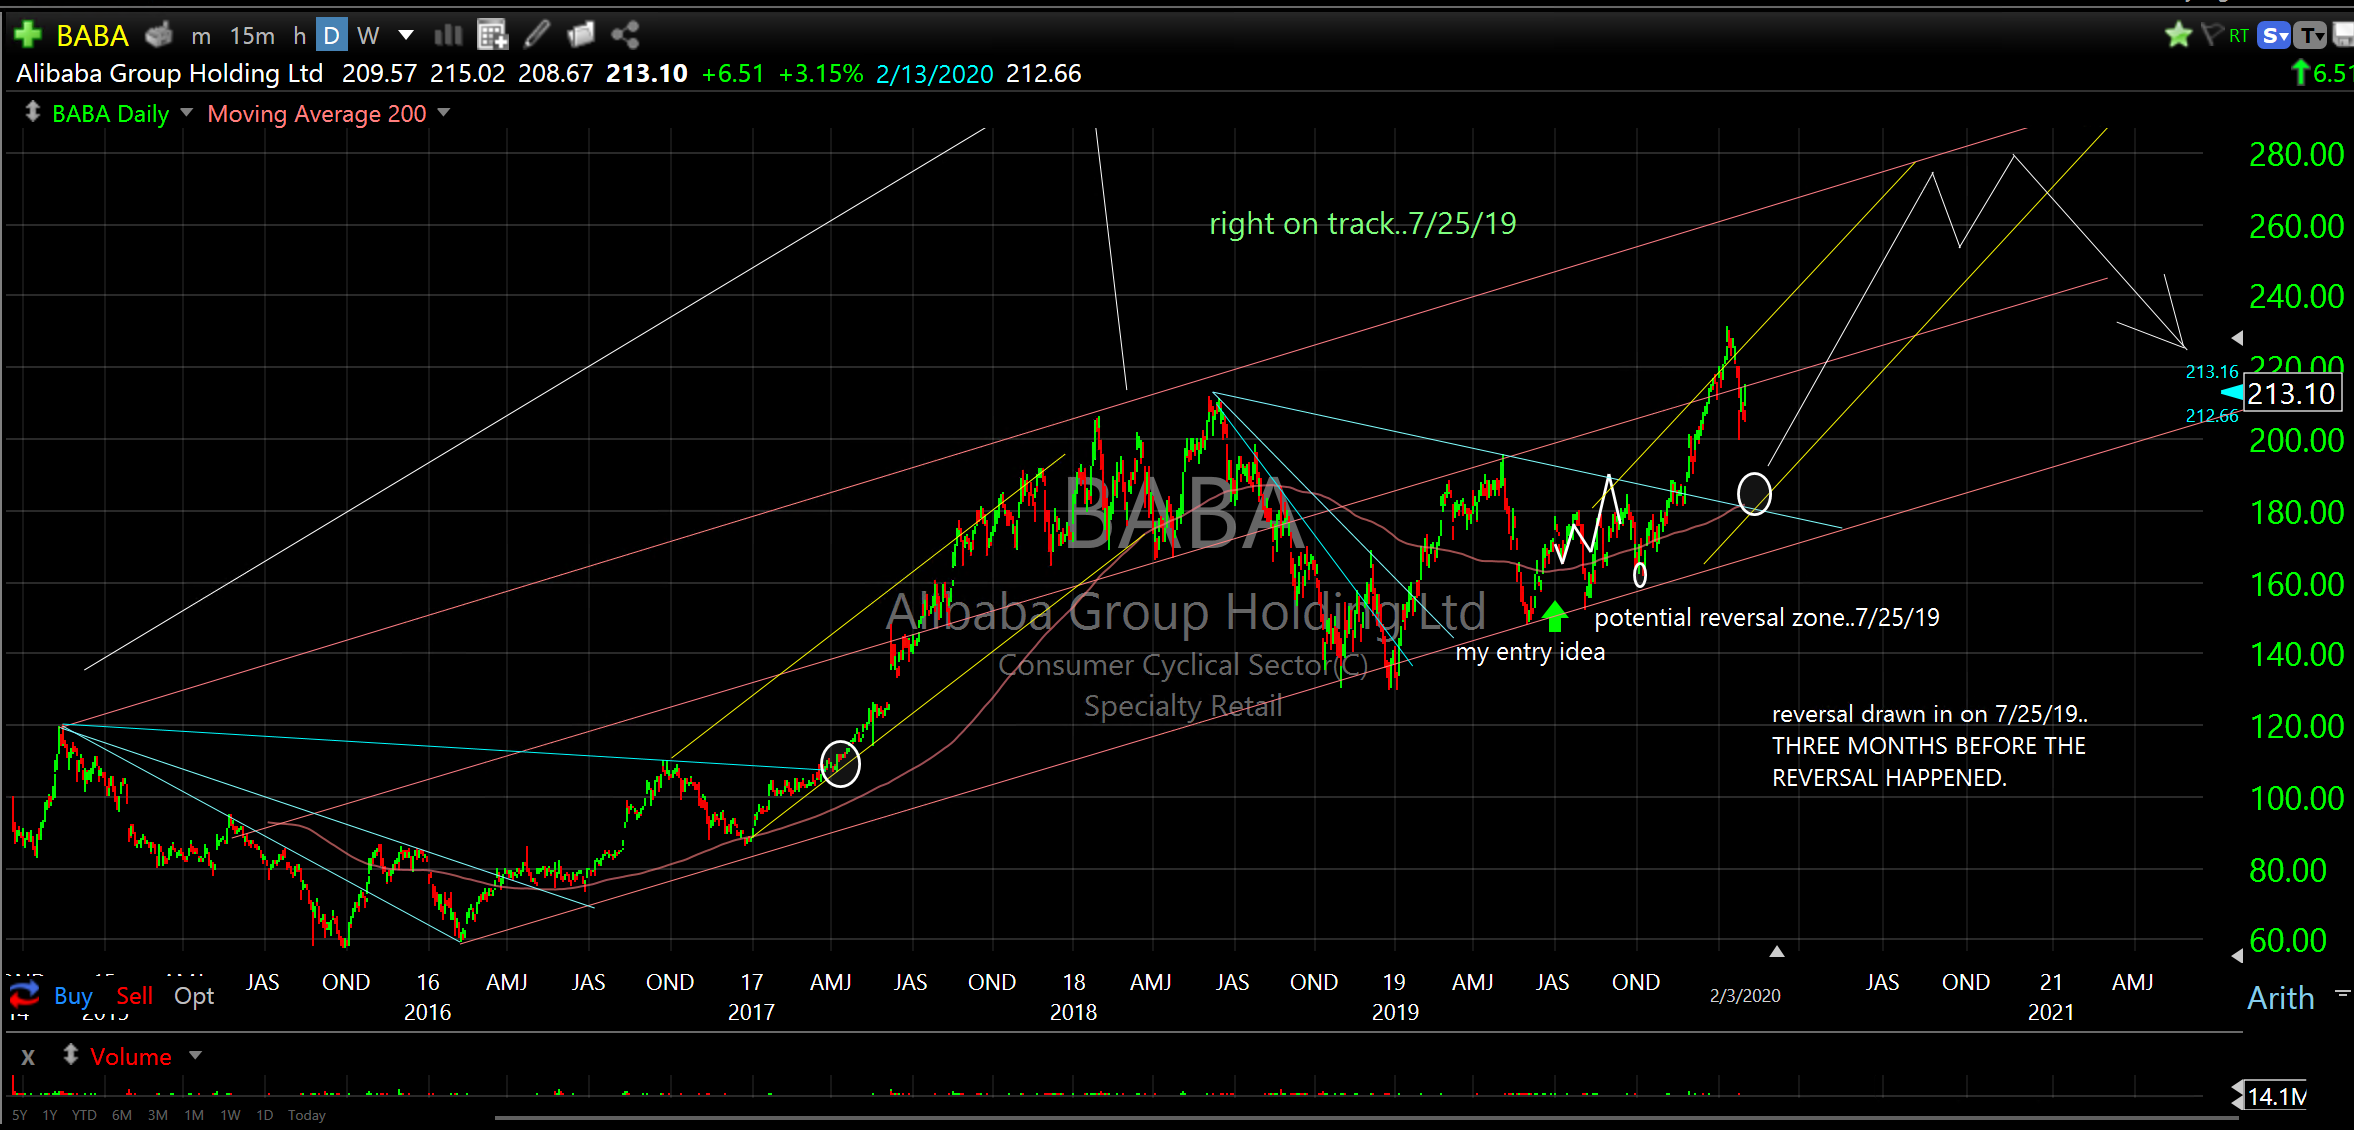
Alibaba Group Holding Ltd (BABA)
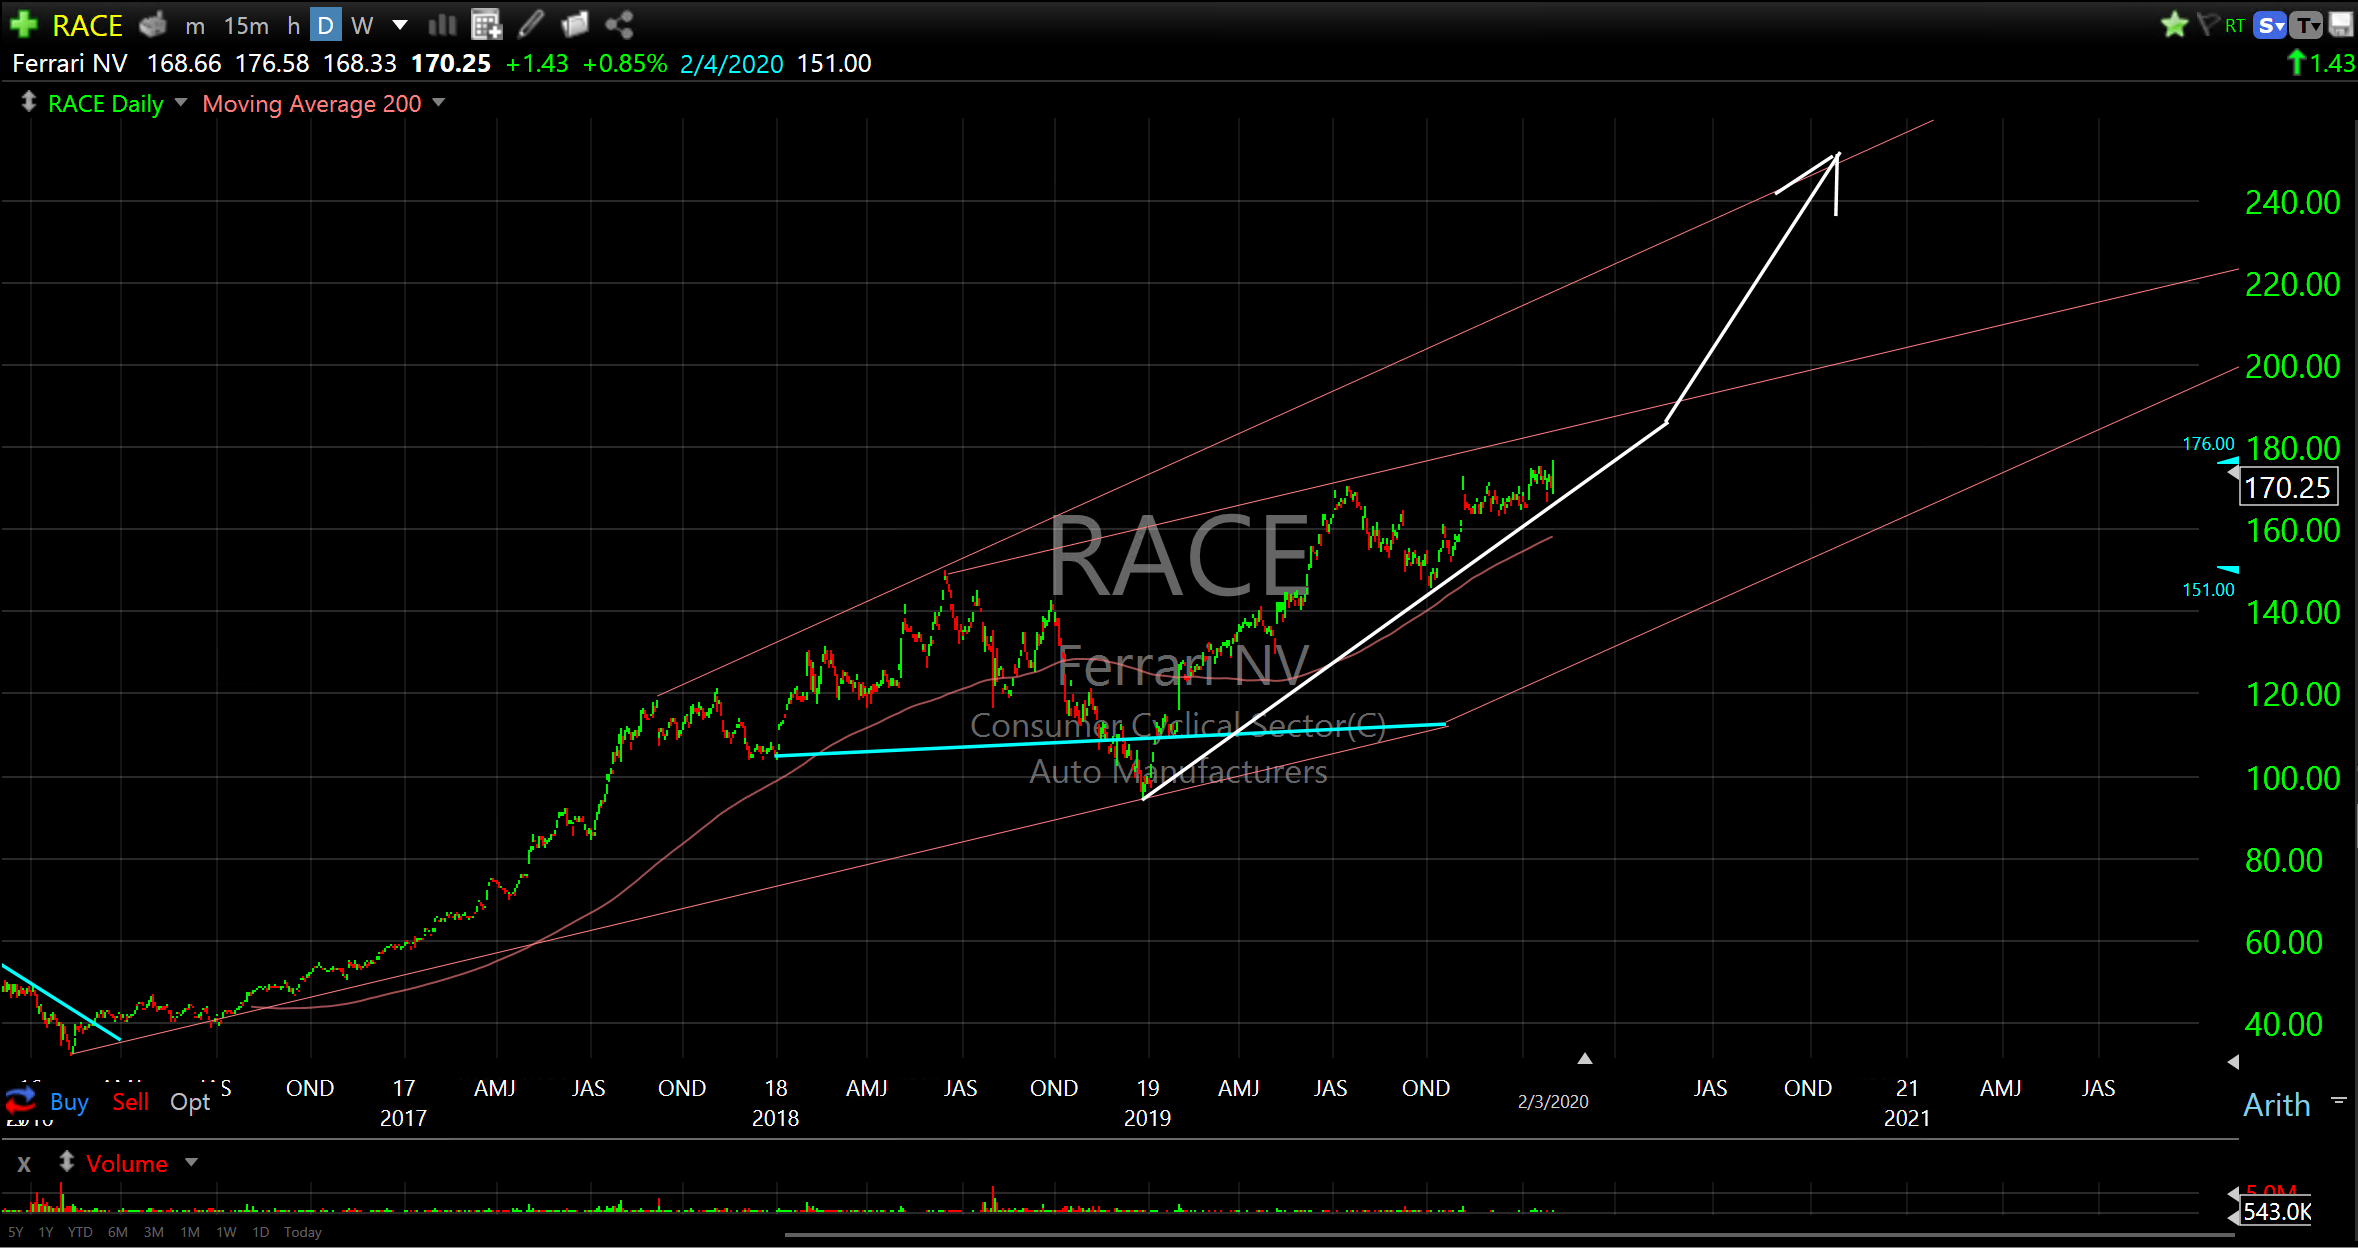
Ferrari NV (RACE)
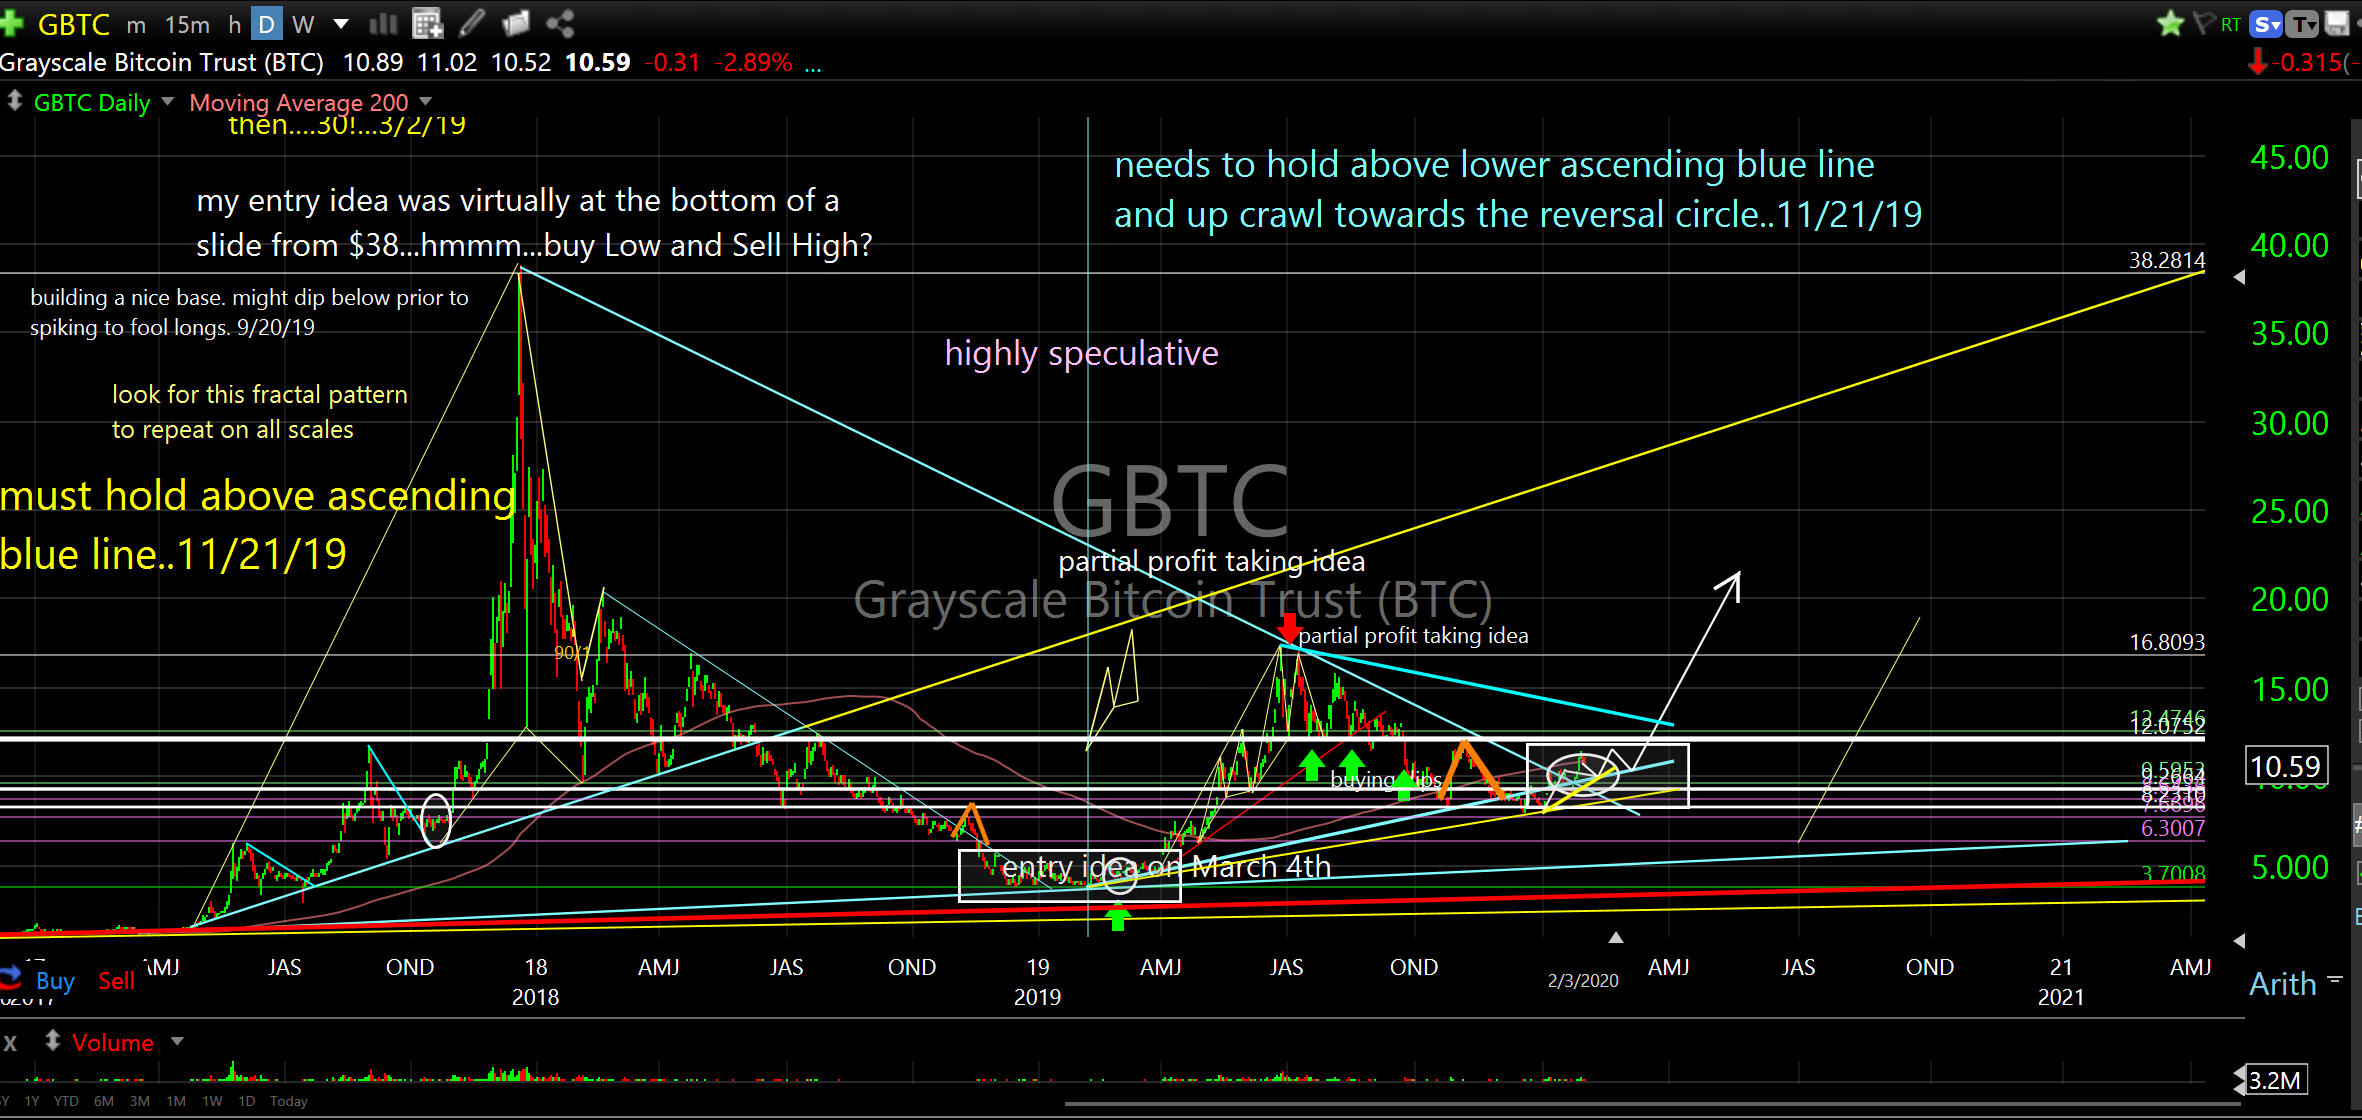
And, finally, the top-performing asset class of 2019 which I put on the Entry list on March 4, 2019 at virtually the beginning of a 200% ramp higher. If you missed out last year there could be another huge opportunity in the works. If it follows my model (price projections on charts) I will begin to add to current positions around mid-February when I expect the next low (around $10). See both the longer and shorter-term price charts.
Grayscale Bitcoin Trust (BTC) (GBTC)
2017-2021.5
Grayscale Bitcoin Trust (BTC) (GBTC)
March, 2019 to summer 2020

OK, one more. For those of you that can stand a little more risk check out Japan 3X leveraged.
Direxion Daily Japan Bull 3X Shares (JPNL)

There are certainly many more stocks that are positioned to rip during the 2020 expansion. During this part of the expansion, it’s more difficult to find stocks that will go down. I just can’t realistically list them all.
Also, remember, this is not investment advice. I don’t know your risk tolerance but the charts will help you analyze and manage your risk. Look at the historical changes in price. Look at the swings. While any stock can collapse quickly, the historical evidence is really the best way to gauge what might happen in the future.
Charting helps me. It helps me understand “If I’m not willing to be wrong, I’m not willing to be right. It’s ordinary to be wrong. It’s extraordinary to know when you are wrong“.
I’m happy to answer any questions you might have.
Don