The Dow and S&P 500 index were slightly up last week. The weekly chart of SPY, the ETF for the S&P 500 index, is certainly more bullish than bearish.
After the February sell off price had a short term bounce then slammed even lower in March followed by the last nine weeks of range narrowing higher prices. This is good.
S&P500 Index ETF (SPY) weekly
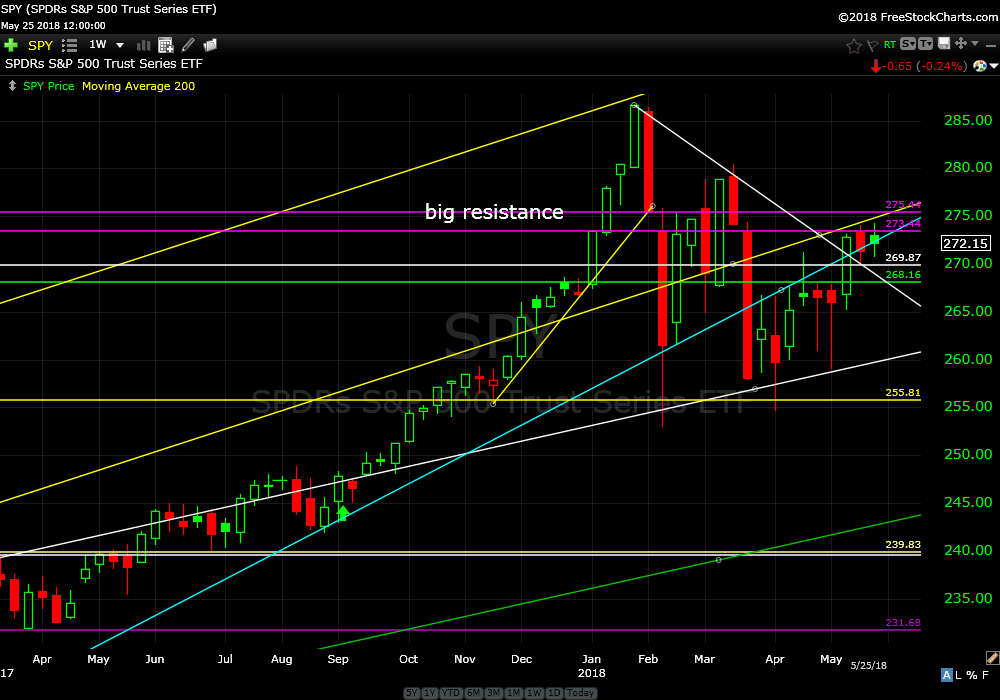
Current SPY resistance is 273.50 which is just above the opening prices for both of the big down weeks (Feb 5 and March 19).
Price action looks good. Narrowing range is good. Higher highs and higher lows is good. Testing and bouncing off support is good. Breaking up and out of a wedge is good. Continue to hold.
What’s not looking so good are bonds.
iShares Barclays Aggregate Bond Fund (AGG) monthly

AGG price has been range bound since 2010 and is currently at the lower end of that range after breaking rising support in late 2016. Breaking below 104 would likely bring lower prices and higher rates.
iShares Barclays 20+ Year Treasury Bond Fund (TLT) monthly
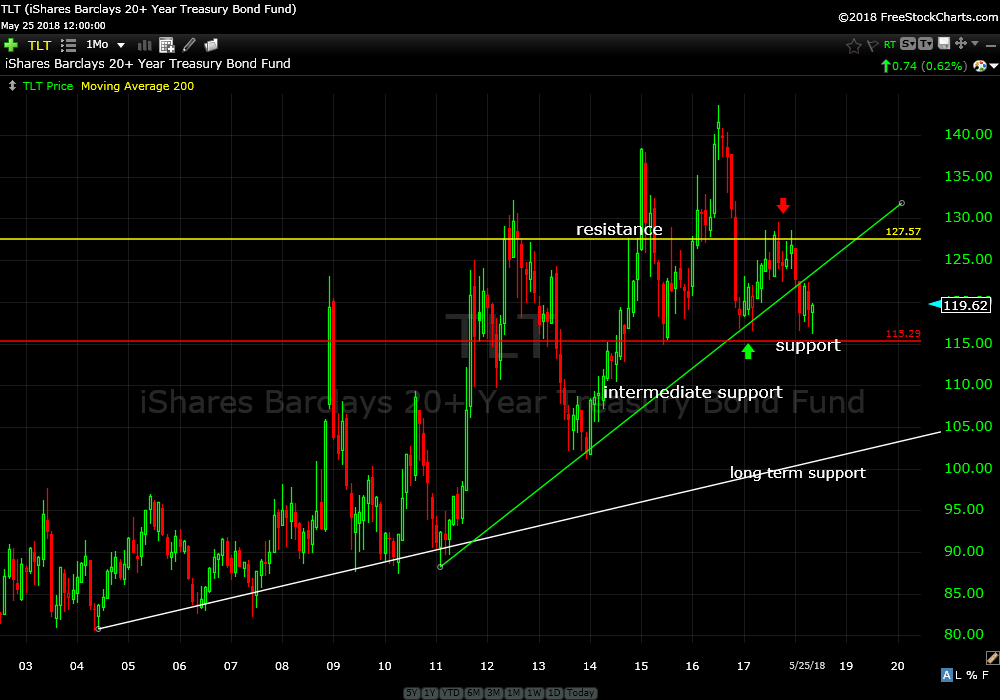
TLT broke below intermediate support earlier this year and is currently nearing a lower support level at 115. If price takes out 115 it is likely interest will spike and TLT will get sucked down to long term support. See monthly chart.
iShares Barclays 7-10 Year Treasury Bond Fund (IEF) monthly
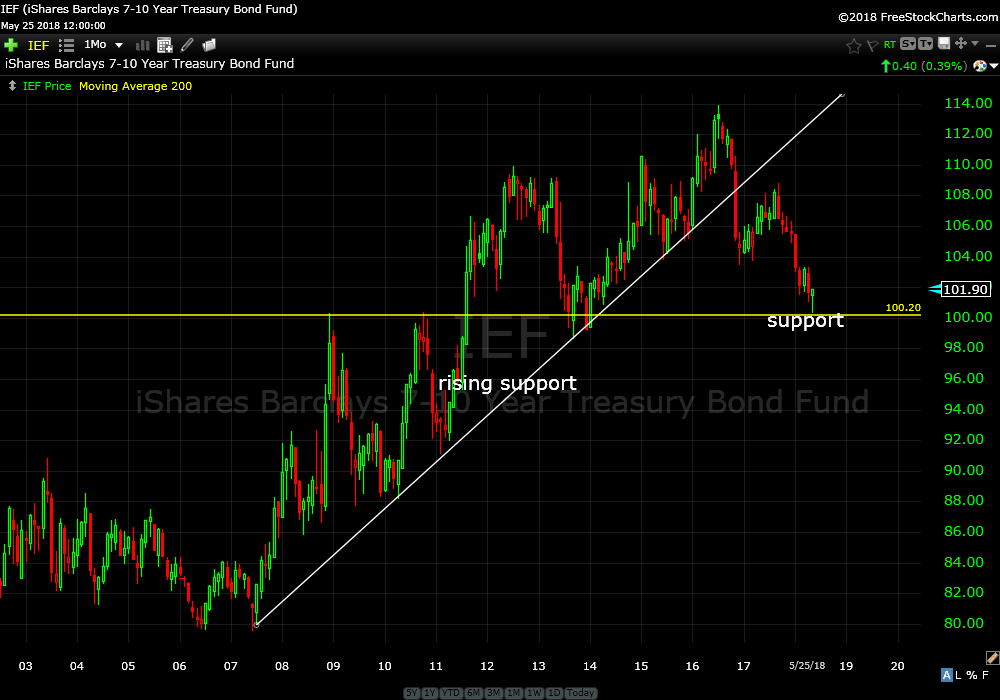
Rising support was broken late last year and now price has come down into a pretty important support area. If it starts trading under support downside momentum should build and rates will rise.
iShares IBoxx $ High Yield Corporate bond ETF (HYG) monthly
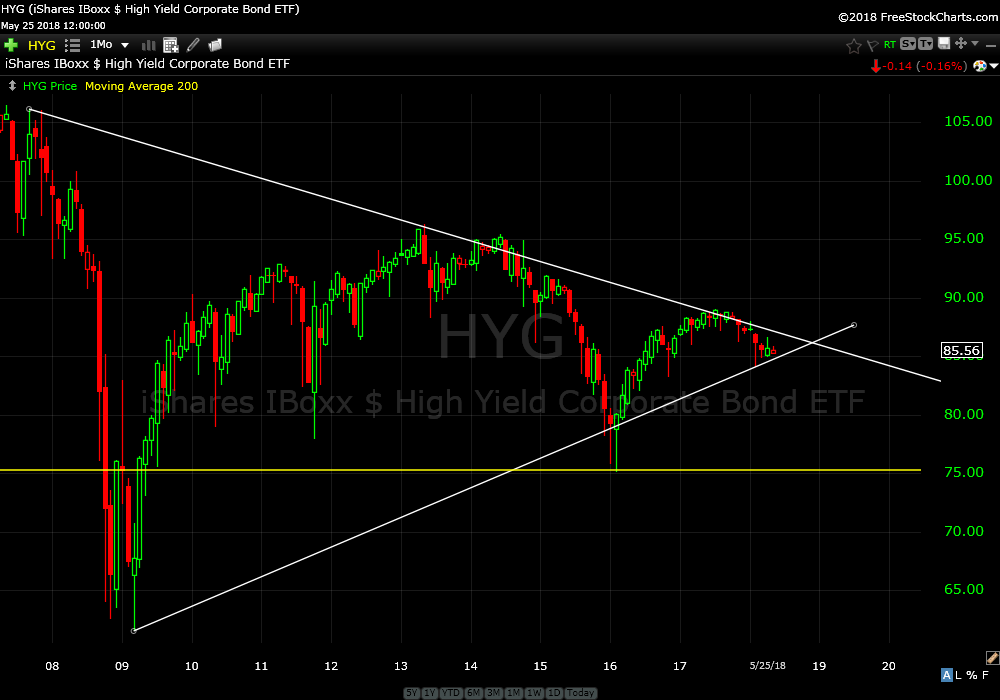
Price is about to break out of a wedge as resistance holds. Wedges are just compressing price pressure that usually result in big price moves…look out below.
Bond prices are still above a level we don’t want to see broken…just above puke zone.
All eyes should be on these bond levels.
Continue to hold open recommendations.
Have a great week.
Trade Smart,
Don