Broader Market Review
Major indexes continue to push higher with financials getting the rotation this week outperforming technology. The broader market continues to reveal strength by moving higher while many technology stocks get hammered into lower channel support corners to resume their cycle higher. Current price action in broader market, sectors, capitalization spectrum, individual stocks and yields appears to be lining up for the transition out of the 22 month recovery consolidation into momentum mode once the ascending yellow line resistance is taken out. When small caps release above their descending resistance, when financials release above their ascending resistance and tech stocks hook out of their shorter term descending channels this should just add fuel to broader market pressure to ramp higher. Once broader market price clears this overhead ceiling (ascending yellow line) it should build into support with short term choppy retesting to clear the way for a momentum run into and during most of 2020.
As I write this, mid day Friday, the broader market is weak. Hedge funds are likely beginning to short here again as we are nearing resistance. This will likely take the market down over the next couple of weeks. My estimation of depth is DIA 261.60 as we work our way into earnings and work off recent gains before reversing higher. Remember, reversal projections are probabilities. The bottom line is that the broader market is slowly vectoring higher working its way in and out of different linear degree and time period channels. Once price releases above ascending yellow line resistance it should align with the channel angle of the pink arrow. Remember, these are projected, measurable probabilities not predictions. Maybe it’s predictive modelling?
Below are two slightly different looks at The Dow Jones Industrial Average ETF (DIA). Please see notes on charts.
SPDR Dow Jones Industrial Average ETF (DIA) daily

SPDR Dow Jones Industrial Average ETF (DIA) daily

Charting Channels
While there are many aspects of charting, one of the most important is in identifying channels. This is the most basic building block of dressing a chart. I always begin building a chart using all historical data available and start with the longest term channels and progress to shorter time periods. Long term channels are stronger than short term channels. Long term channels can identify major economic cycles, historic broader market turning points, recessions, and expansions. Shorter-term channels help identify probable reversal zones inside of the primary, long term channel (trend). Shorter-term channels can also help identify when a long term channel (trend) is violated and the price is undergoing a major reversal. Channel reversals usually result in a reflective channel angle and length.
Equity and debt instruments mostly run in linear, parallel channels. The channels are of various degrees and time periods (decades to minutes) and either ascending, descending or sideways. Channels expand, compress, reflect and reverse in ways that are highly measurable. Part of the challenge of price discovery/valuation (oversold/undersold/
When correctly identified we find multi time frame reversal zones that are low risk/high reward. These reversal zones enhance the probability of buying low and selling high to align with risk and time horizon. These are identified by finding channel intersections by using measurements that occur frequently, consistently and correlate well with current events.
This does not mean price action is always linear. It is not. There are many other factors to consider when charting but understanding channels is certainly a good place to start. When you look at one of my dressed charts I’m sure it can be very confusing. That is perfectly normal as most people haven’t even been exposed to technical analysis let alone how I do it. This type of analysis is not taught anywhere. It’s not taught in schools, on Wall Street, not even in technical analysis groups. So, it’s no wonder people get this glazed look over their face when I tell them what I do or even worse when I show them what I do. I think it challenges people’s existing framework of accepted knowledge.
In short, charting channels can reveal both absolute and relative valuations. Charting can identify precise turning points in public equity and debt instruments. Charting can help identify macro and micro economic cycles, recessions, and expansions. Charting can help identify shorter-term cycles within longer-term cycles. Charting can help reduce the subjective nature of making investment decisions. Charting can reveal future, measurable probabilities with astonishing accuracy. For me, charting is almost magical.
But, trust me, I can still screw it up. It’s not perfect. Some channels go on much longer than expected and some don‘t. Anything can happen at any time. The future is uncertain. Risk exists. Valuation, direction, momentum, conditions, tweets, world events are all difficult to foresee…therefore I chart and try, as difficult as it is, to eliminate my subjective conclusions.
It would probably be best if I just charted with no commentary. The lines that create channels on a chart are objective. My goal is and continues to be the same; for you to draw your own conclusions. Review charts below and take any subjective commentary with appropriate grains of salt.
Interesting Chart Channels and Potential Low Risk/High Reward Reversals
The following charts caught my eye this week. While some are closer to reversal positioning than others they all are worth studying. The broader market seems to be beginning another dip which will impact most names but I’m adding these to my growing “short list” as they are positioning themselves into “launch ready”.
By the way, “launch ready” is when the broader market releases above ascending yellow line resistance, re-tests during transition to support and then begins to march higher. This should align with financials and technology breaking above resistance, weakening volatility, gold drifting lower and yields slowly floating higher.
Workday, Inc (WDAY) weekly

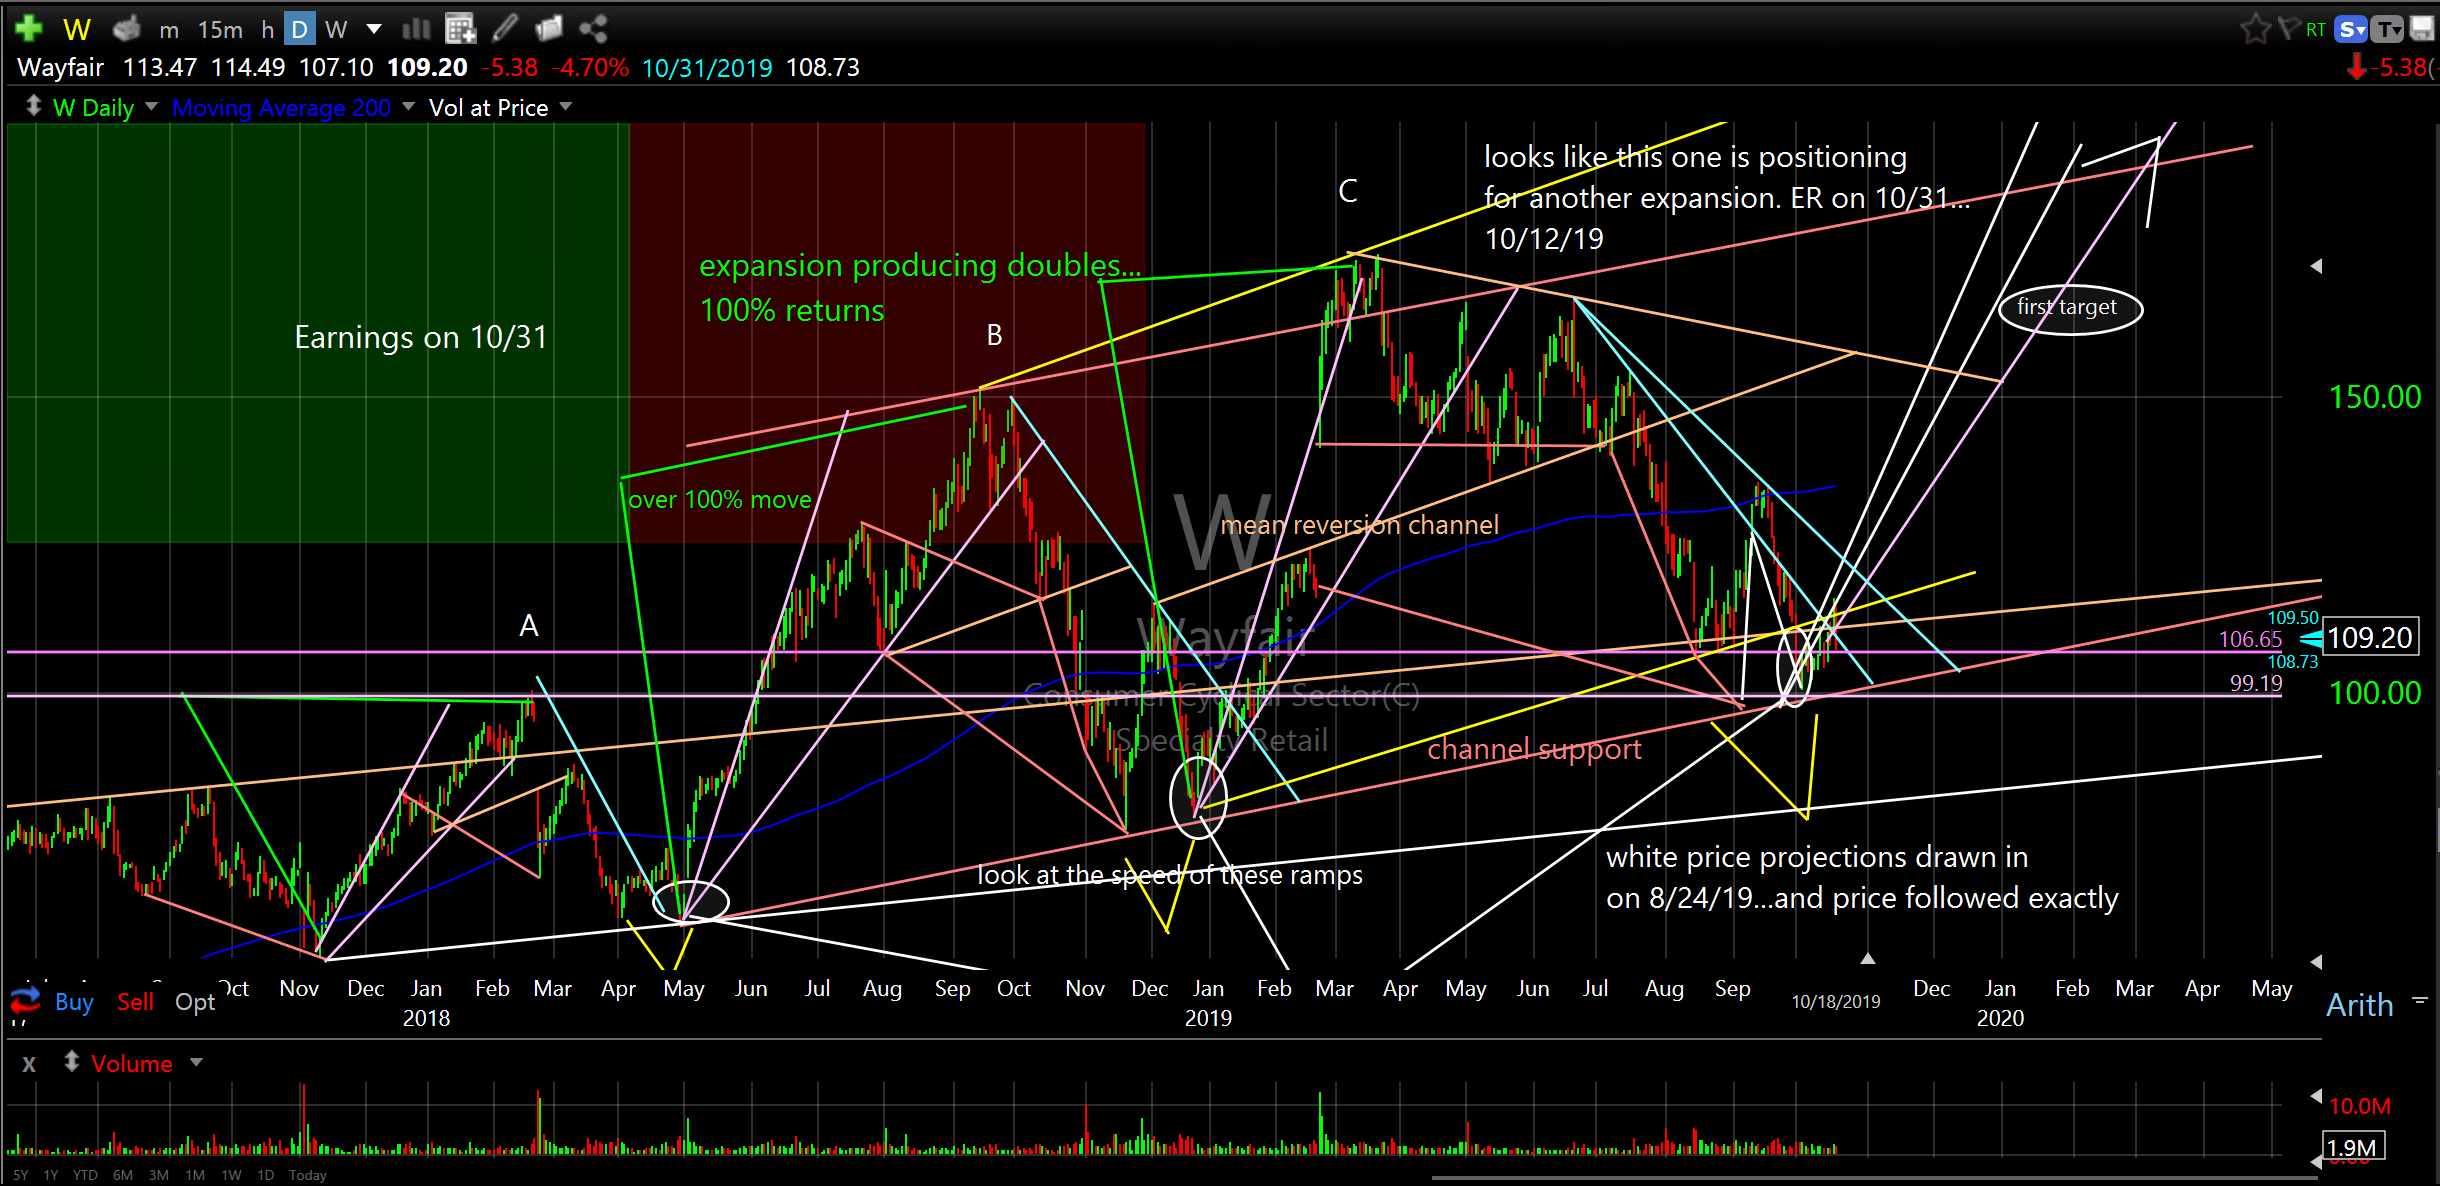
Wayfair (W) daily
Zscaler Inc (ZS) daily

Zendesk Inc (ZEN) daily

Tesla Inc (TSLA) weekly

Democratizing Wall Street,
Don