Happy Labor Day,
Historical hard evidence points to a robust expansion in stocks for 2020 NOT a recession caused collapse as the media would have you believe. Read on…and…if you are new, I will share with you information that will (should) blow your mind. Evidence about how the stock market really works that 99.9% of people do not understand because they haven’t spent the time studying raw historical price data. There is a reason I have had only one subscriber cancellation in the past four years.
Short Term Outlook
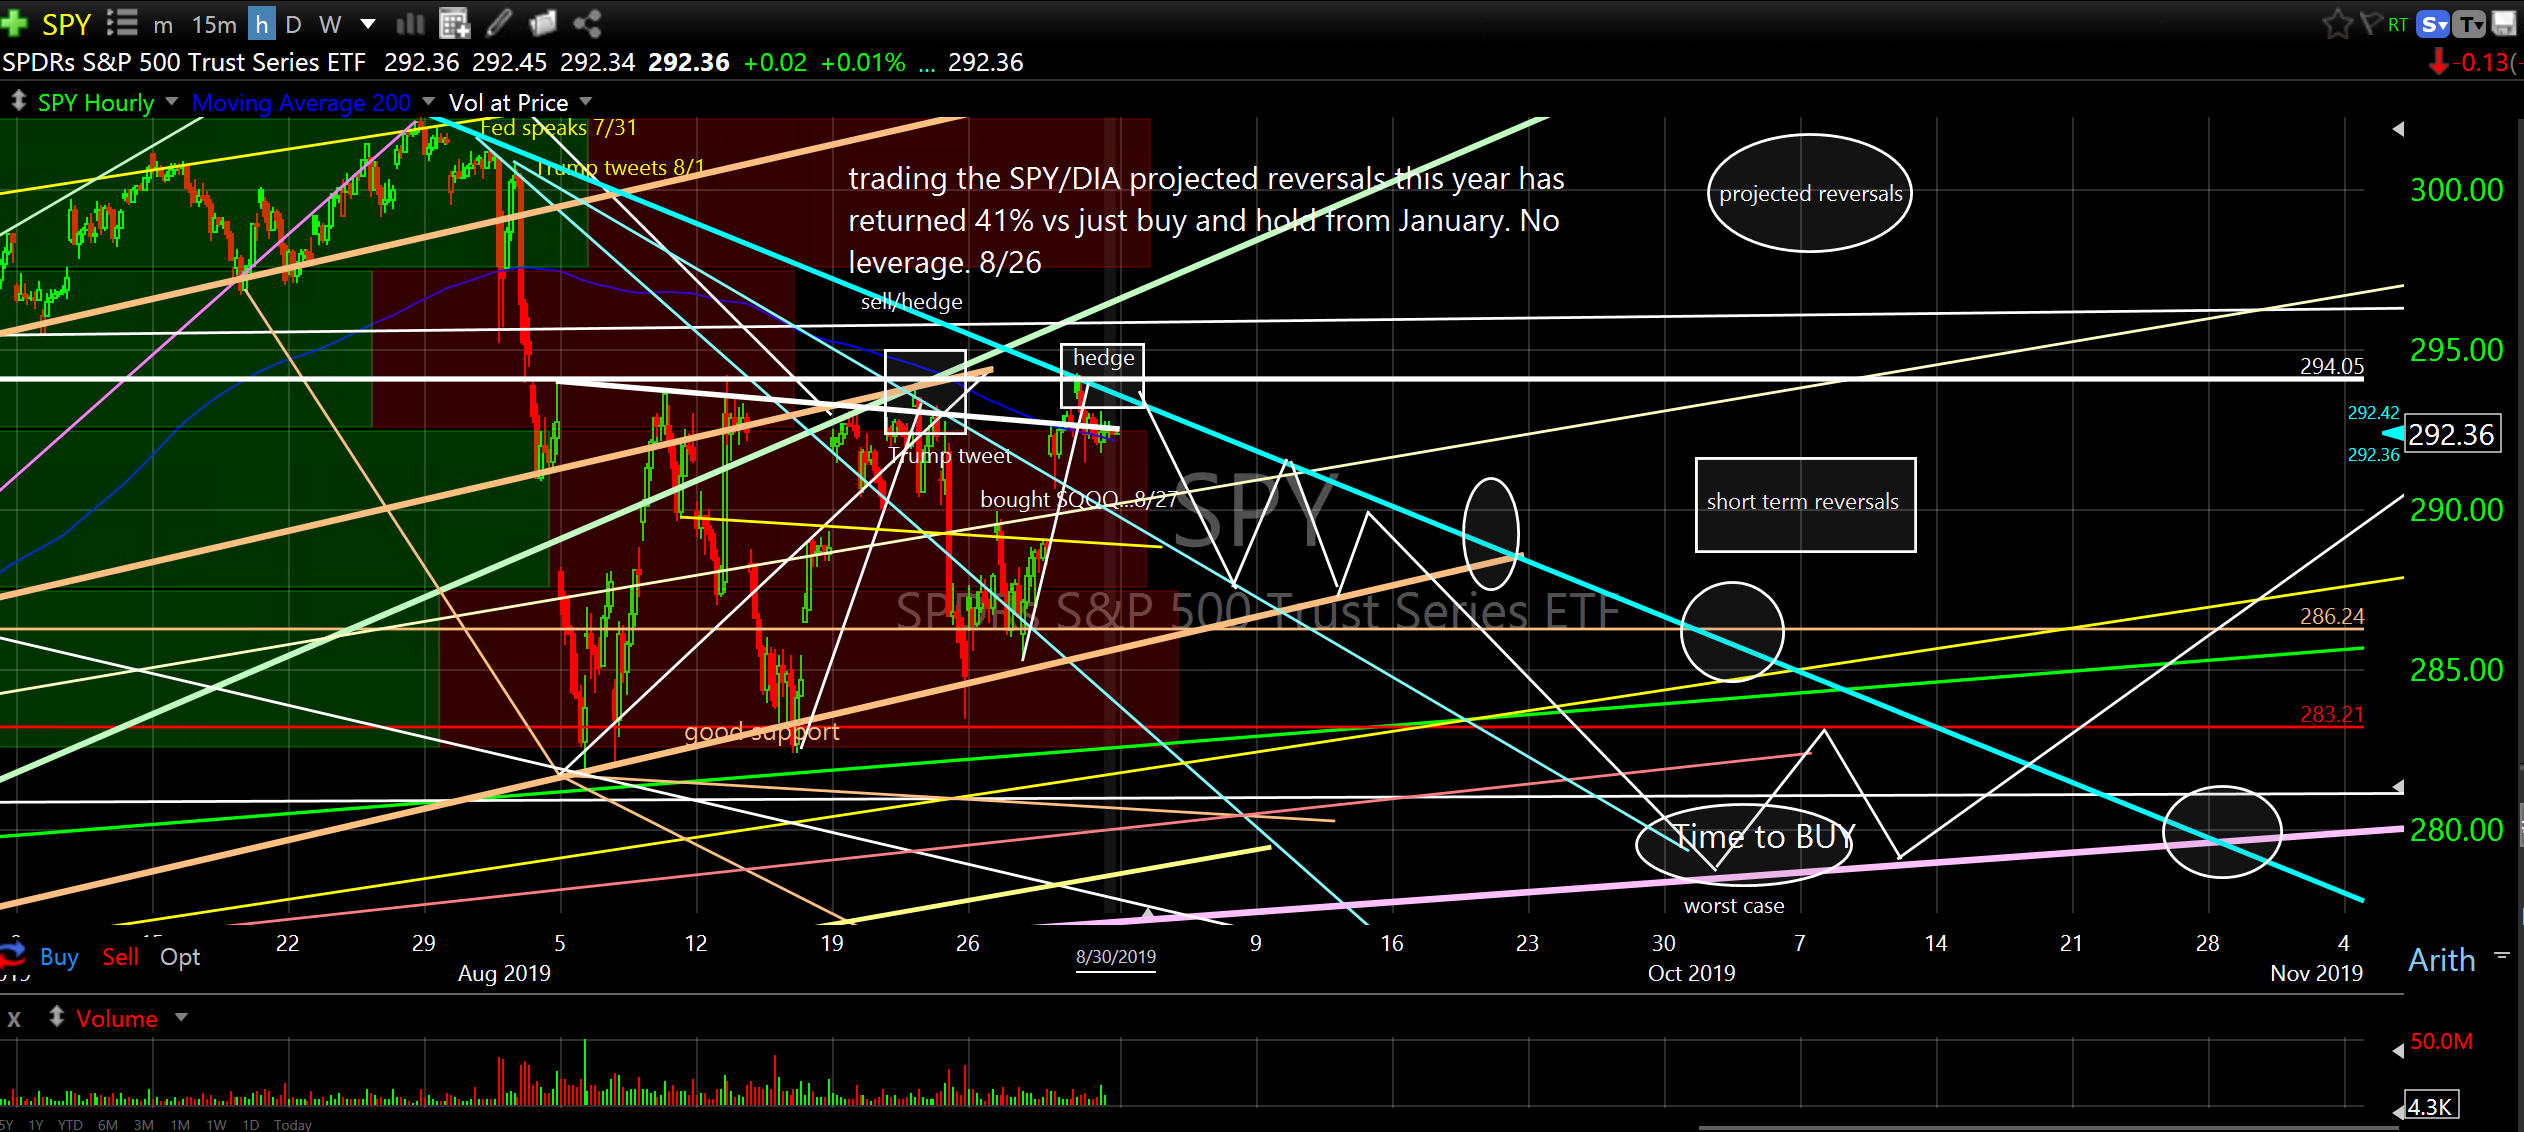
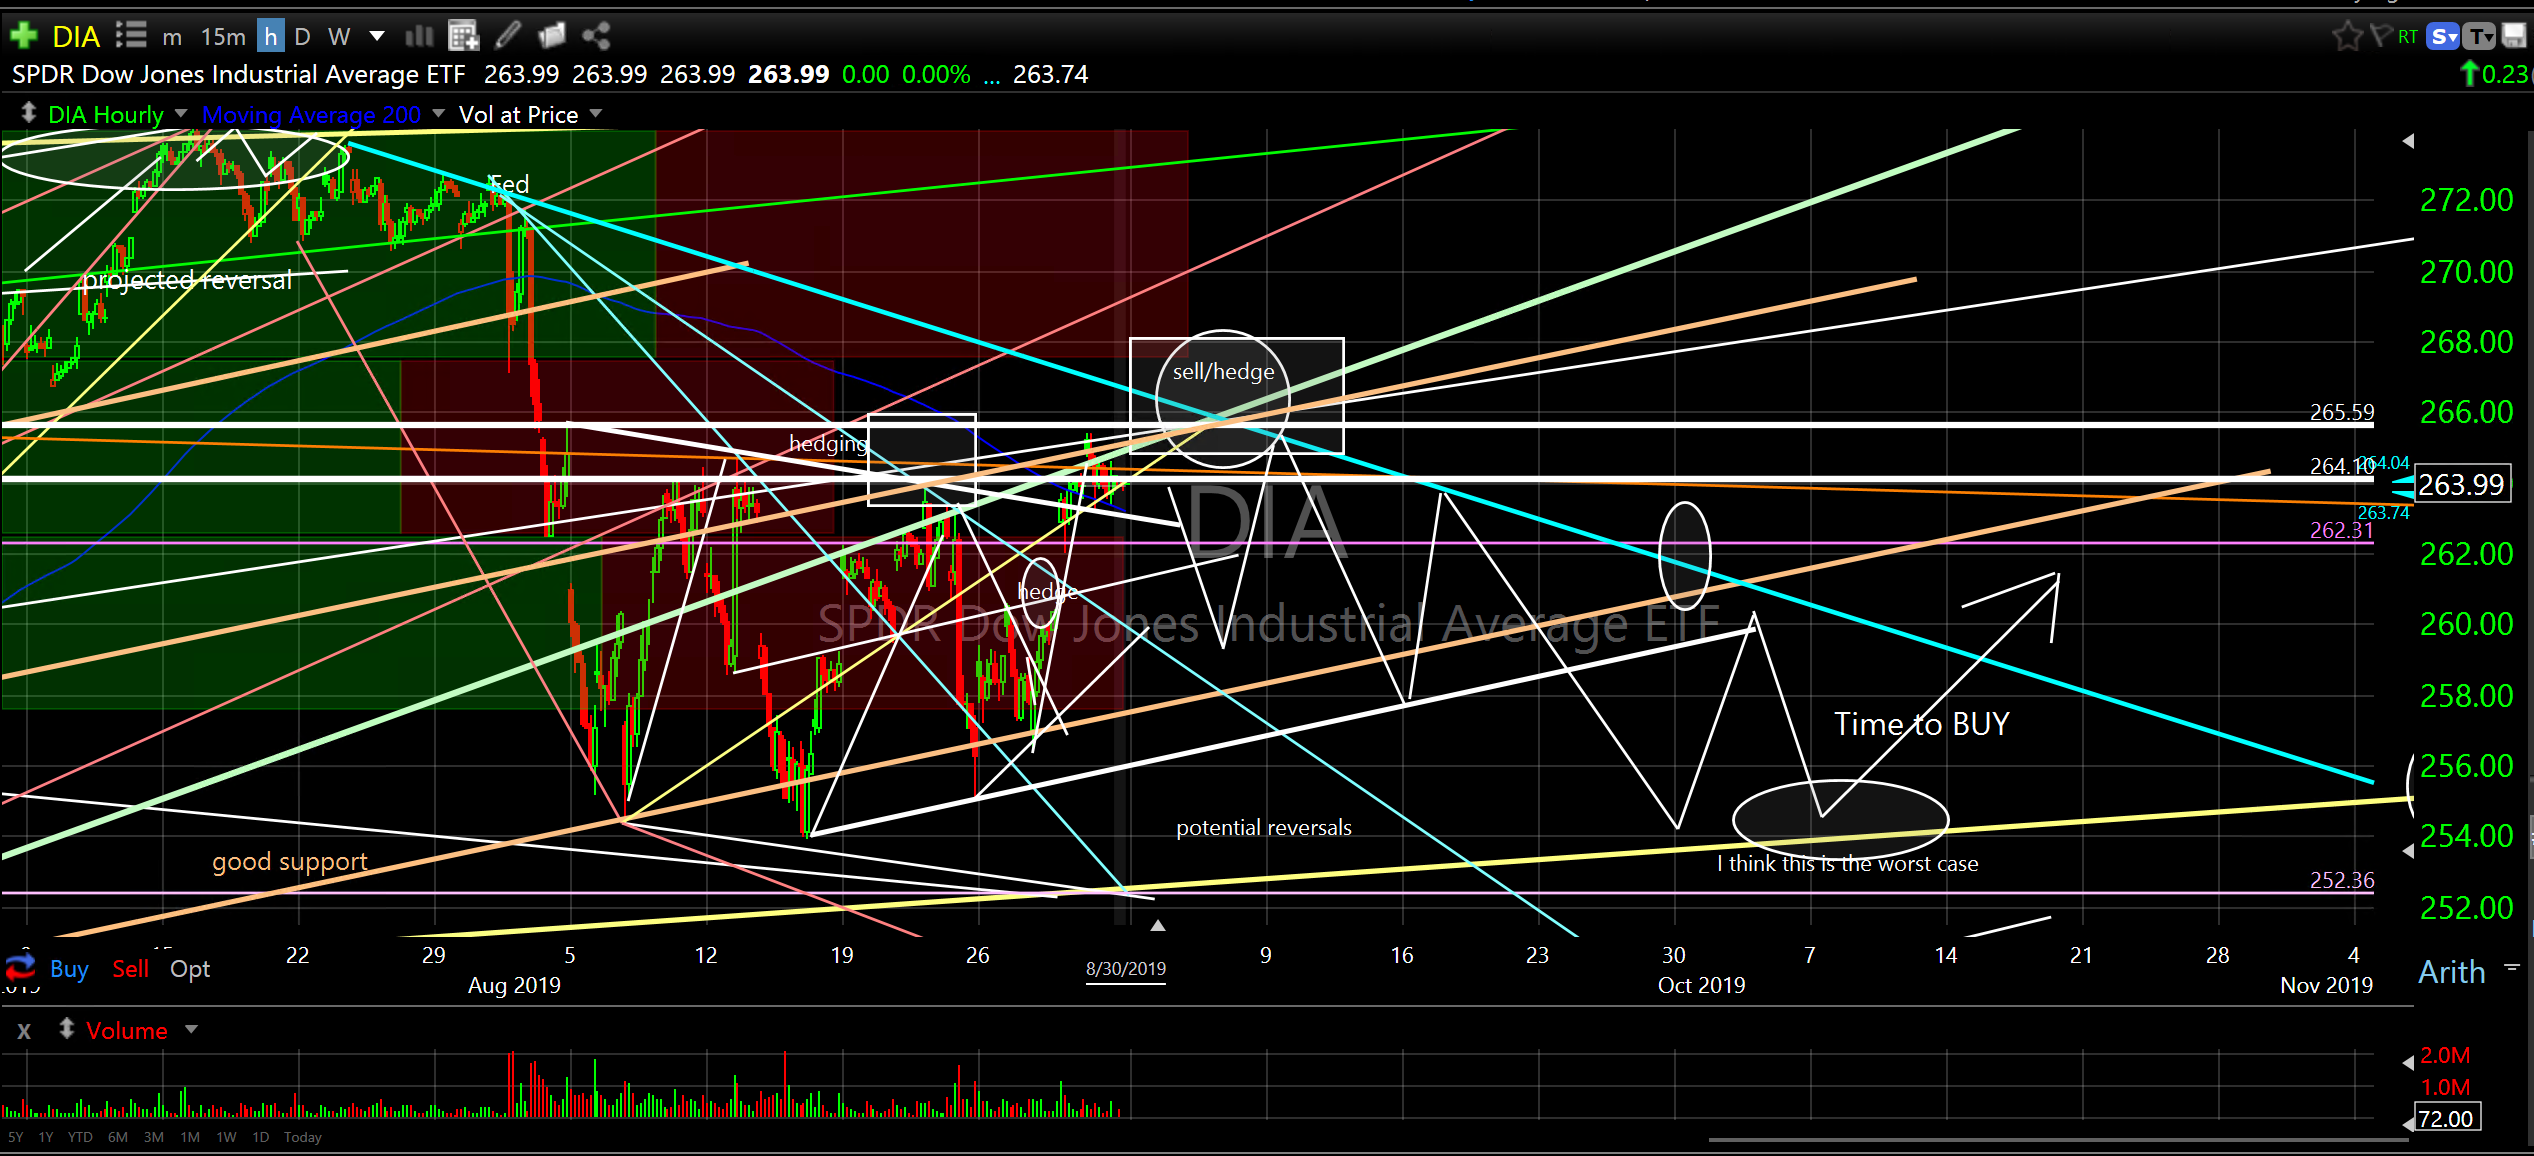
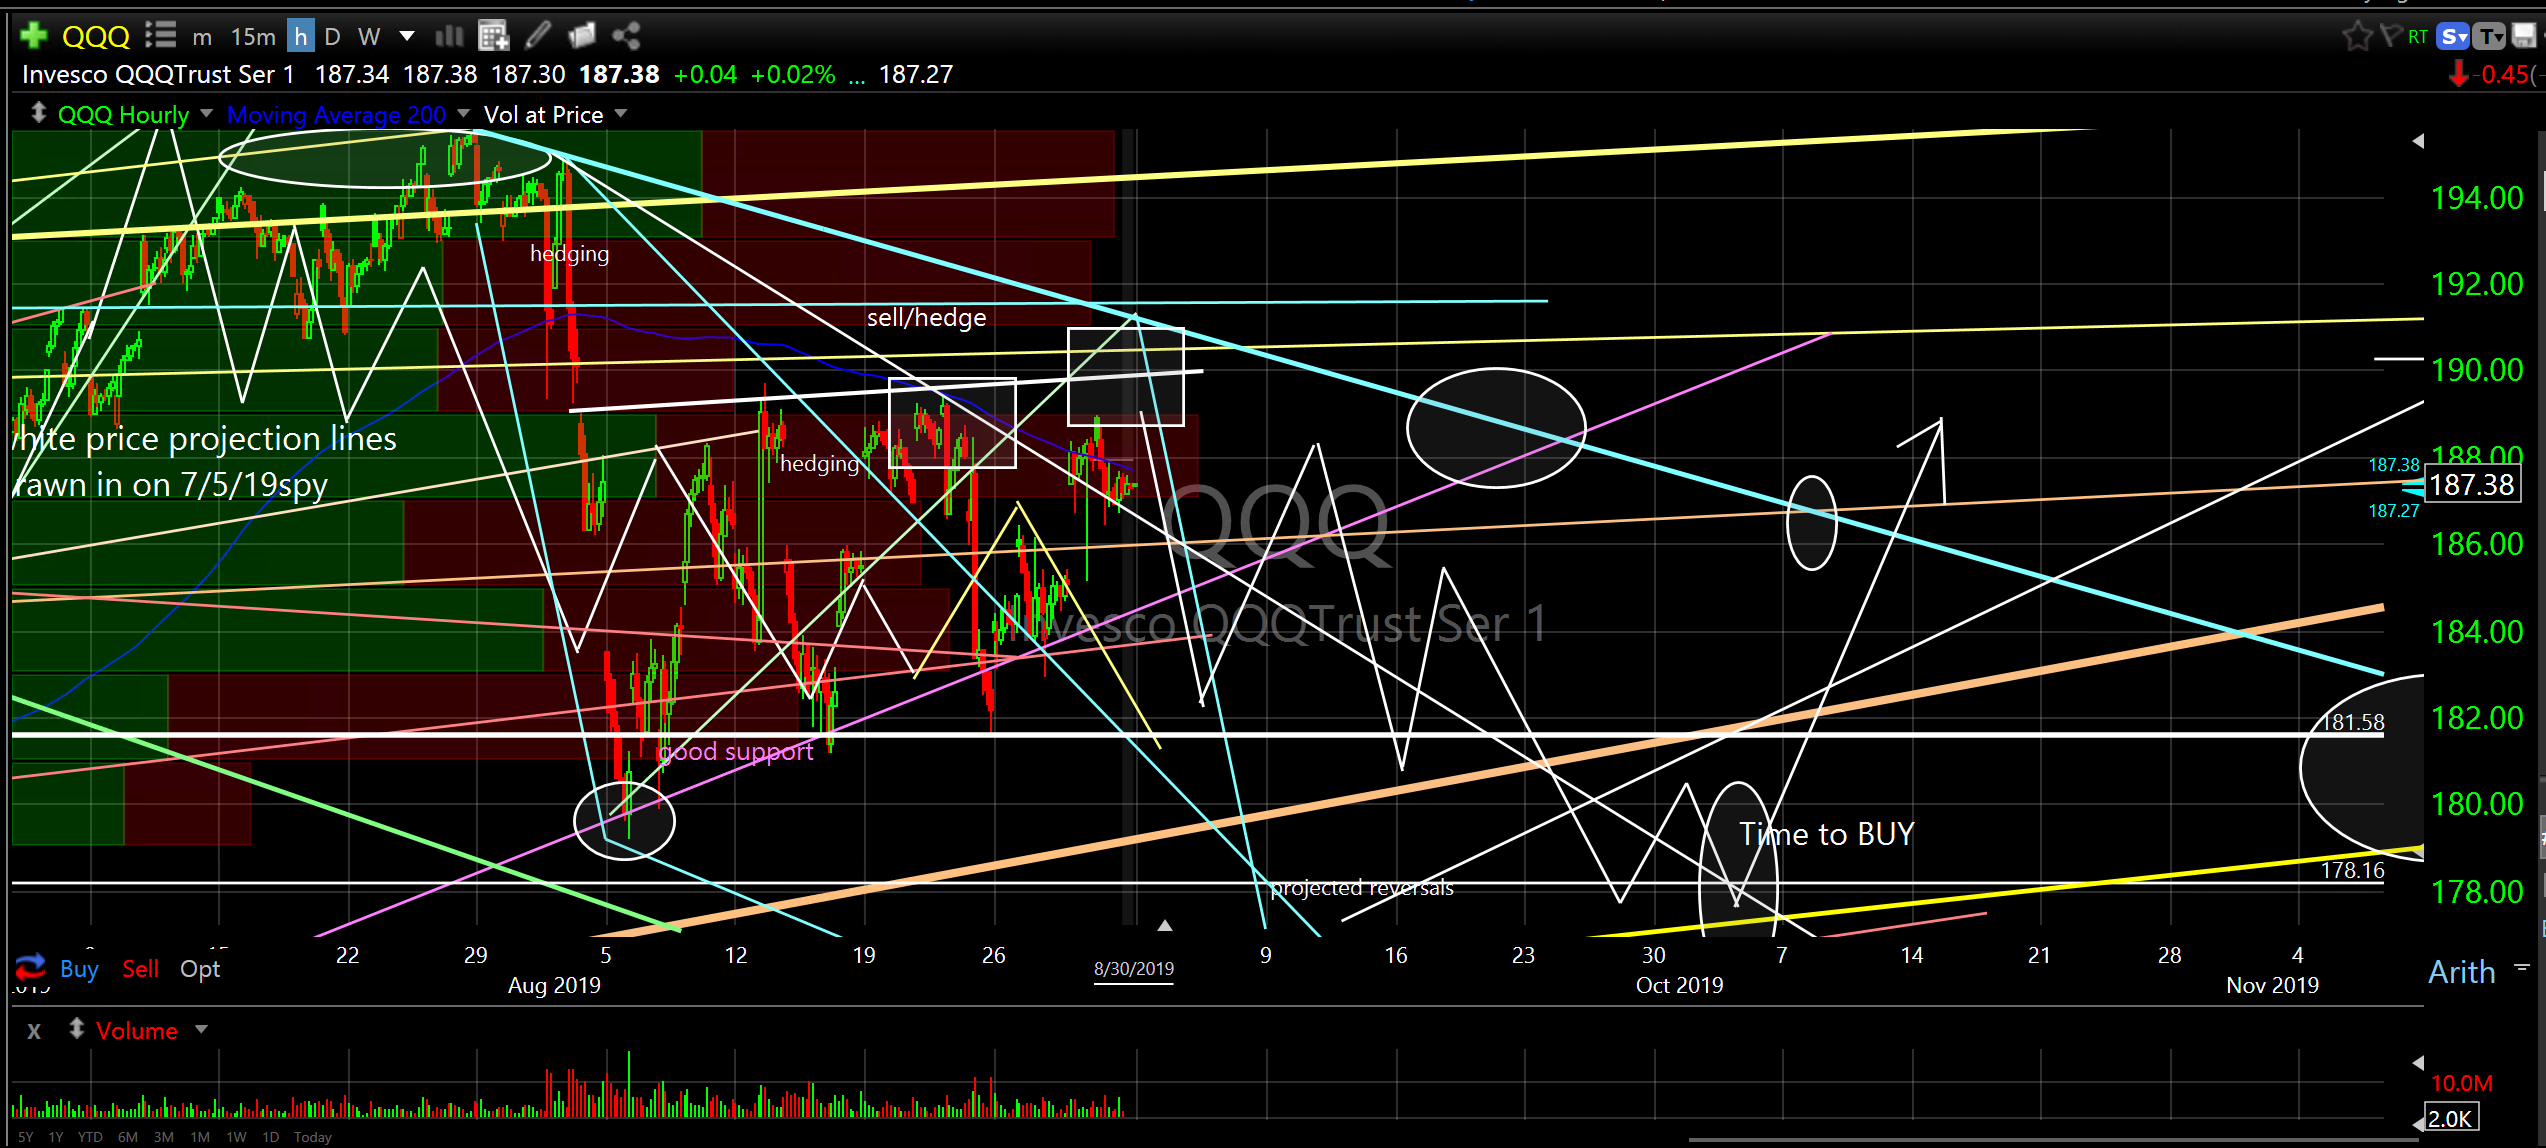
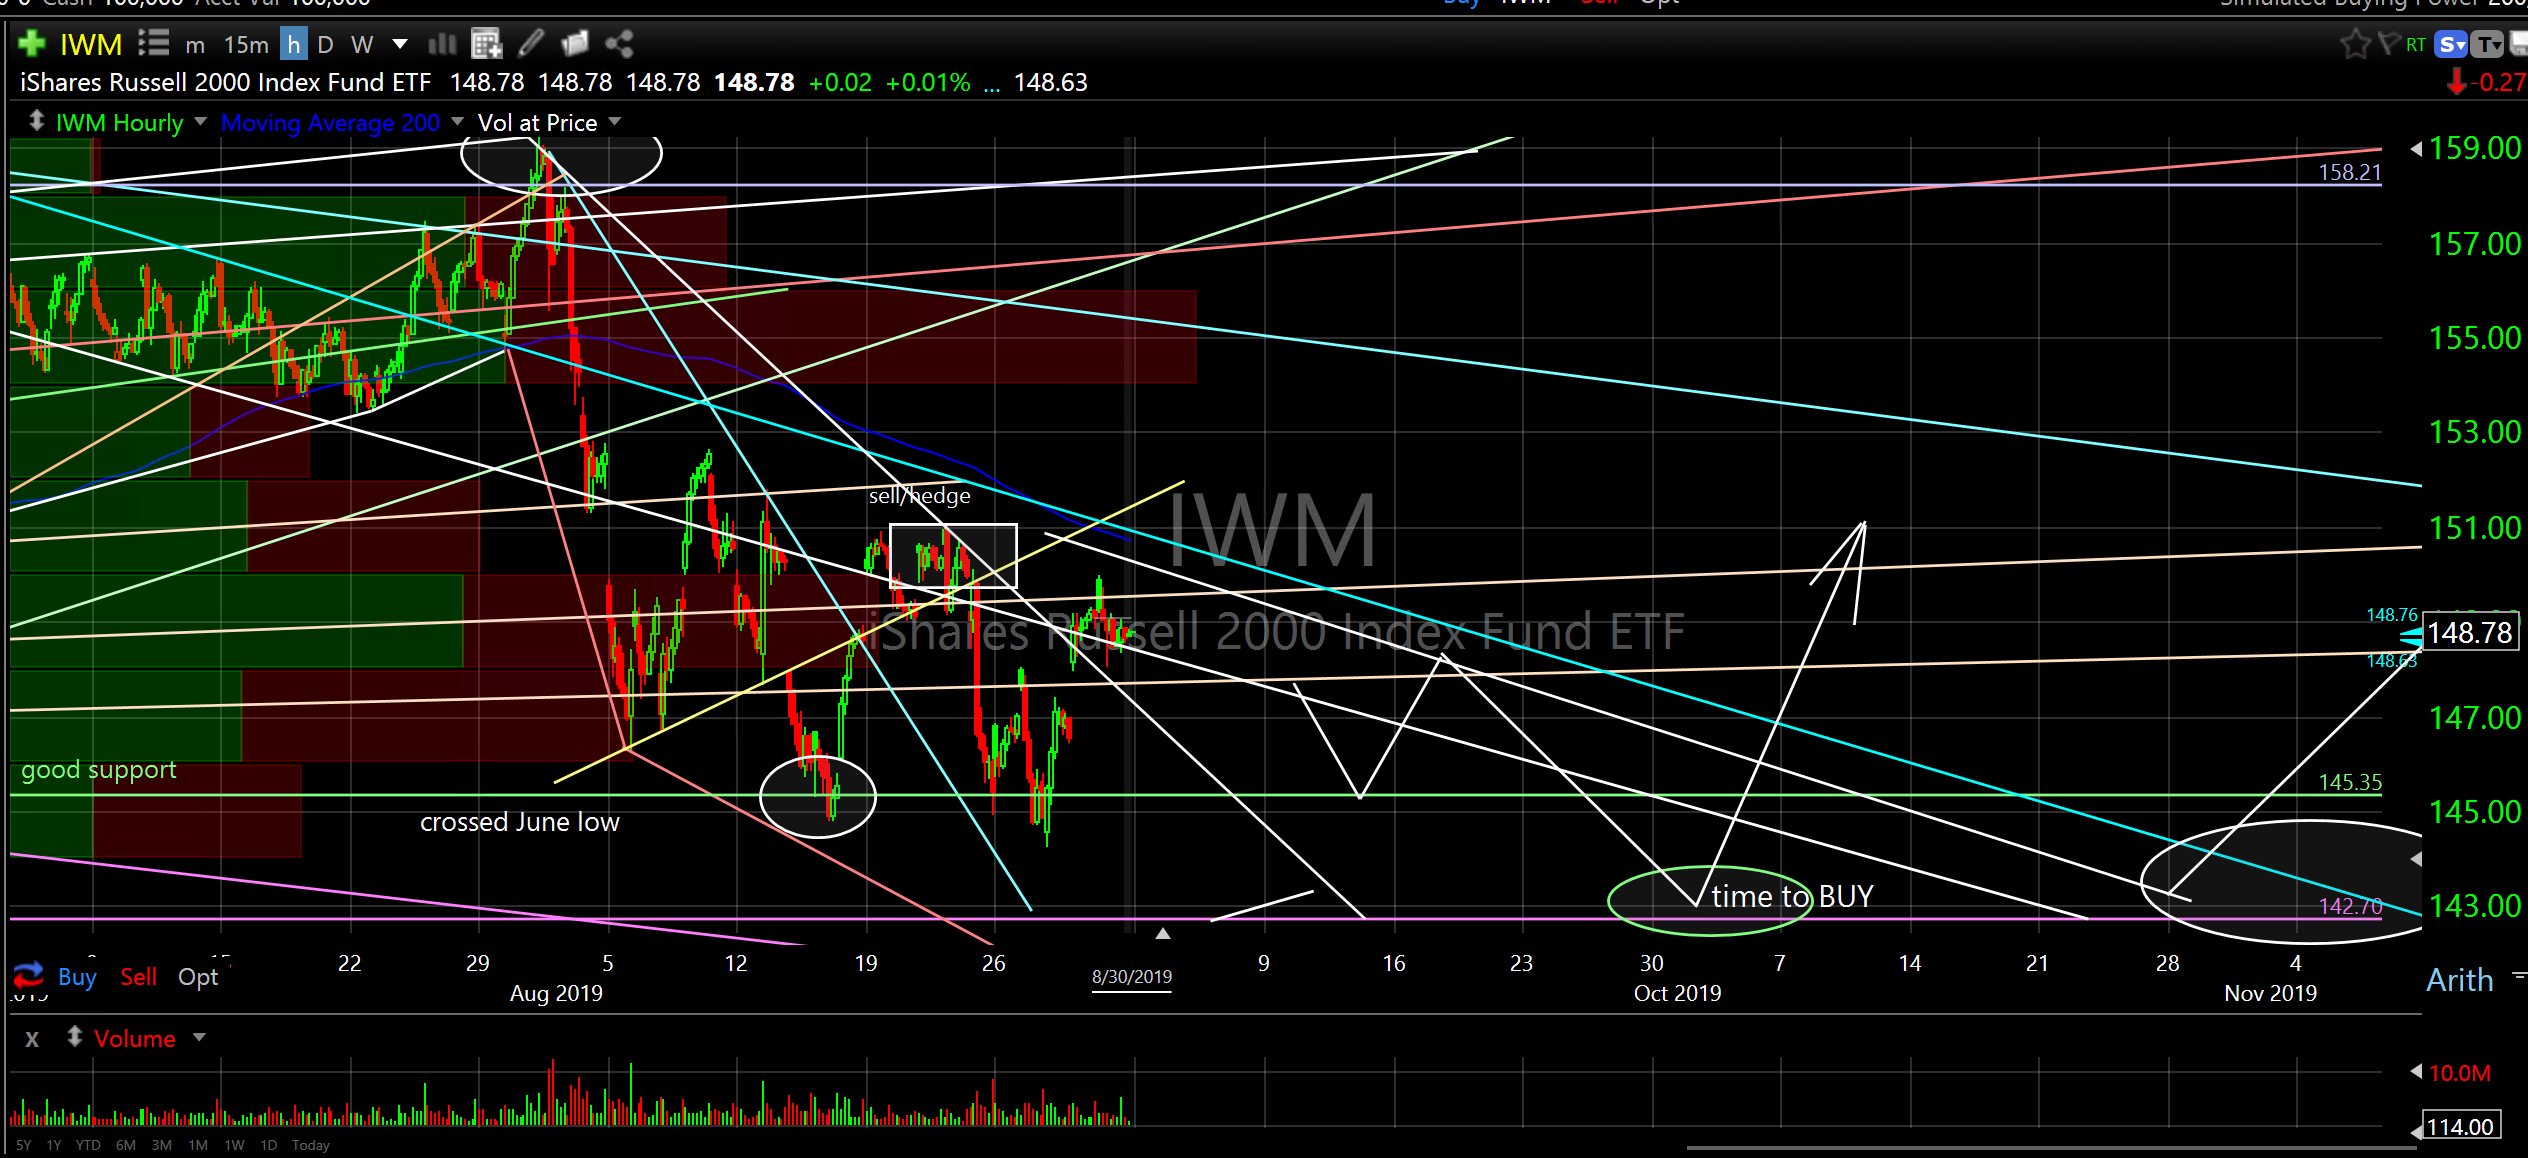
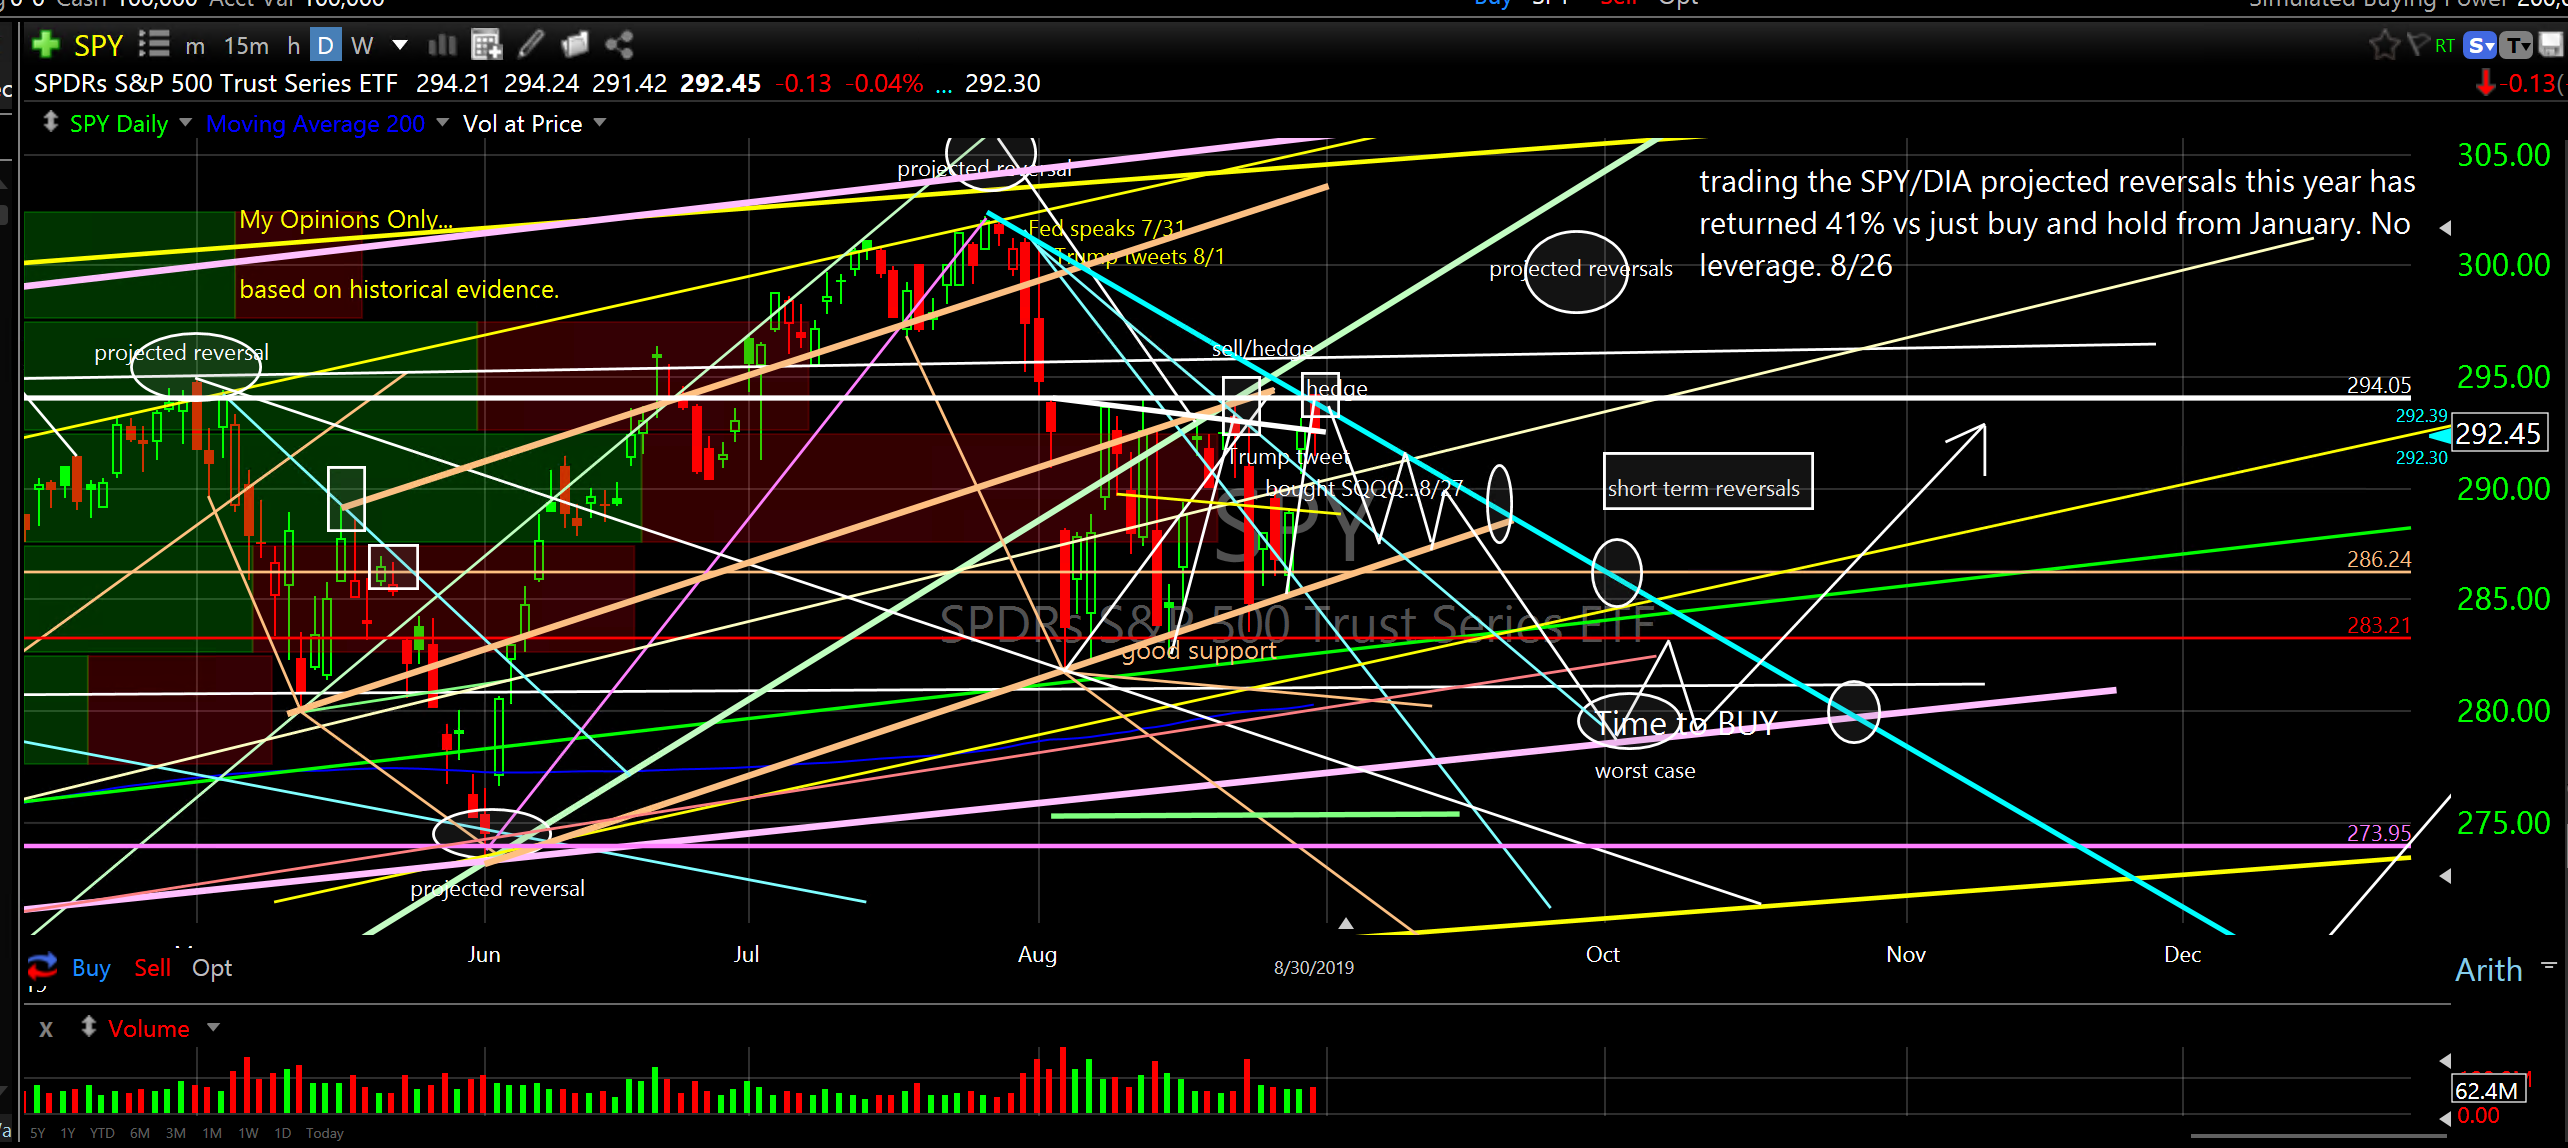
Last week the broader market traded back up into descending, short term resistance from the late July high. This is where the short sellers have been getting aggressive during this current summer dip projection I shared with you (see charts). By the way, the four projected large broader market reversals I shared this year were almost exactly to the day and price BEFORE THEY HAPPENED (see charts). If they can’t sell it down from here they will get squeezed and we will trade up to higher resistance short term. My expectation is continued volatility with a downward bias for a few weeks (seasonally weak and many individual instruments don’t appear to have finished their bottoming/reversing higher process), however, it looks like the broader market is very close to expanding again. We might get as low as SPY 280, DIA 255, QQQ 178 and IWM 143 before the reversal higher begins. I don’t think we are going any lower than these price zones (we may not even get there) and I still believe once this low is put in we are off to the races. It might be a mudder for a couple of months and it won’t likely be a straight up affair but volatility should decrease over the next few months and 2020 should be a smoother and steeper climb, much like 2017. See charts for detail price action/past and future price reversal projections.
SPDR’s S&P 500 Trust Series ETF (SPY) hourly
SPDR Dow Jones Industrial Average ETF (DIA) hourly
Invesco QQQ TrustSer 1 (QQQ) hourly
iShares Russell 2000 Index Fund ETF (IWM) hourly
…usually follows large cap quality higher.
Planning for the 2020 Expansion
I expect a robust expansion during 2020. Don’t listen to the media recession/yield inversion talk (way too early). I am working on reducing open positions to around 15 to 25 for better concentration, exiting positions that are a drag/unlikely to outperform and adding the best positioned, lowest risk/highest reward companies/ETF’s that are nearing their expansionary cycle. I plan to share these over the next four to six weeks. We should also be able to swing trade many of these positions during 2020 to get the most out of them, much like we have done with recent trades. see below.
If you want to own equities and participate in the 2020 expansion but don’t want the unsystematic risk of owning individual companies then you should probably own ETF’s that track indexes, sectors and sub sectors, etc. Price action in large ETF’s is generally “smoother” than owning an individual stock due to diversification even though the broader market influences most every publicly traded instrument. Personally, I like to own ETF’s and individual stocks but I think this is just a matter of one’s personal risk tolerance, experience or mandate.
It has been a difficult market since early 2018 with consolidation sideways and a slight tilt up digesting the gains from early 2016. It will be good to get this period of time behind us and once price does break out of the current range from early 2018 it should move fast (historically common) so we need to be prepared. A final larger dip could actually be a good thing as price/sentiment will get stretched like a trampoline to bounce the market back up to the previous high end of the 18 month consolidation range with enough momentum to break up through the ceiling and scare the short sellers to cover and go hide under a big rock (good riddance). This will free the market to expand for many months to come in my opinion.
Hard Evidence
There are many individual stocks that appear to be positioning down near their individual support levels (every instrument has its own expansion/collapse cycle), yields are near historic support (cheap money) , bonds are positioned near resistance, volatility instrument spikes are spaced to begin unwinding and January/February are seasonally the start of expansion season (all covered in recent research notes). In addition, it is extremely common for expansions to correct down to their mid point (50% retracement) before beginning another cycle higher. If you look at the broader market expansion from early 2016 to early 2018 the December 24, 2018 low was almost exactly a 50% retracement of that expansionary period so it appears we have that box to check off as well. All of the ingredients are gathering for what appears to be a very strong upcoming year. Ladies and gentlemen, start your engines and turn off your TV’s.
41% Return on Reversals and Most Recent Trades
Please note as well you can trade the broader market projected reversals with SPY, DIA, QQQ or many other inverse and/or 2X/3X instruments. This year alone, without leverage, has returned +41% vs market performance of +16%. Once we bottom and begin expanding I would discourage any short positions however. See daily SPY and DIA charts below to see shared 2019 projected reversals.
SPDR’s S&P 500 Trust Series ETF (SPY) daily
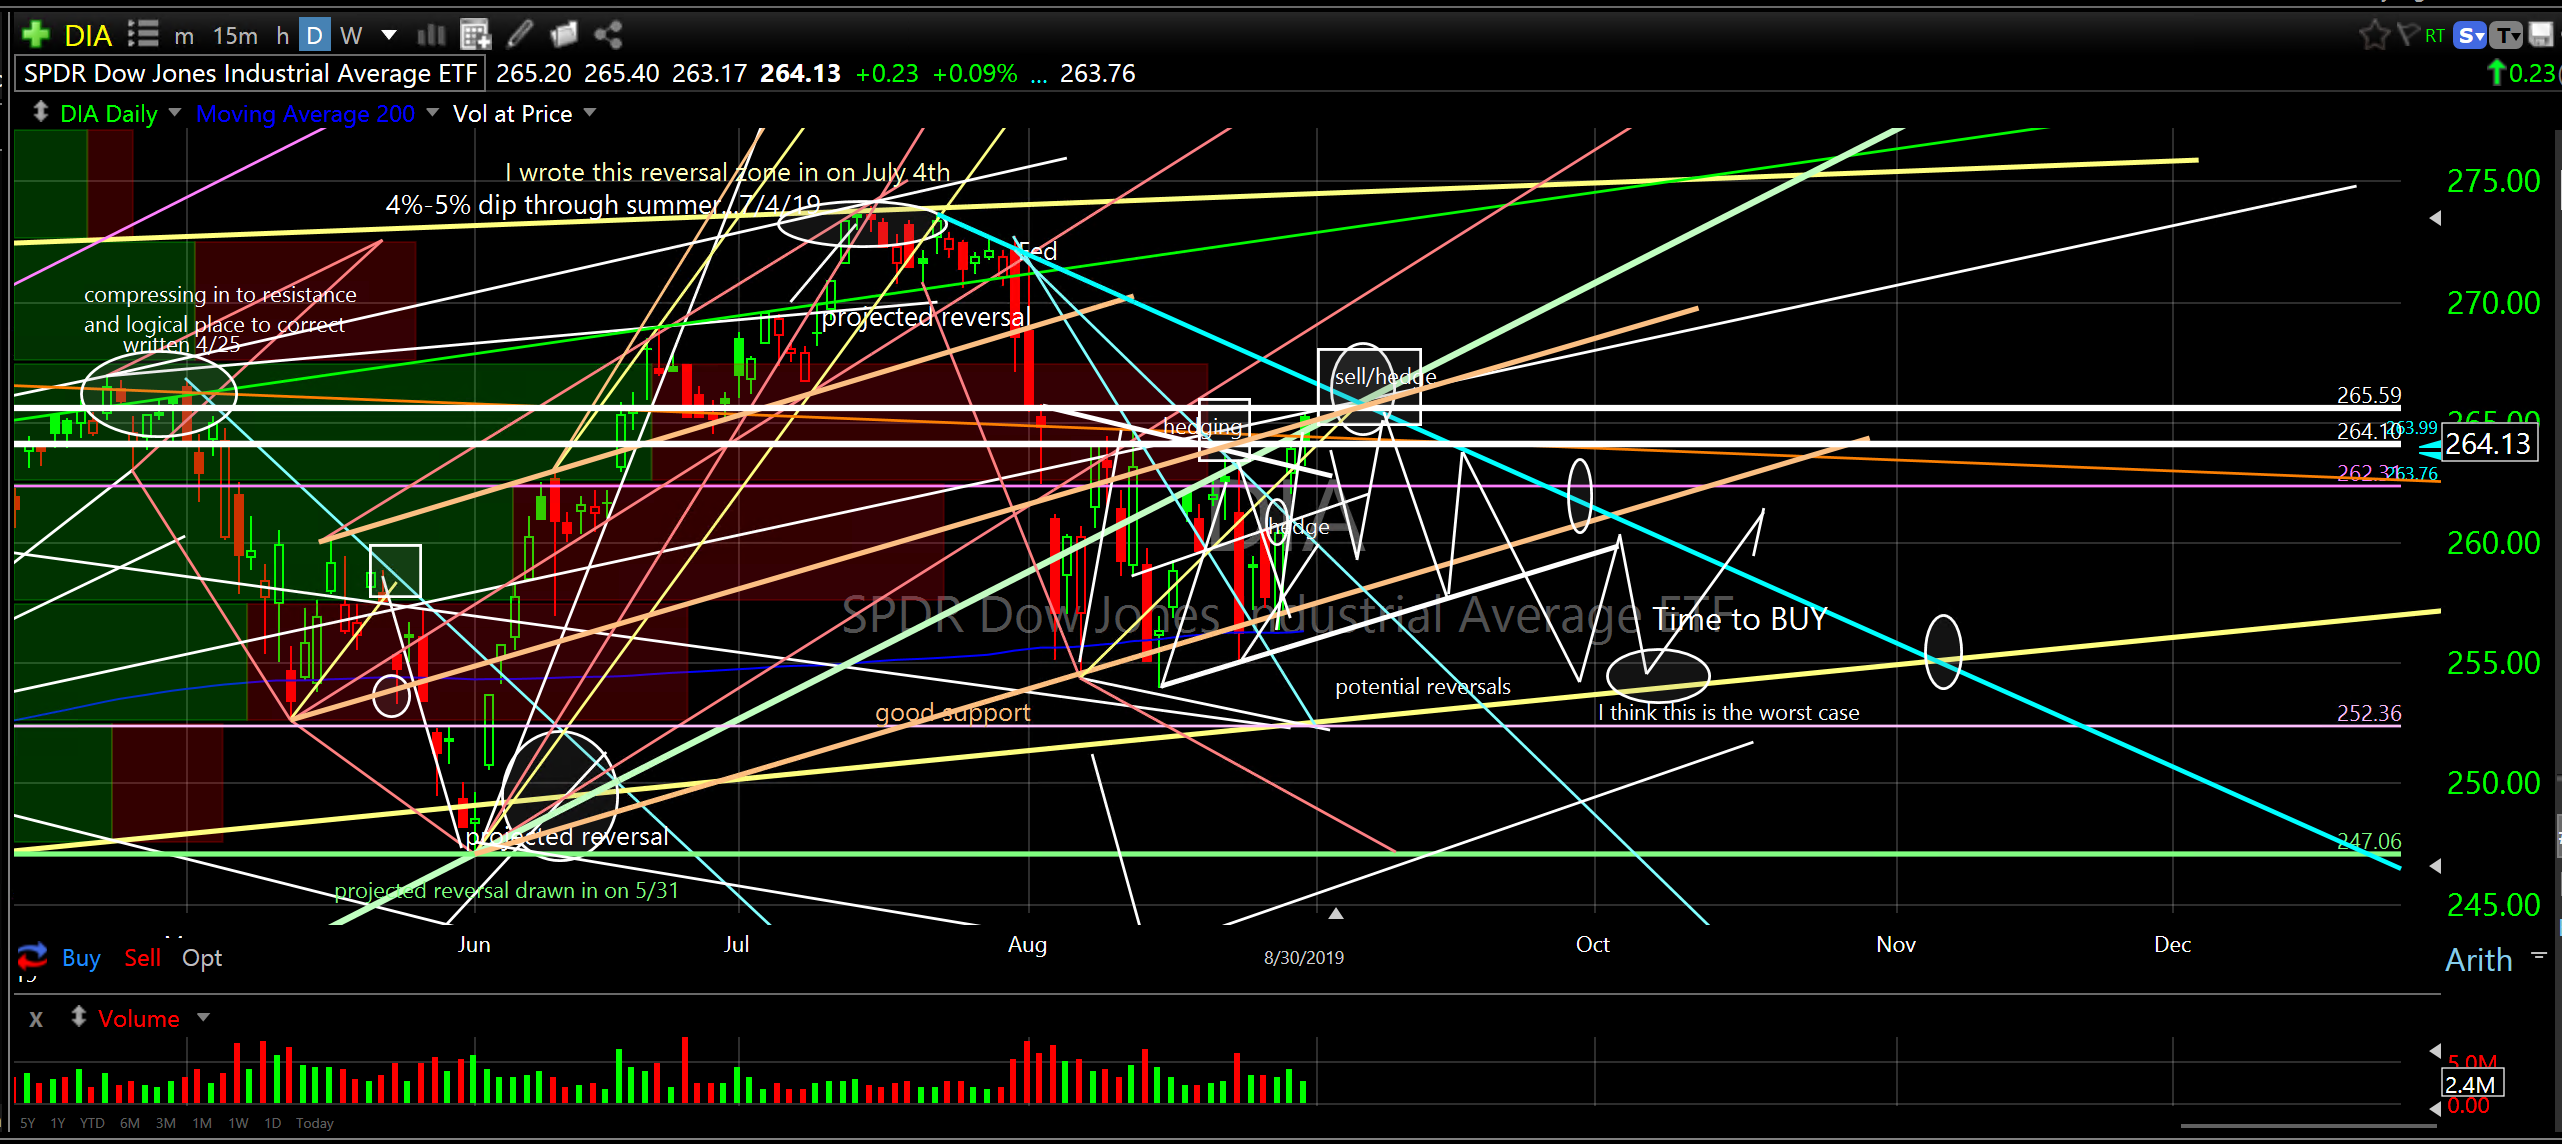
SPDR Dow Jones Industrial Average ETF (DIA) daily
I chart for hedge fund managers, portfolio managers, financial advisors and retail investors…and generally anyone who is willing to take some time to understand…unfortunately, most people don’t want to spend the time to understand. They are stuck in traditional fundamental analysis which is always late to the party or rely on professionals that have been schooled in the same old garbage. Currently, my premium subscription membership is closed to improve/update my web site, however, if you know of anyone who would benefit from my research please feel free to share this email. Just have them reply and I will add them. I can pretty much guarantee most professional managers or retail investors have never seen charting like this let alone understand it. This is NOT traditional technical analysis. This is not traditional quant analysis. But, it’s not that difficult to understand if you just give it a chance. And, if you do, I bet you’ll never look back because you will “see” what I see and understand how I can make trades like the following…
All closed within the last month…
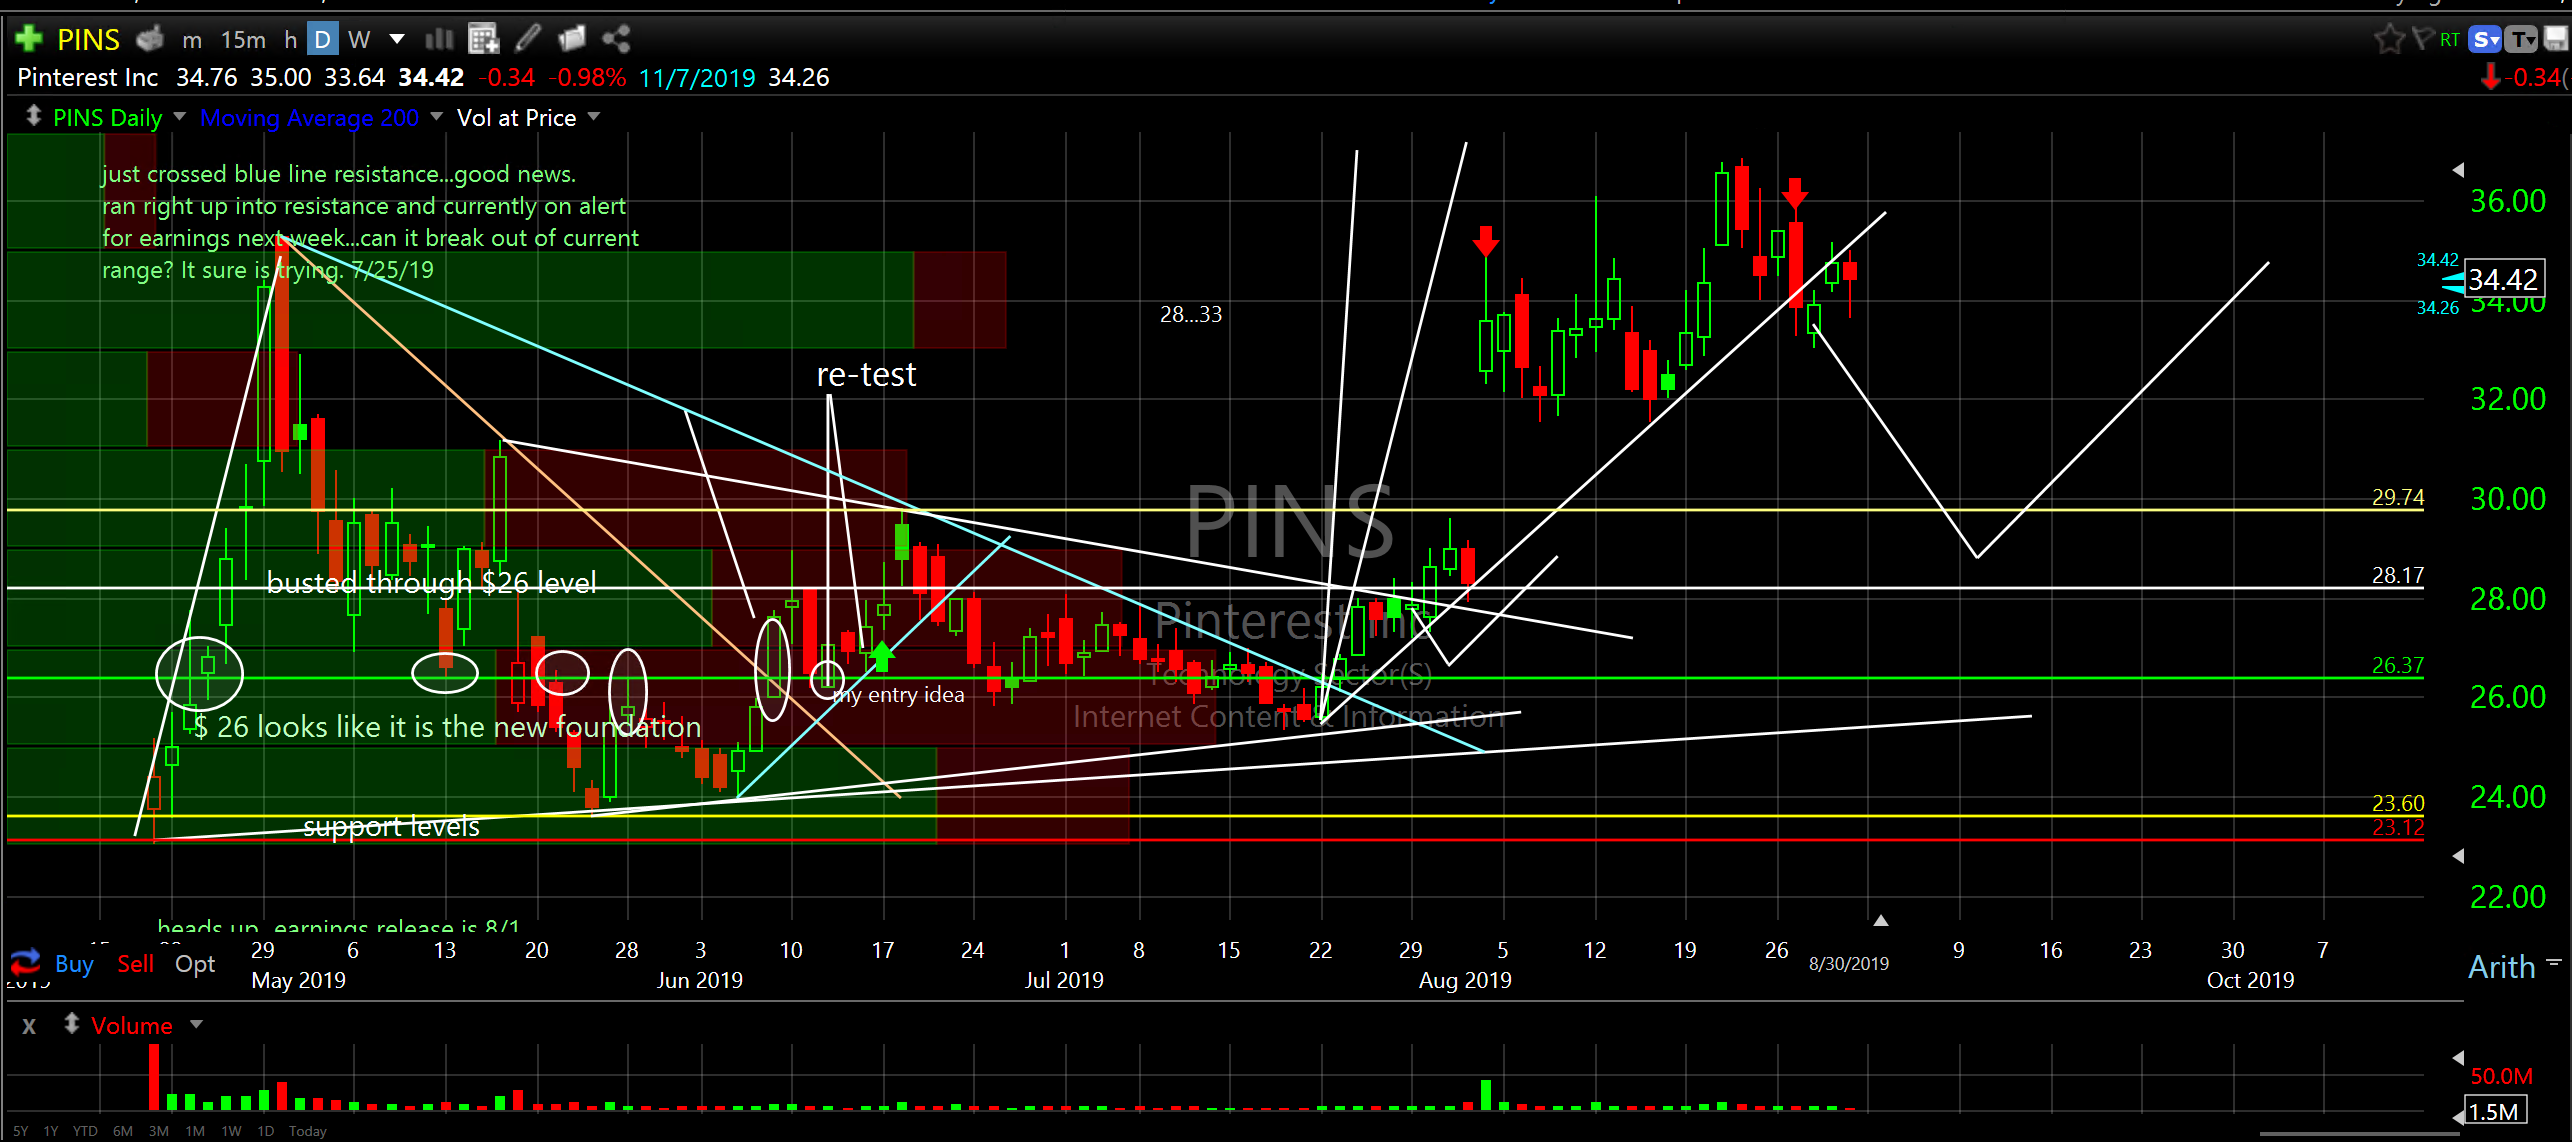
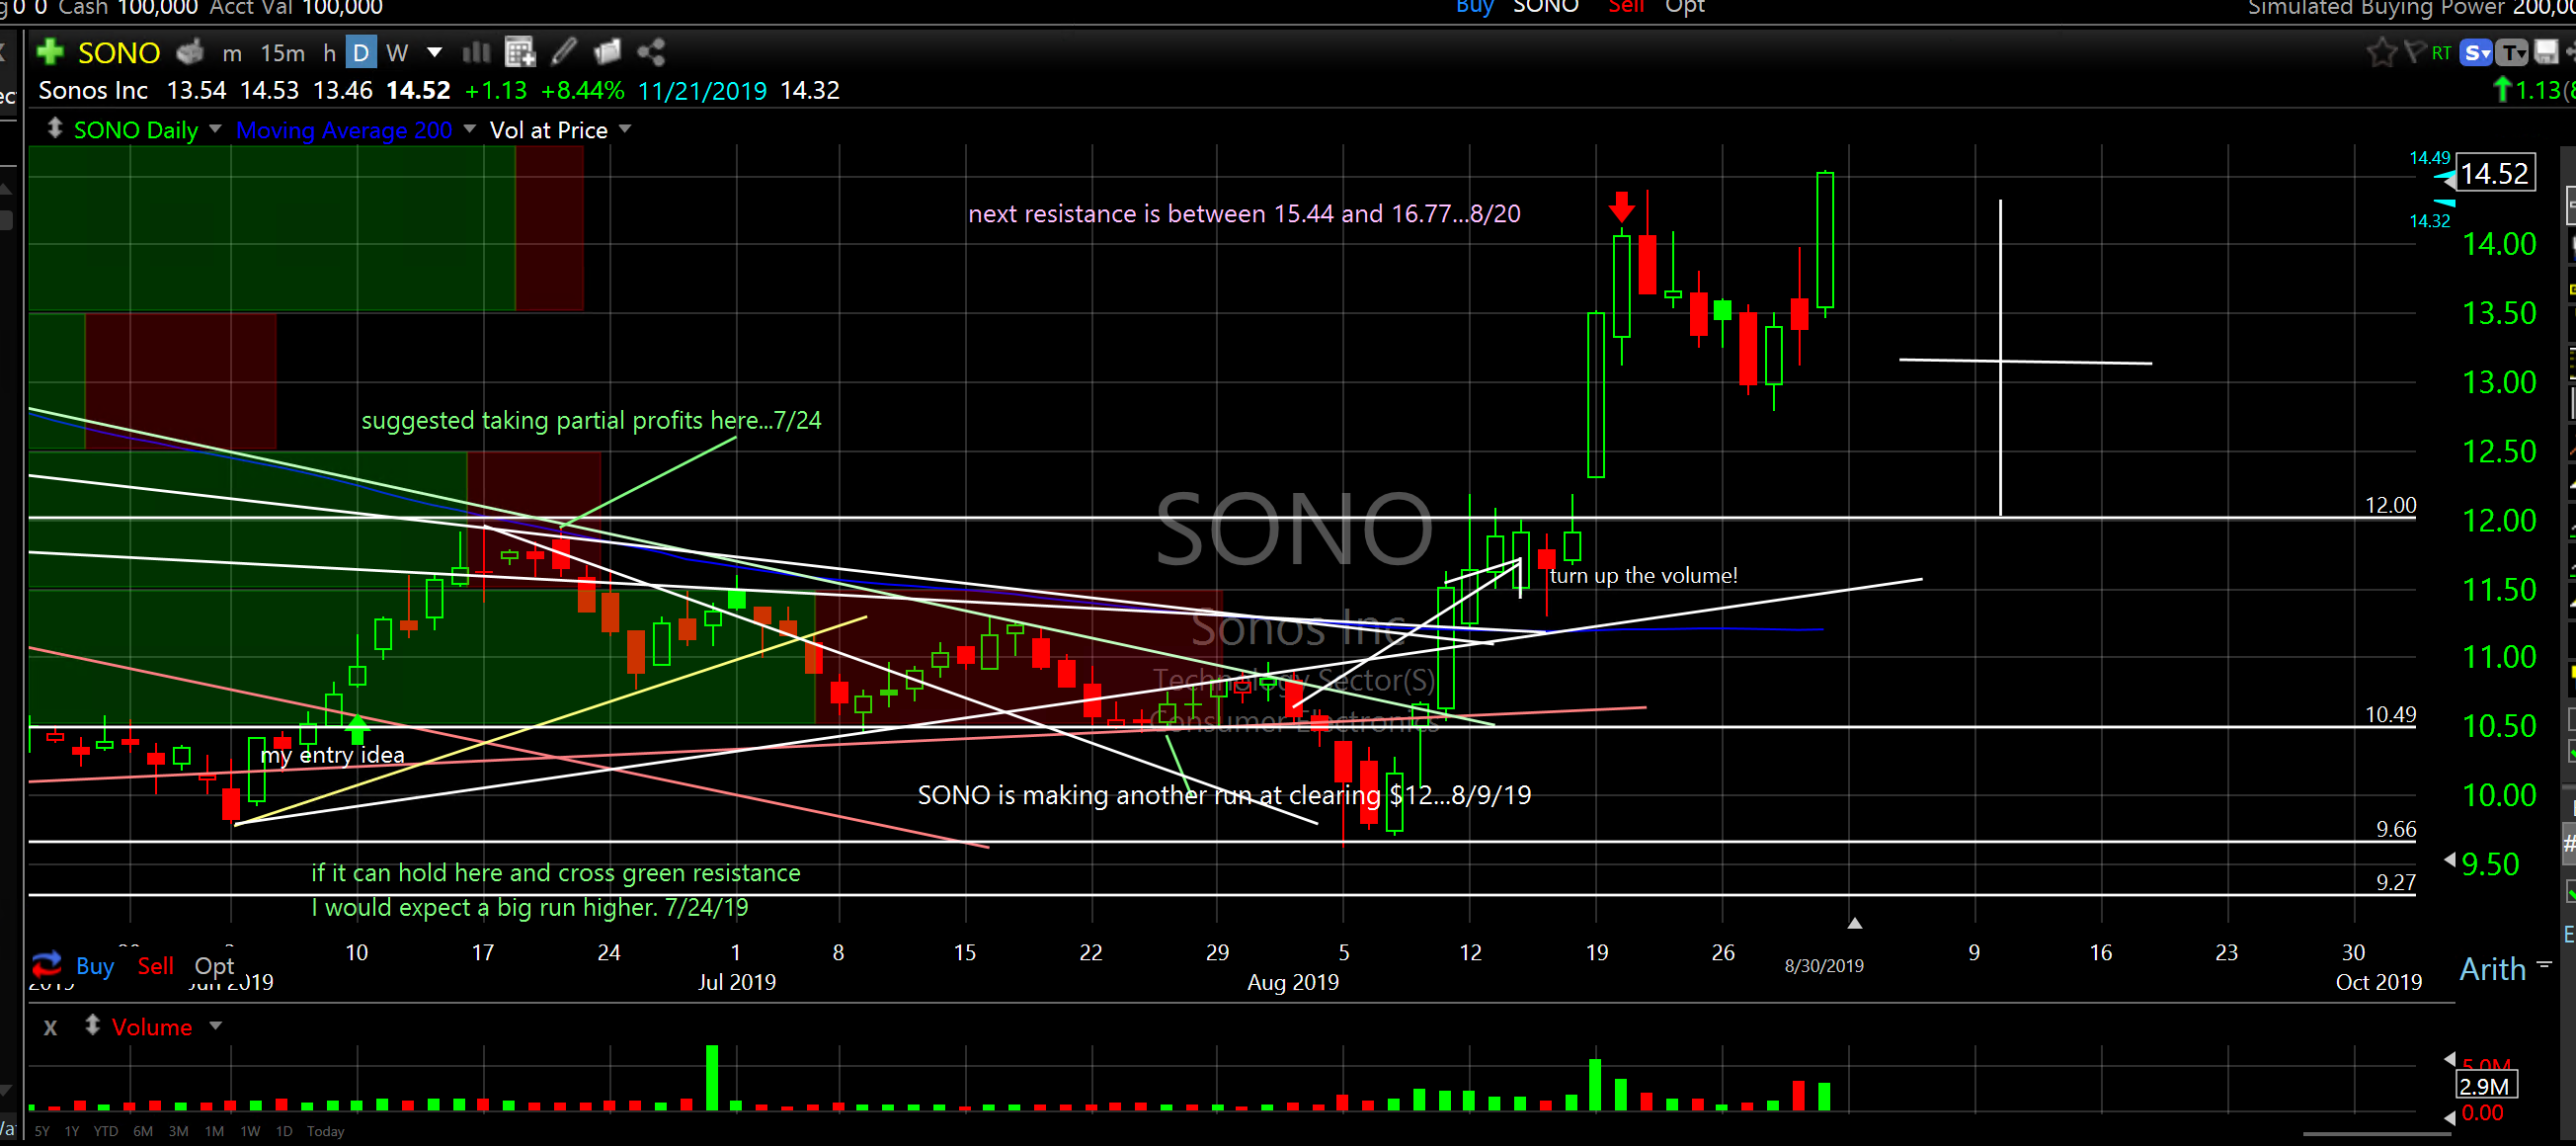
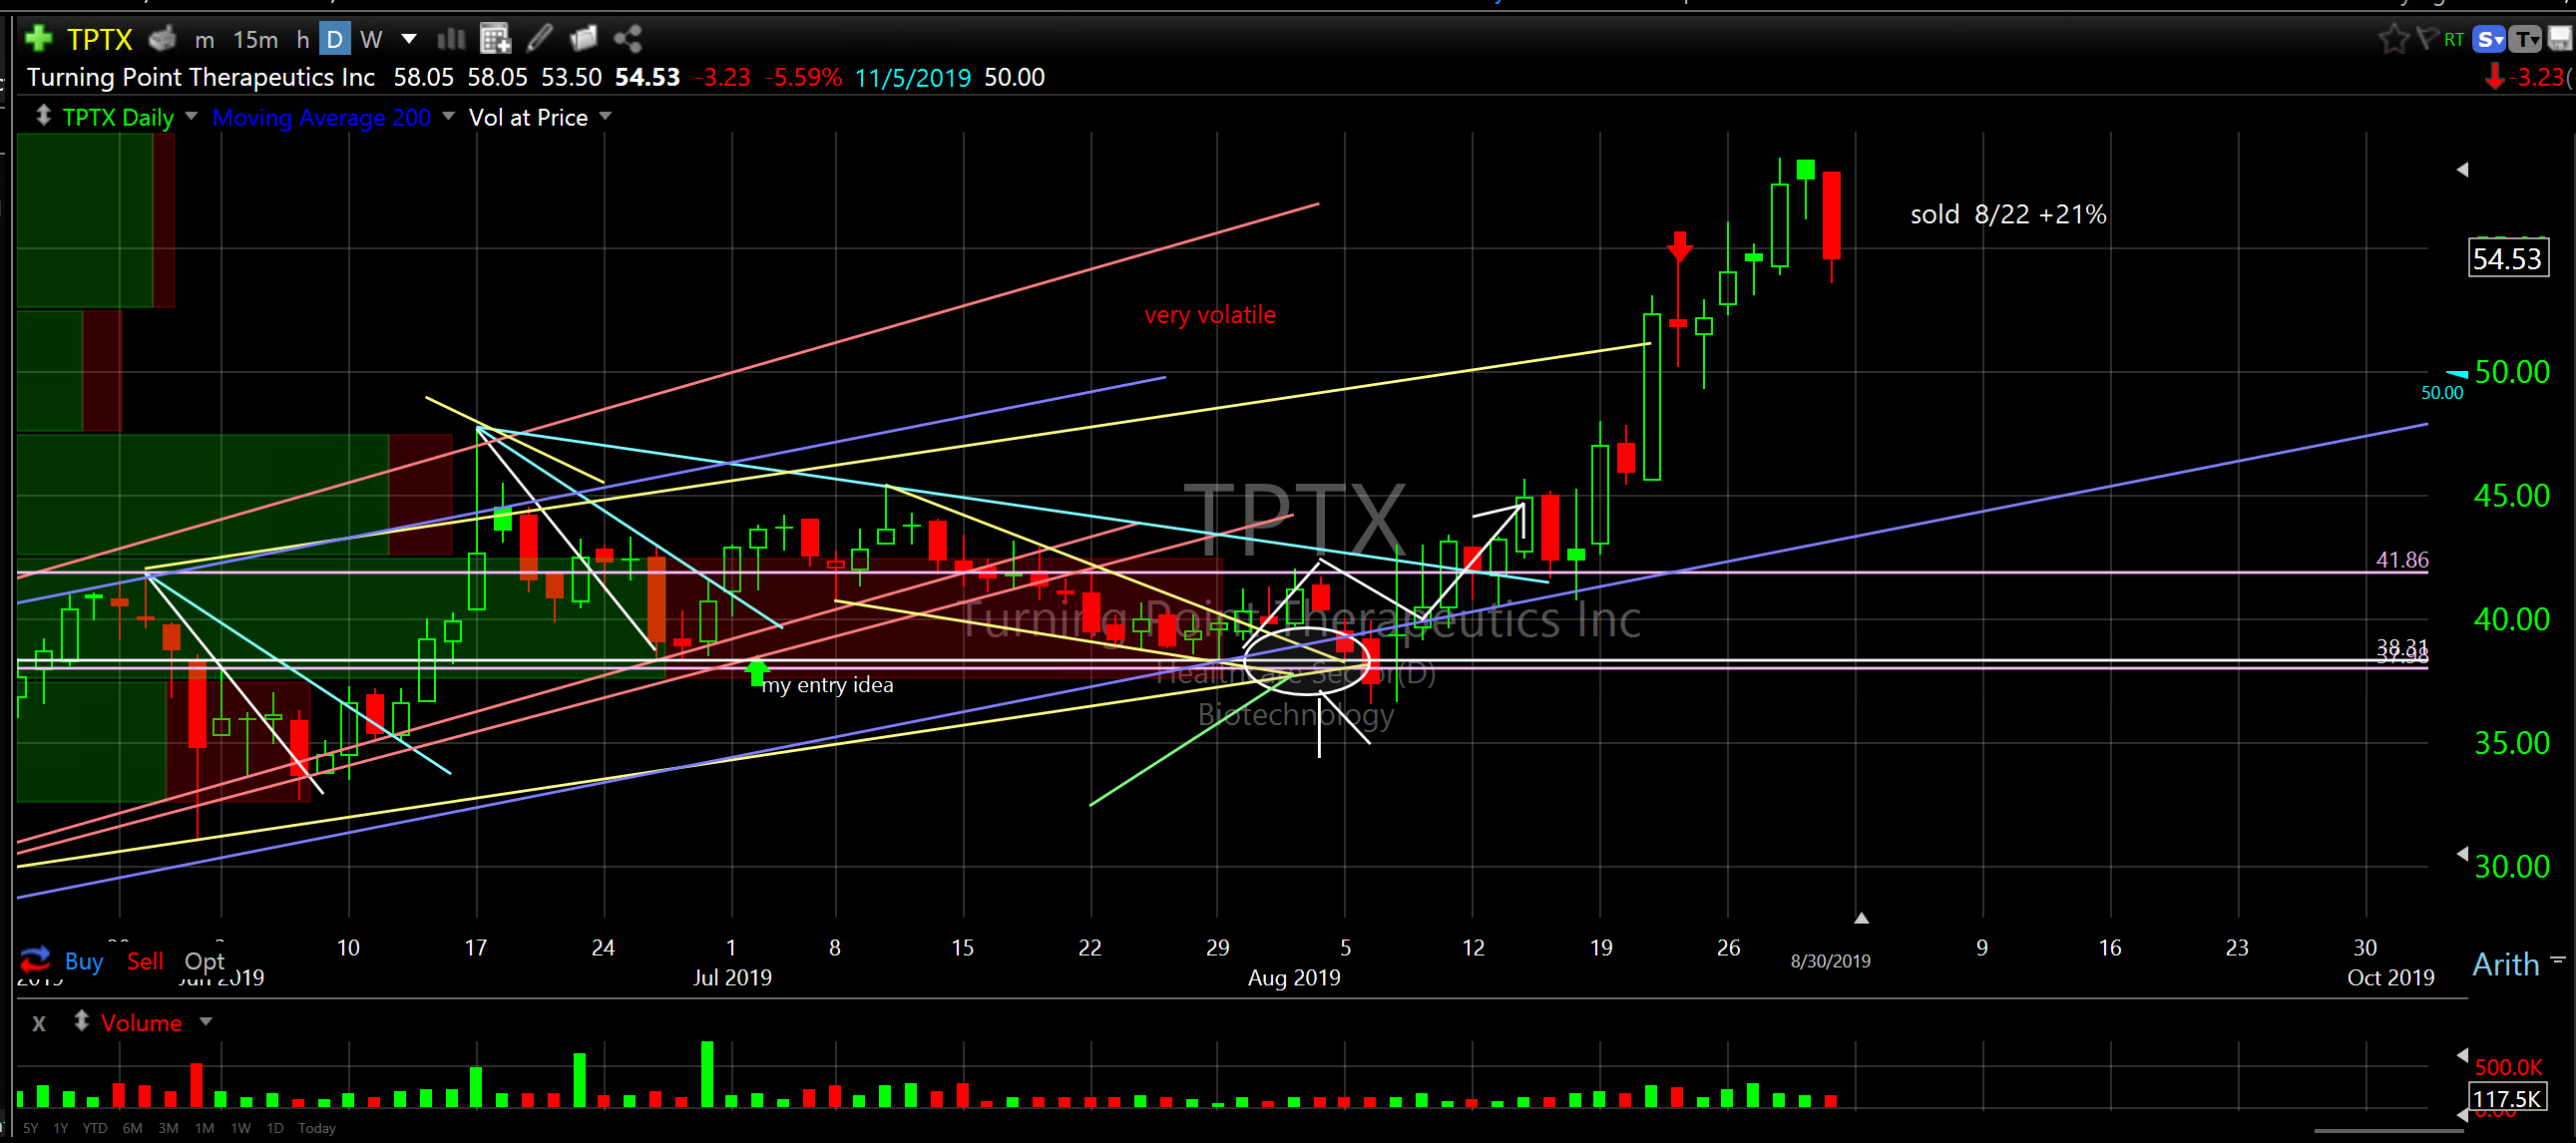
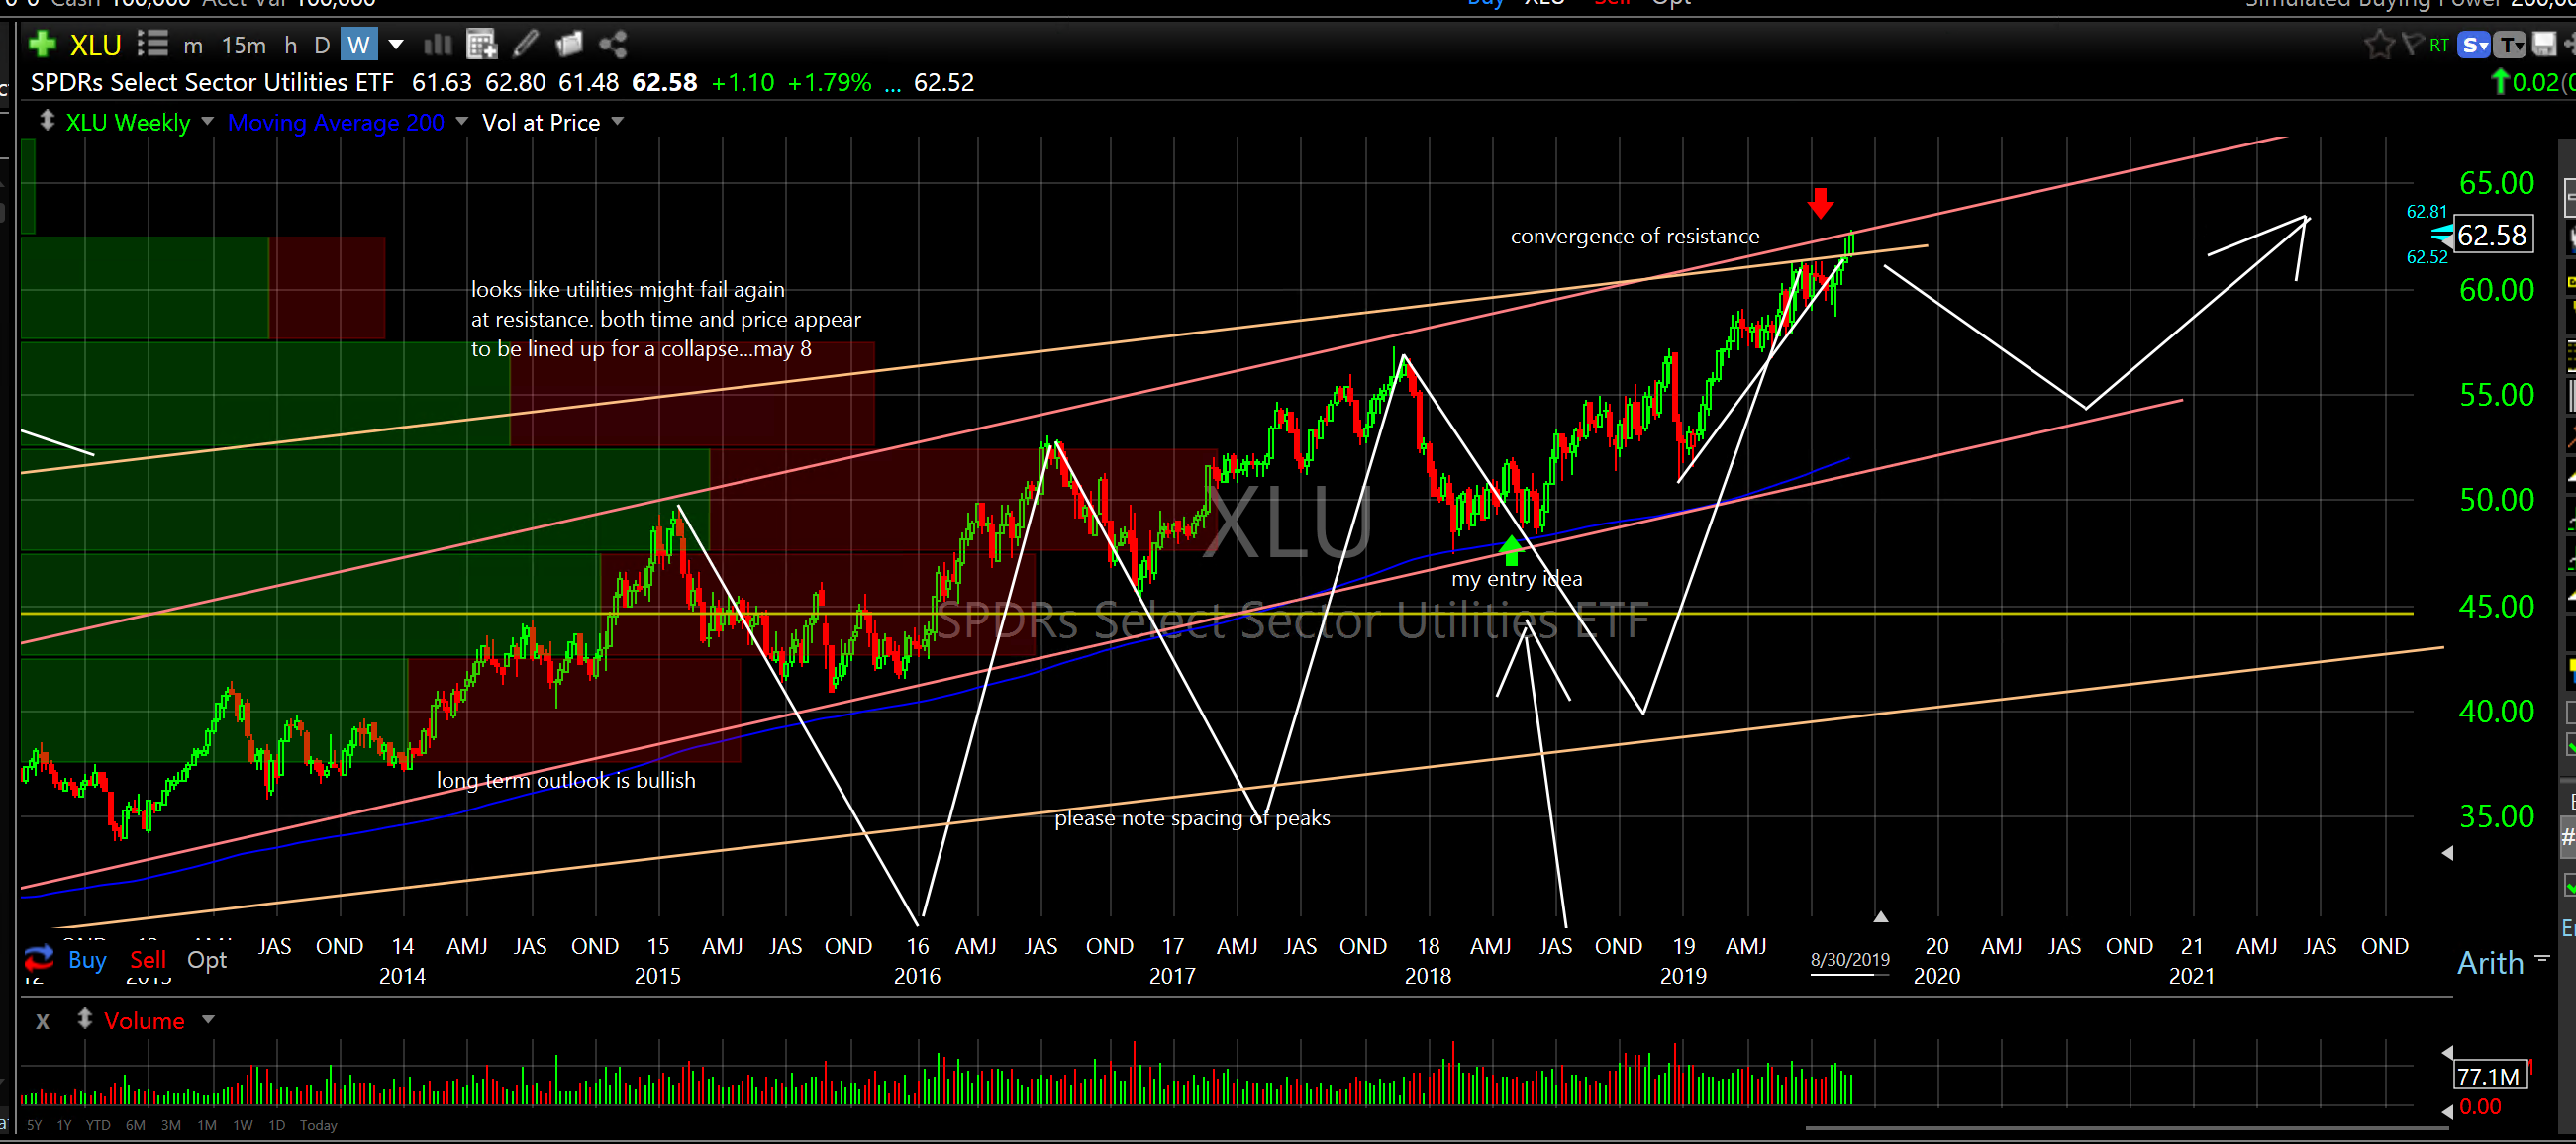
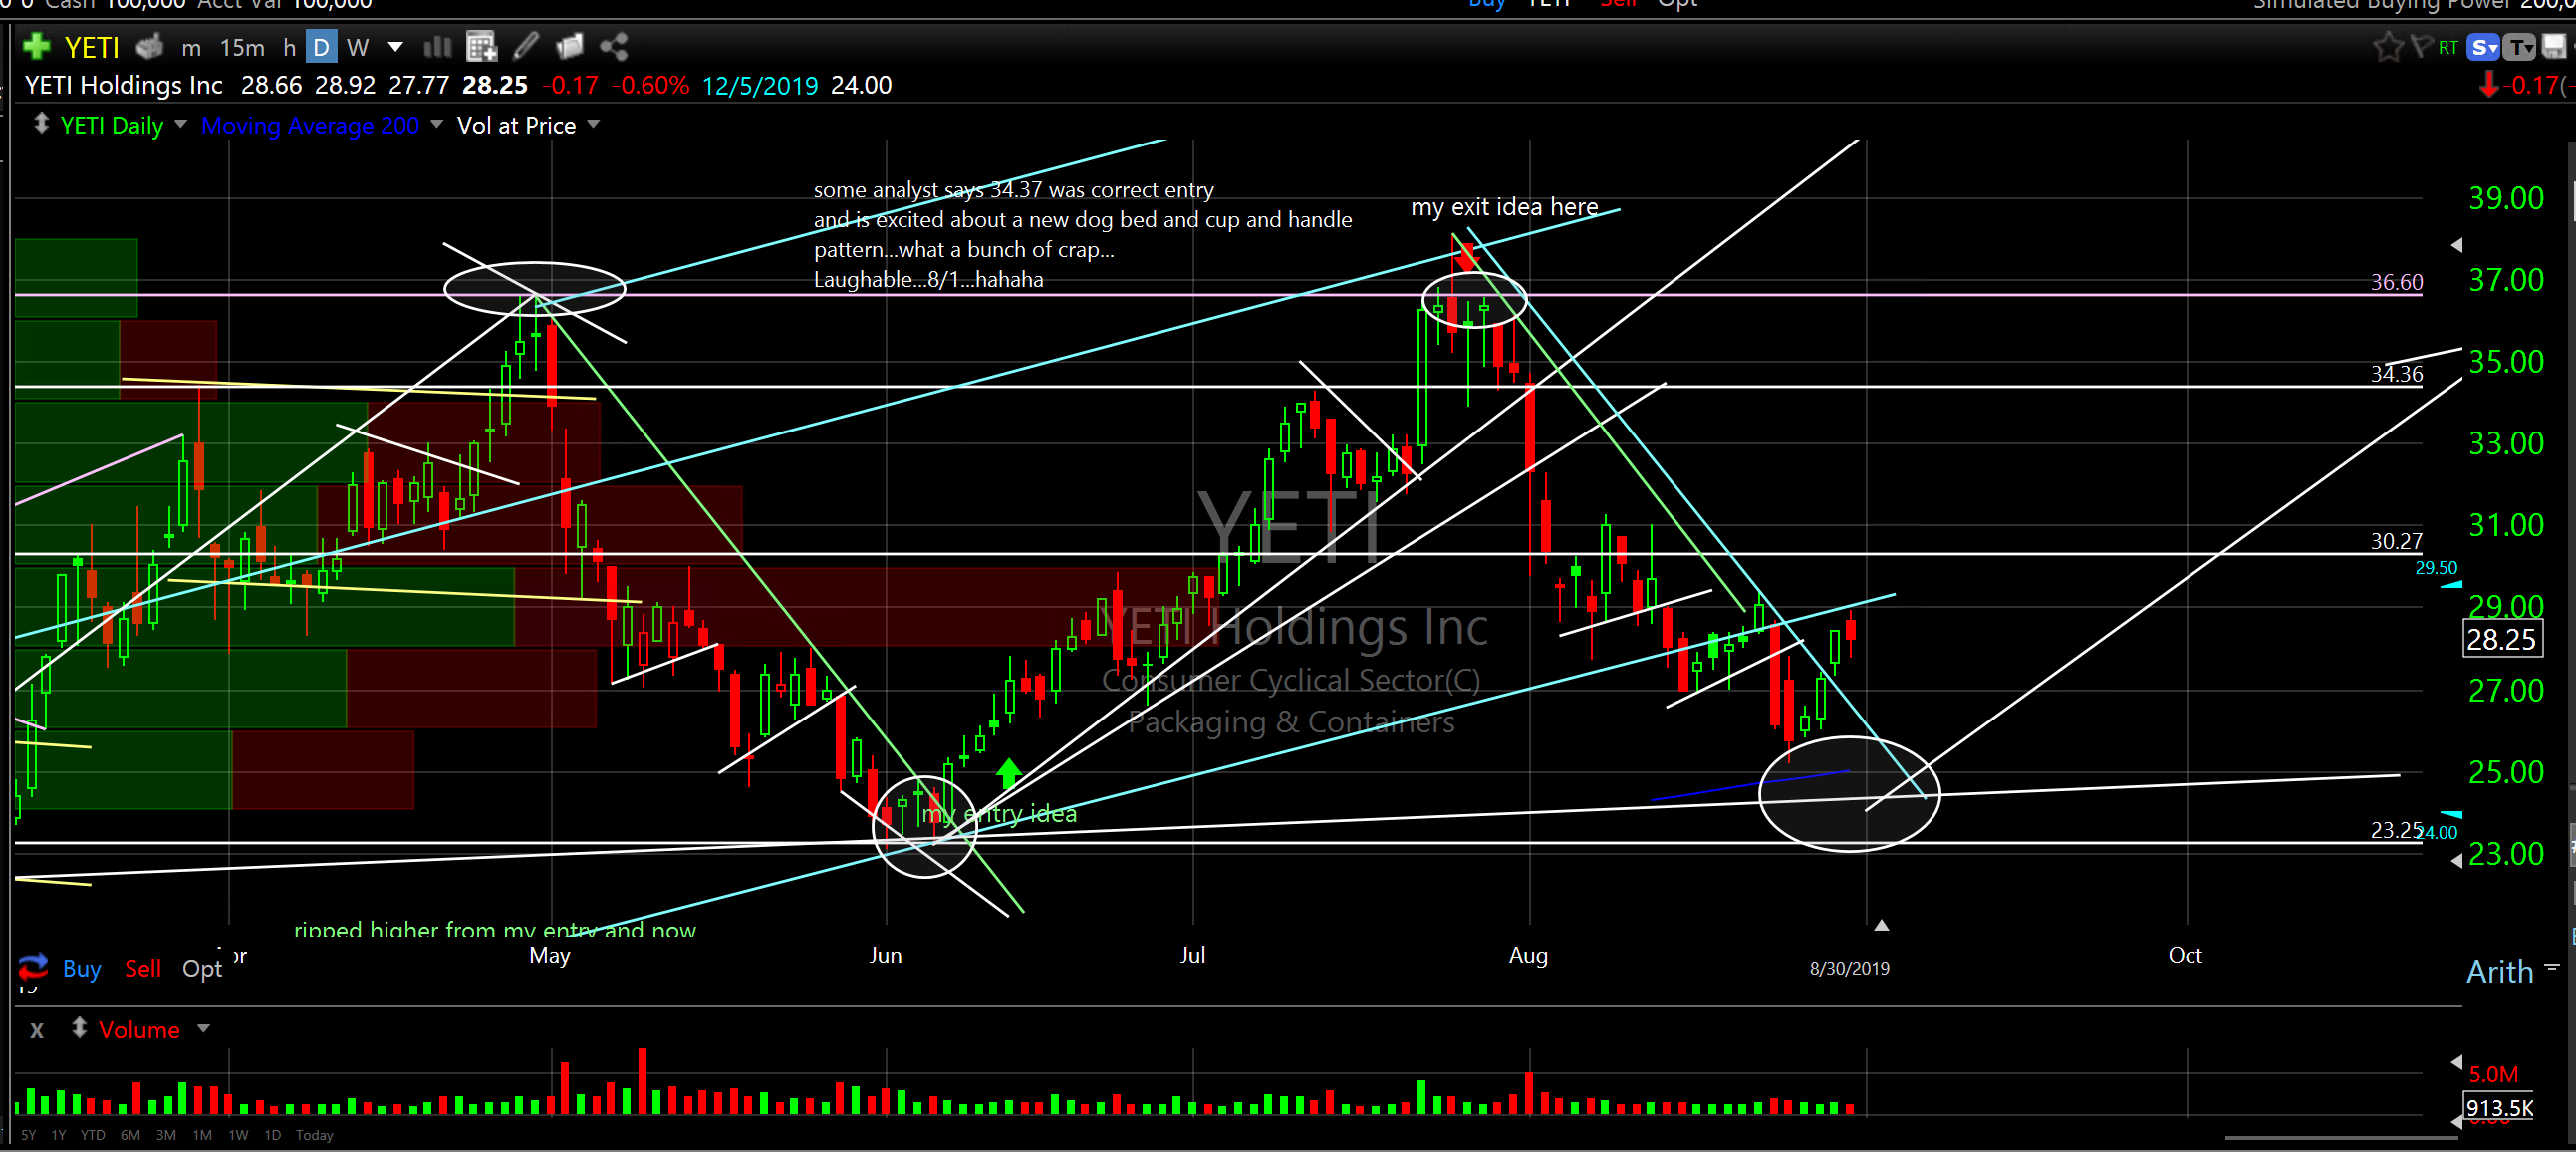
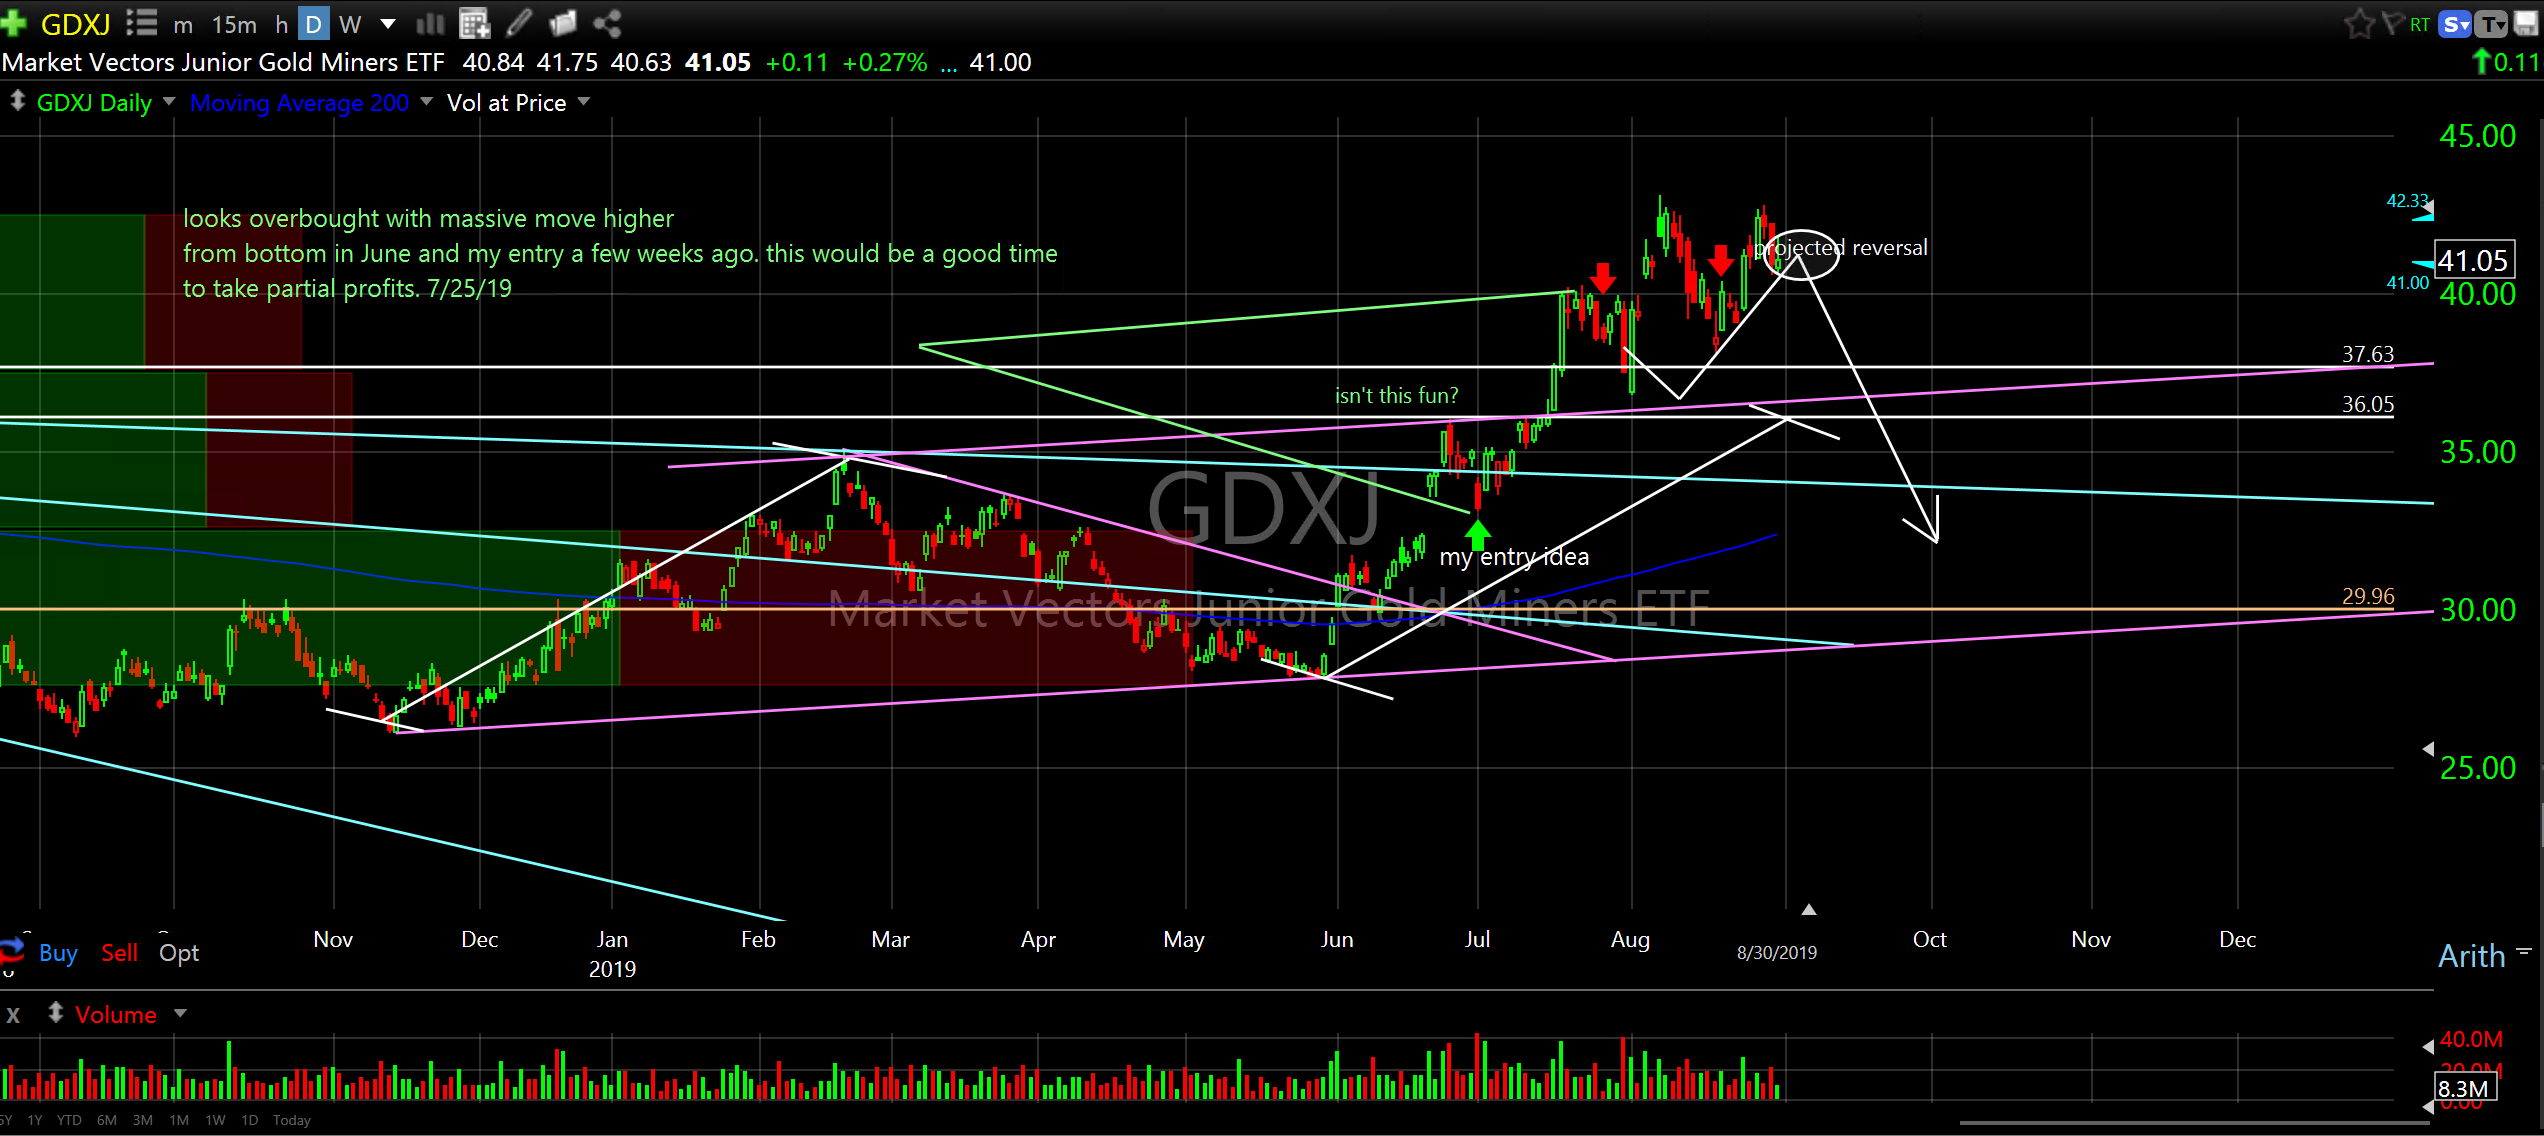
See green and red arrows on charts for entries/exits.
Pinterest Inc (PINS) +20%
Sonos Inc (SONO) +28%
getting ready to trade this one again.
Turning Point Therapeutics Inc (TPTX) +21%
SPDR’s Select Sector Utilities ETF (XLU) +20%
Yeti Holdings Inc (YETI) +30%
…getting ready to trade this one again
Market Vectors Junior Gold Miners ETF (GDXJ) +15%
Conclusion
As one of the smartest guys I know said recently (and I paraphrase), if we are on the verge of a recession, it will be the most telegraphed and widely touted recession in history. me again…Remember, most people get it wrong and they are usually on the wrong side of the market. Don’t be most people.
One final thought…I feel fortunate to have made price/time/cycle analysis my hobby, my work and my passion. I feel grateful to be able to share it and I feel humbled by those I have learned from along the way.
If you are receiving a forward of this and you have any interest all you need to do is reply. Stock and ETF low risk/high reward entries coming soon. Broader market expansion coming soon. Sit back and watch or take the opportunity to open your mind and learn. Just hit reply and say “add me”.
You have nothing to lose and so much to gain by learning how the market really works. I promise you will be shocked by the symmetry and repetition in individual stocks and the broader market and how to leverage this knowledge.
If nothing else, you must look at the charts. If they don’t blow your mind…they should.
All the best,
Don