This is a MUST READ. I think it is anyway. Premium content.
Getting Ready to Rock…
The broader market pushed up and to the right Thursday and Friday crushing resistance. Bullish! We might get another pullback but I don’t really care now. Price wants to get back up to old highs and break through and it looks like it’s going to happen soon. I think we are about to leave the massive 18 month consolidation range behind and start to rock and roll very soon.
Could we get another steep drop in the near future? Yes. Is the bias to the upside over the next 9 months? Yes. Will I be getting more aggressive as we go into the next few months? Yes, unless something crazy happens. Twits happen.
If you don’t currently own anything or were wondering when to get in I believe it’s now and over the next few weeks/months.
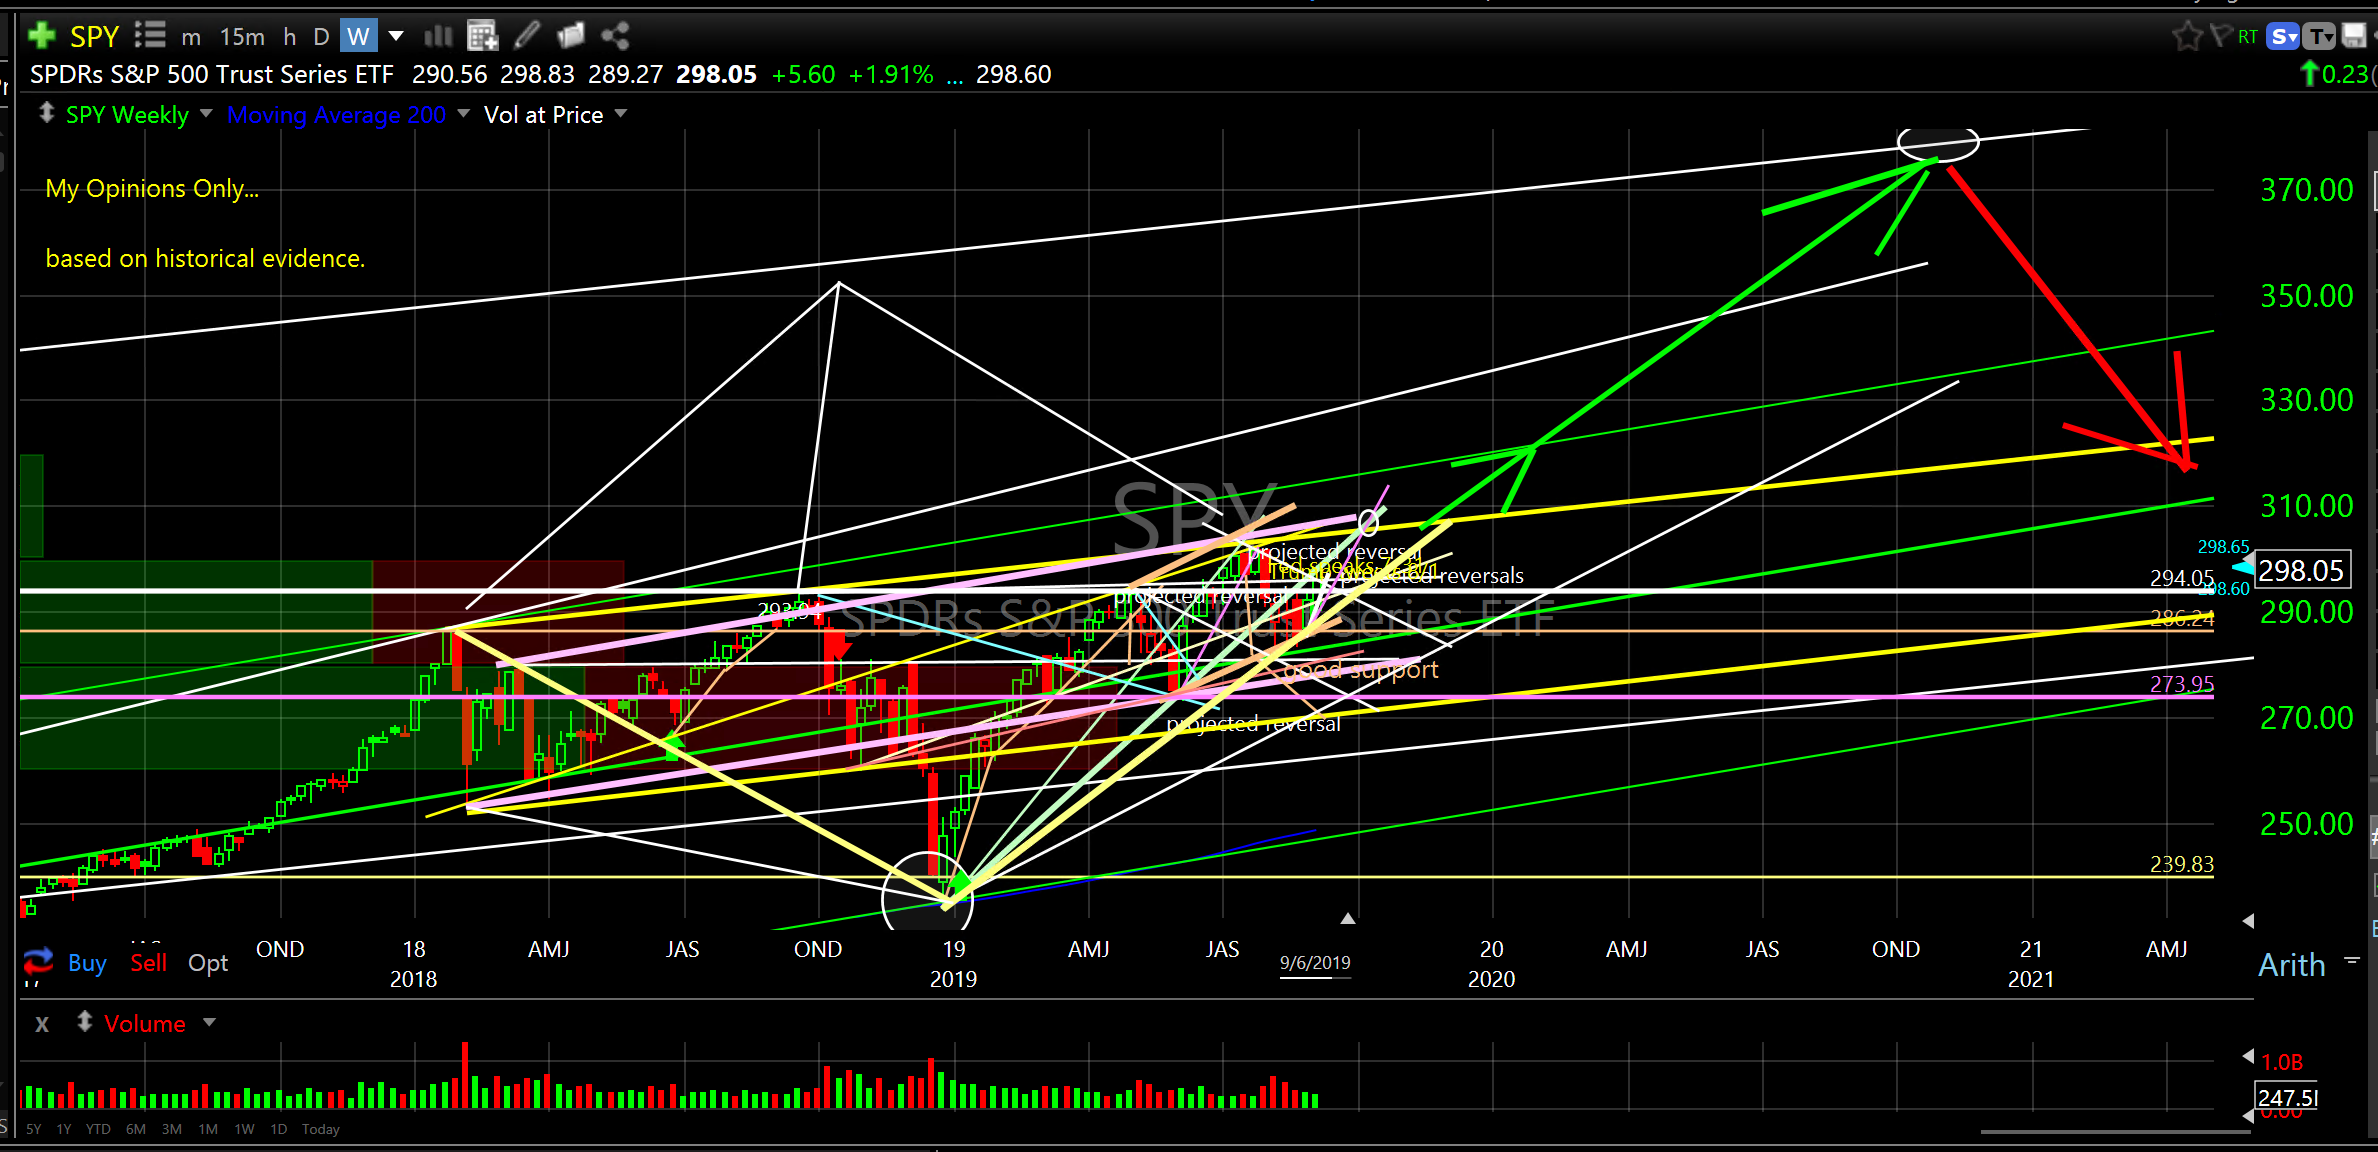
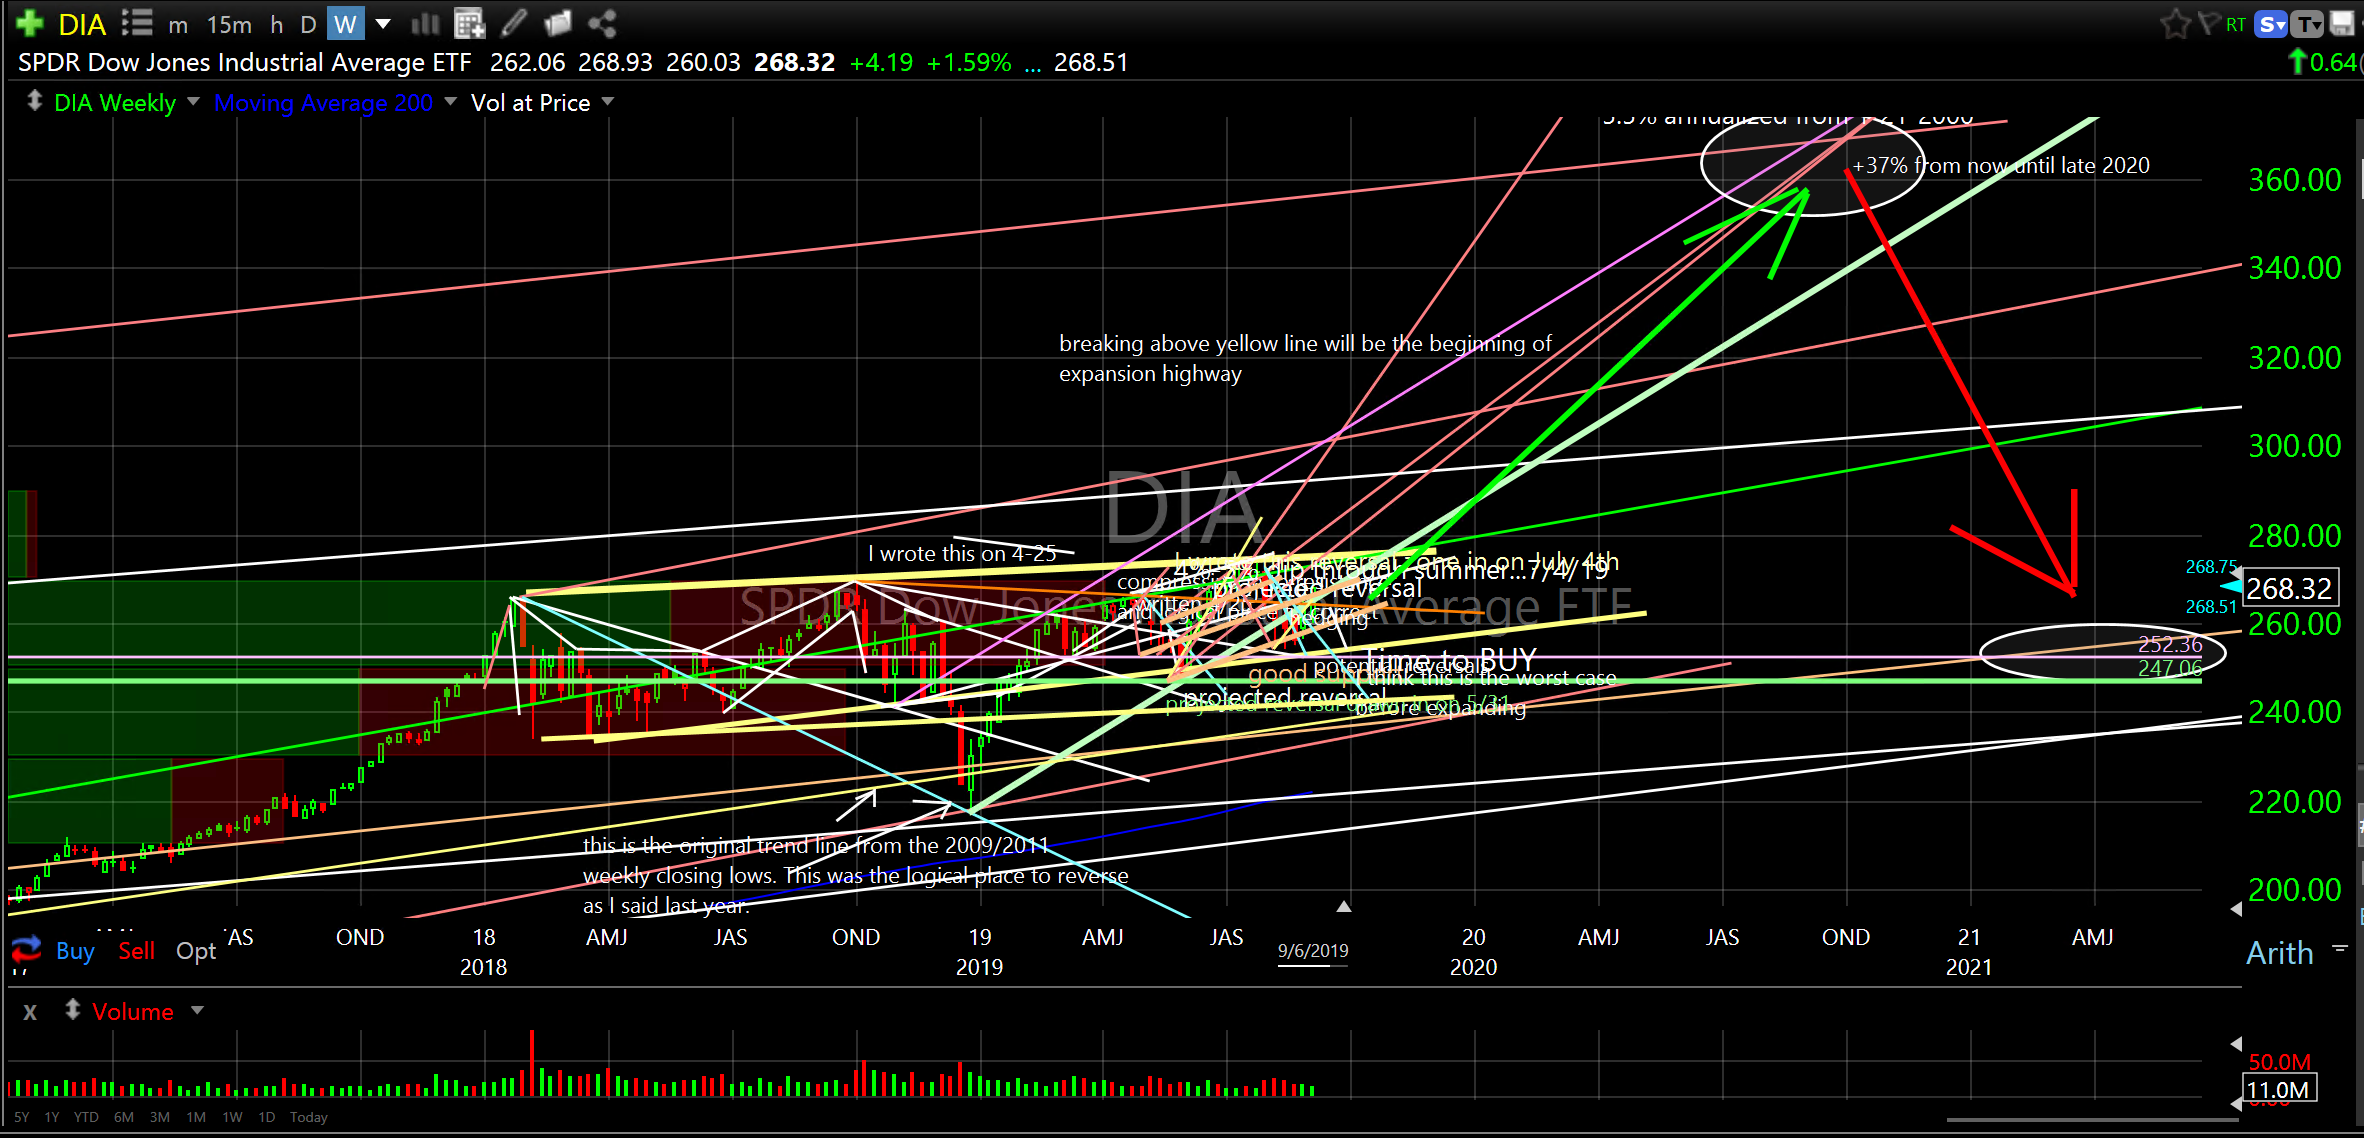
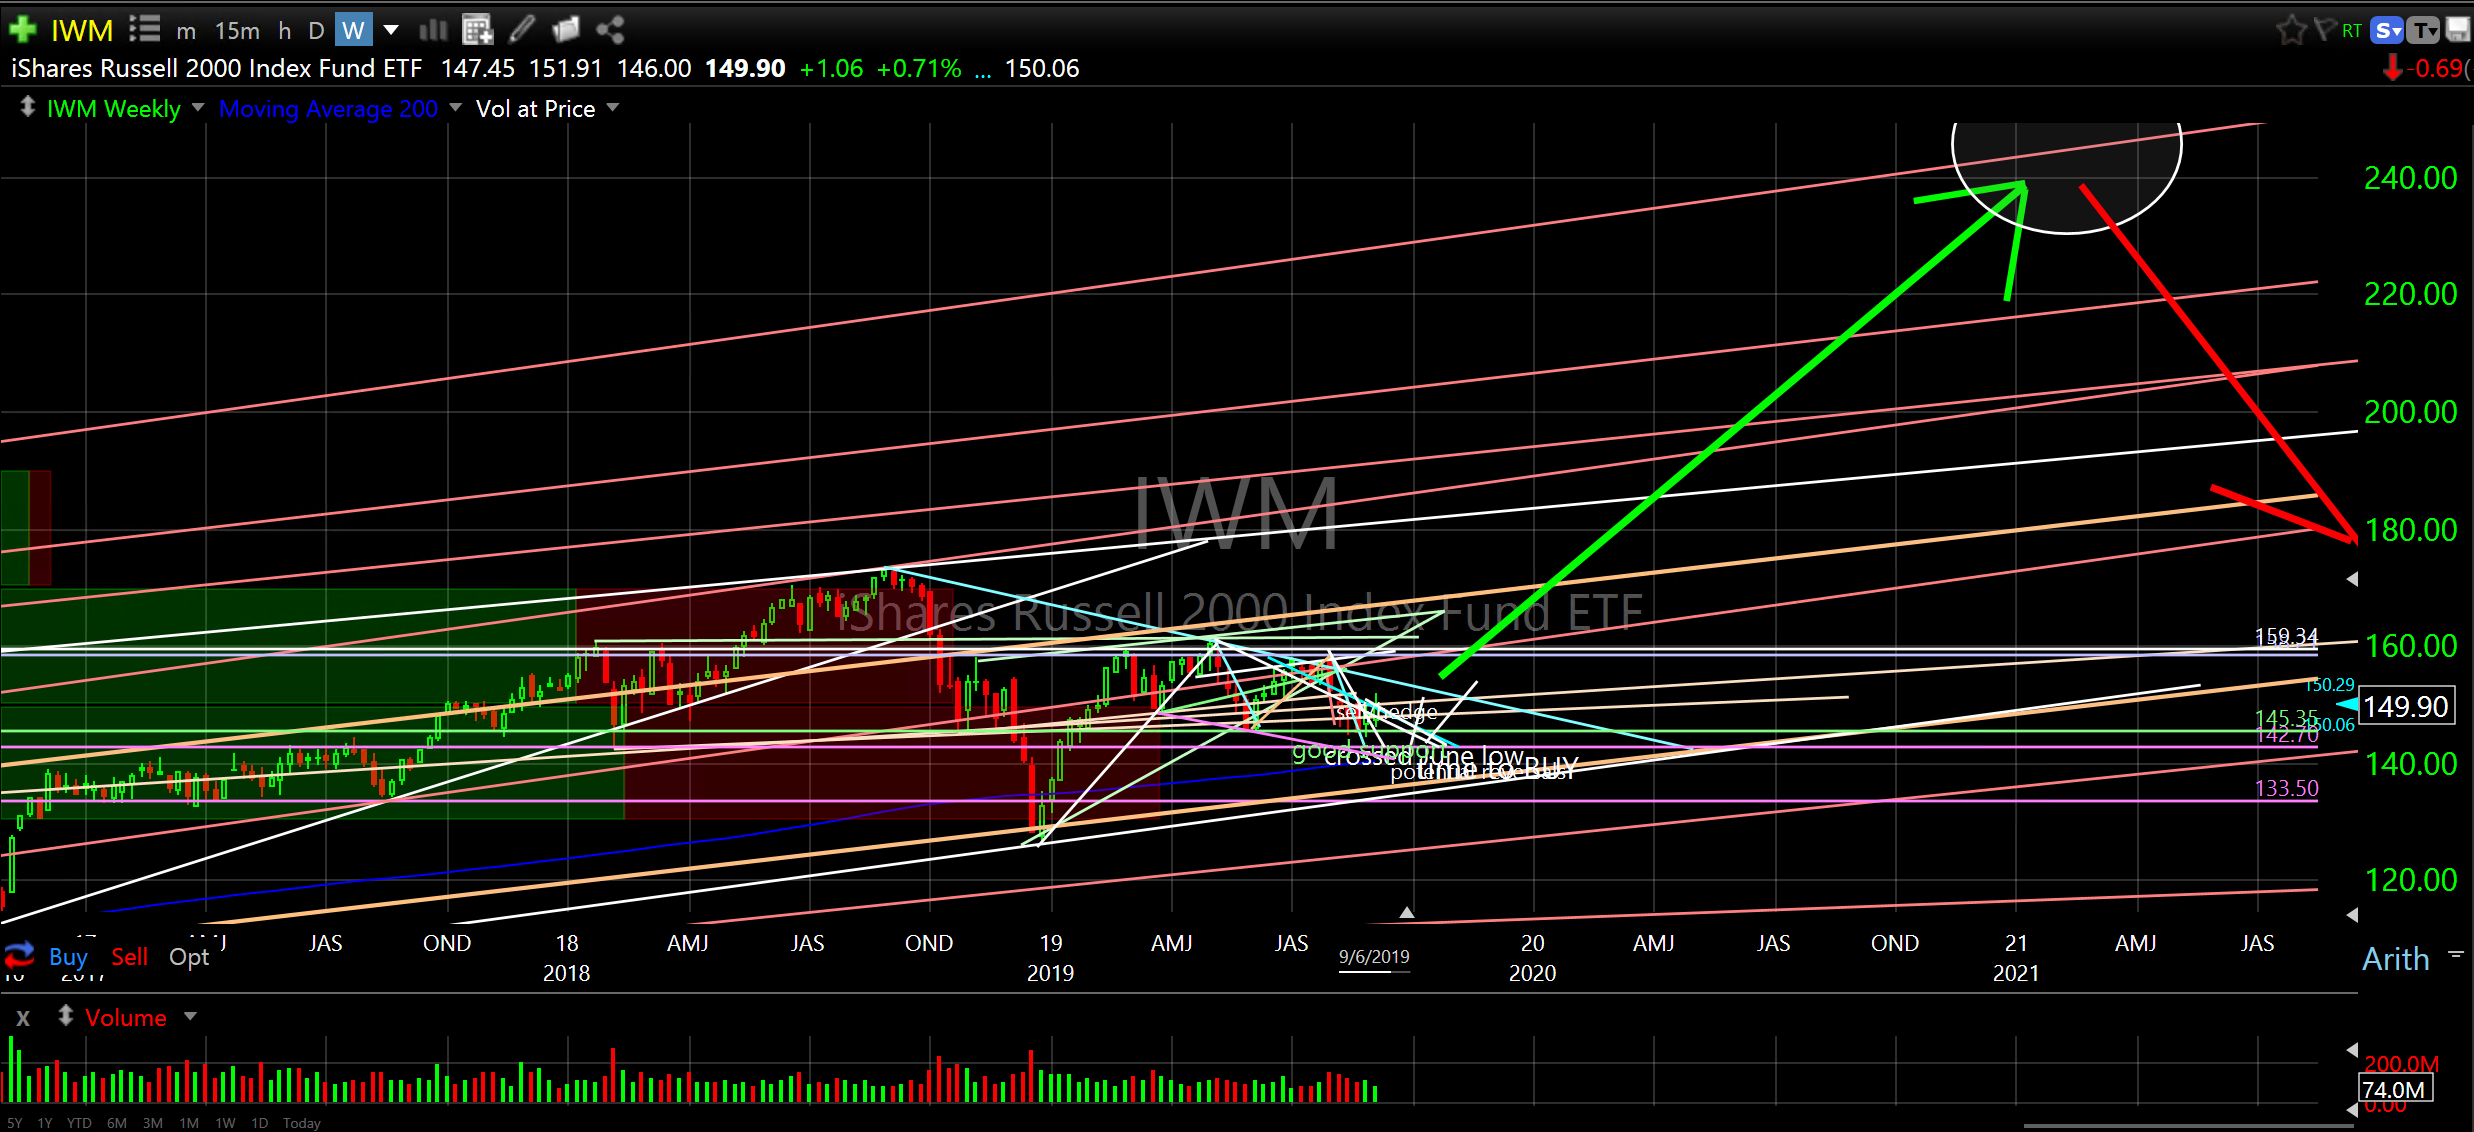
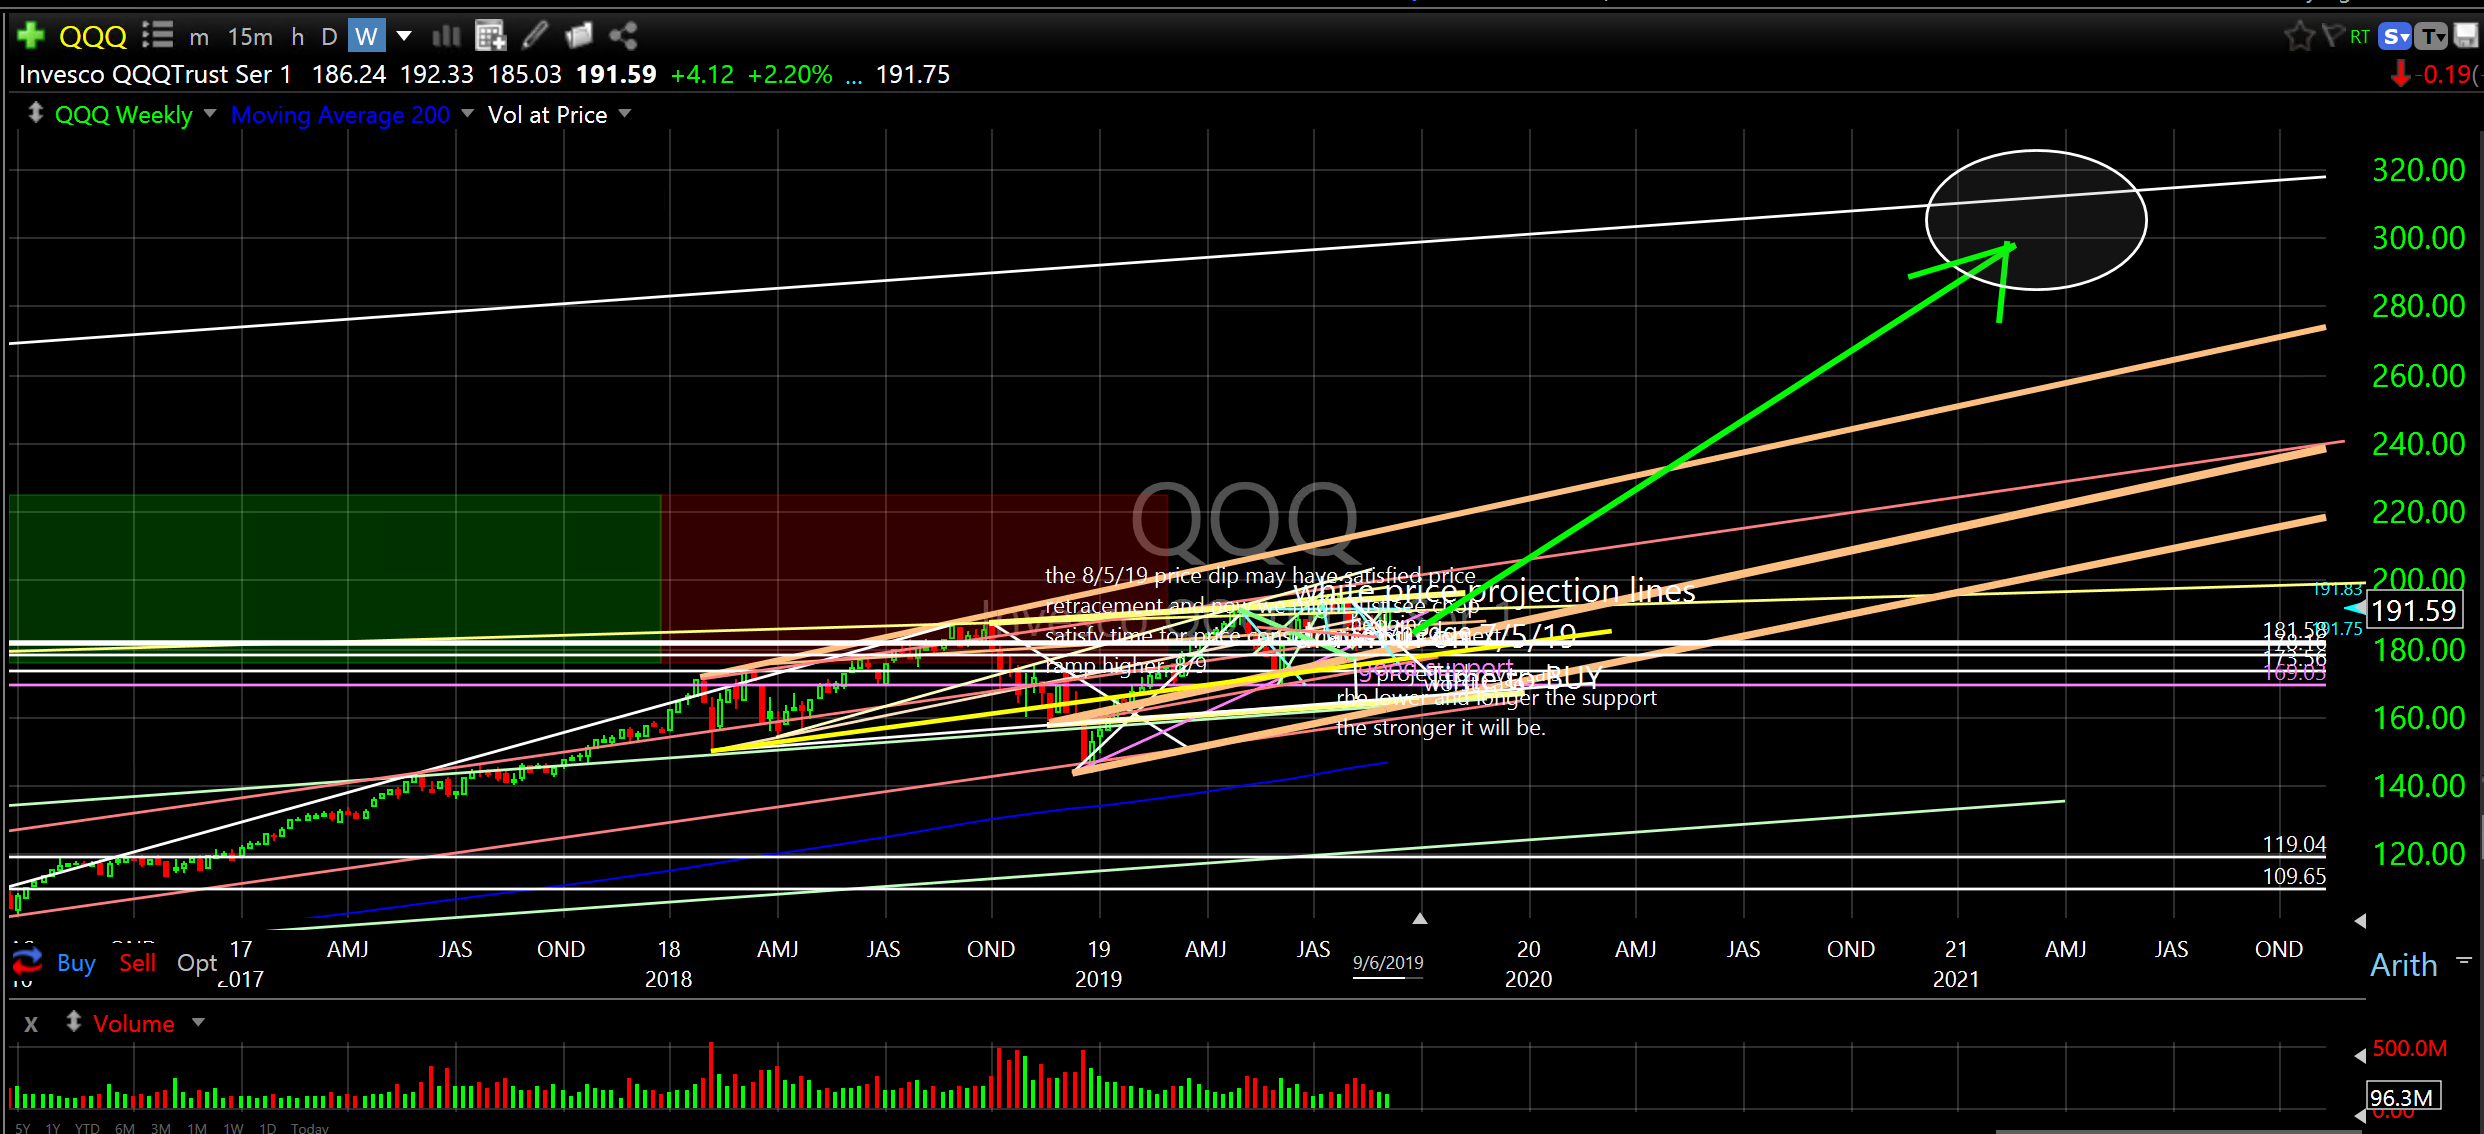
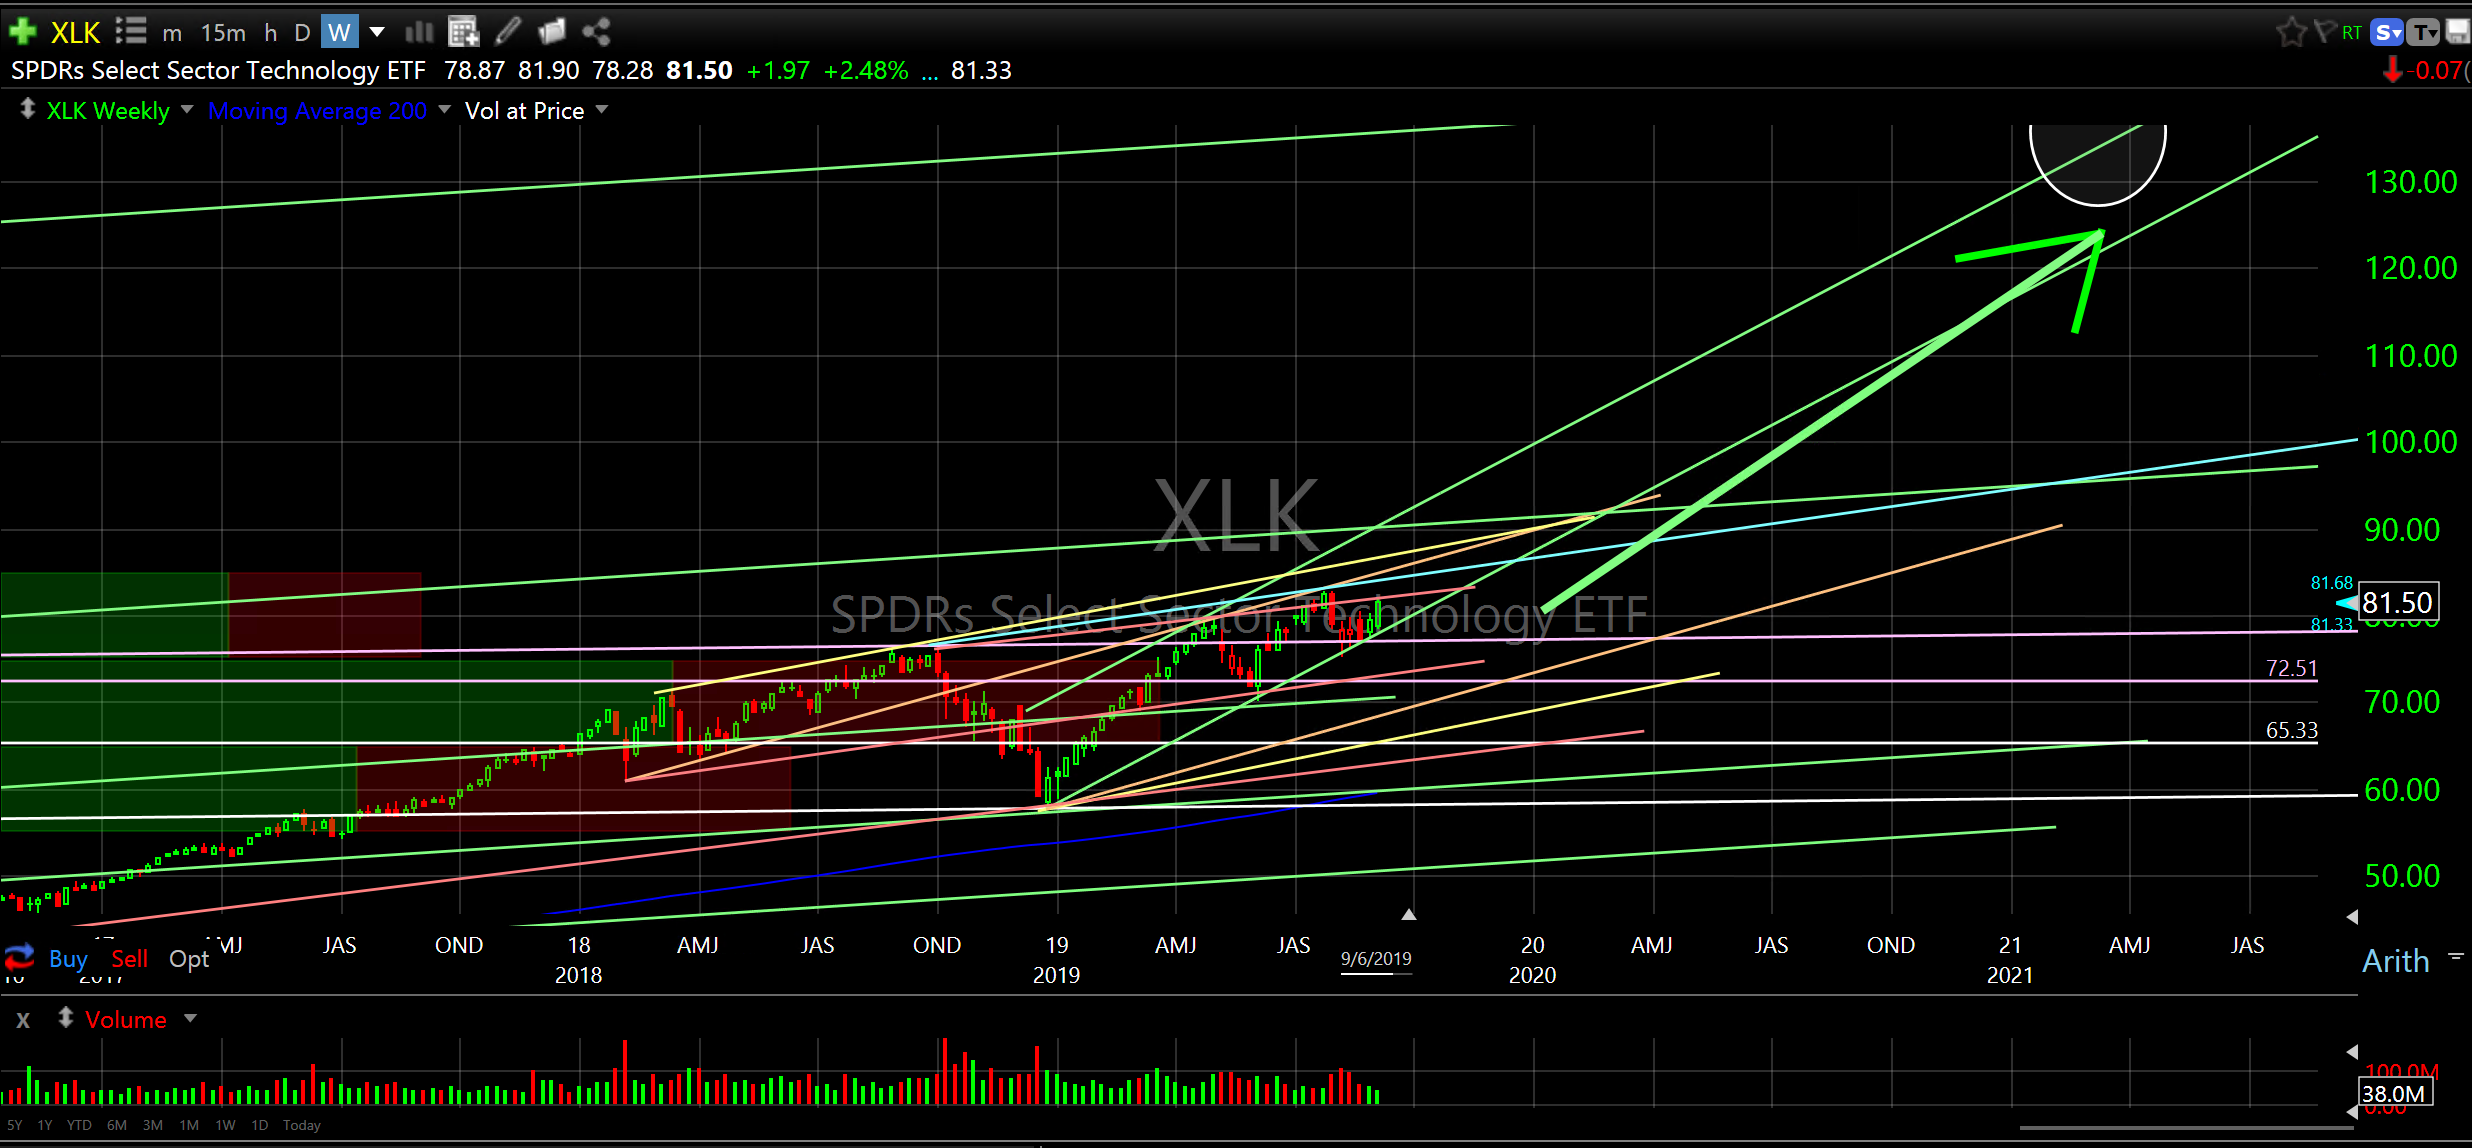
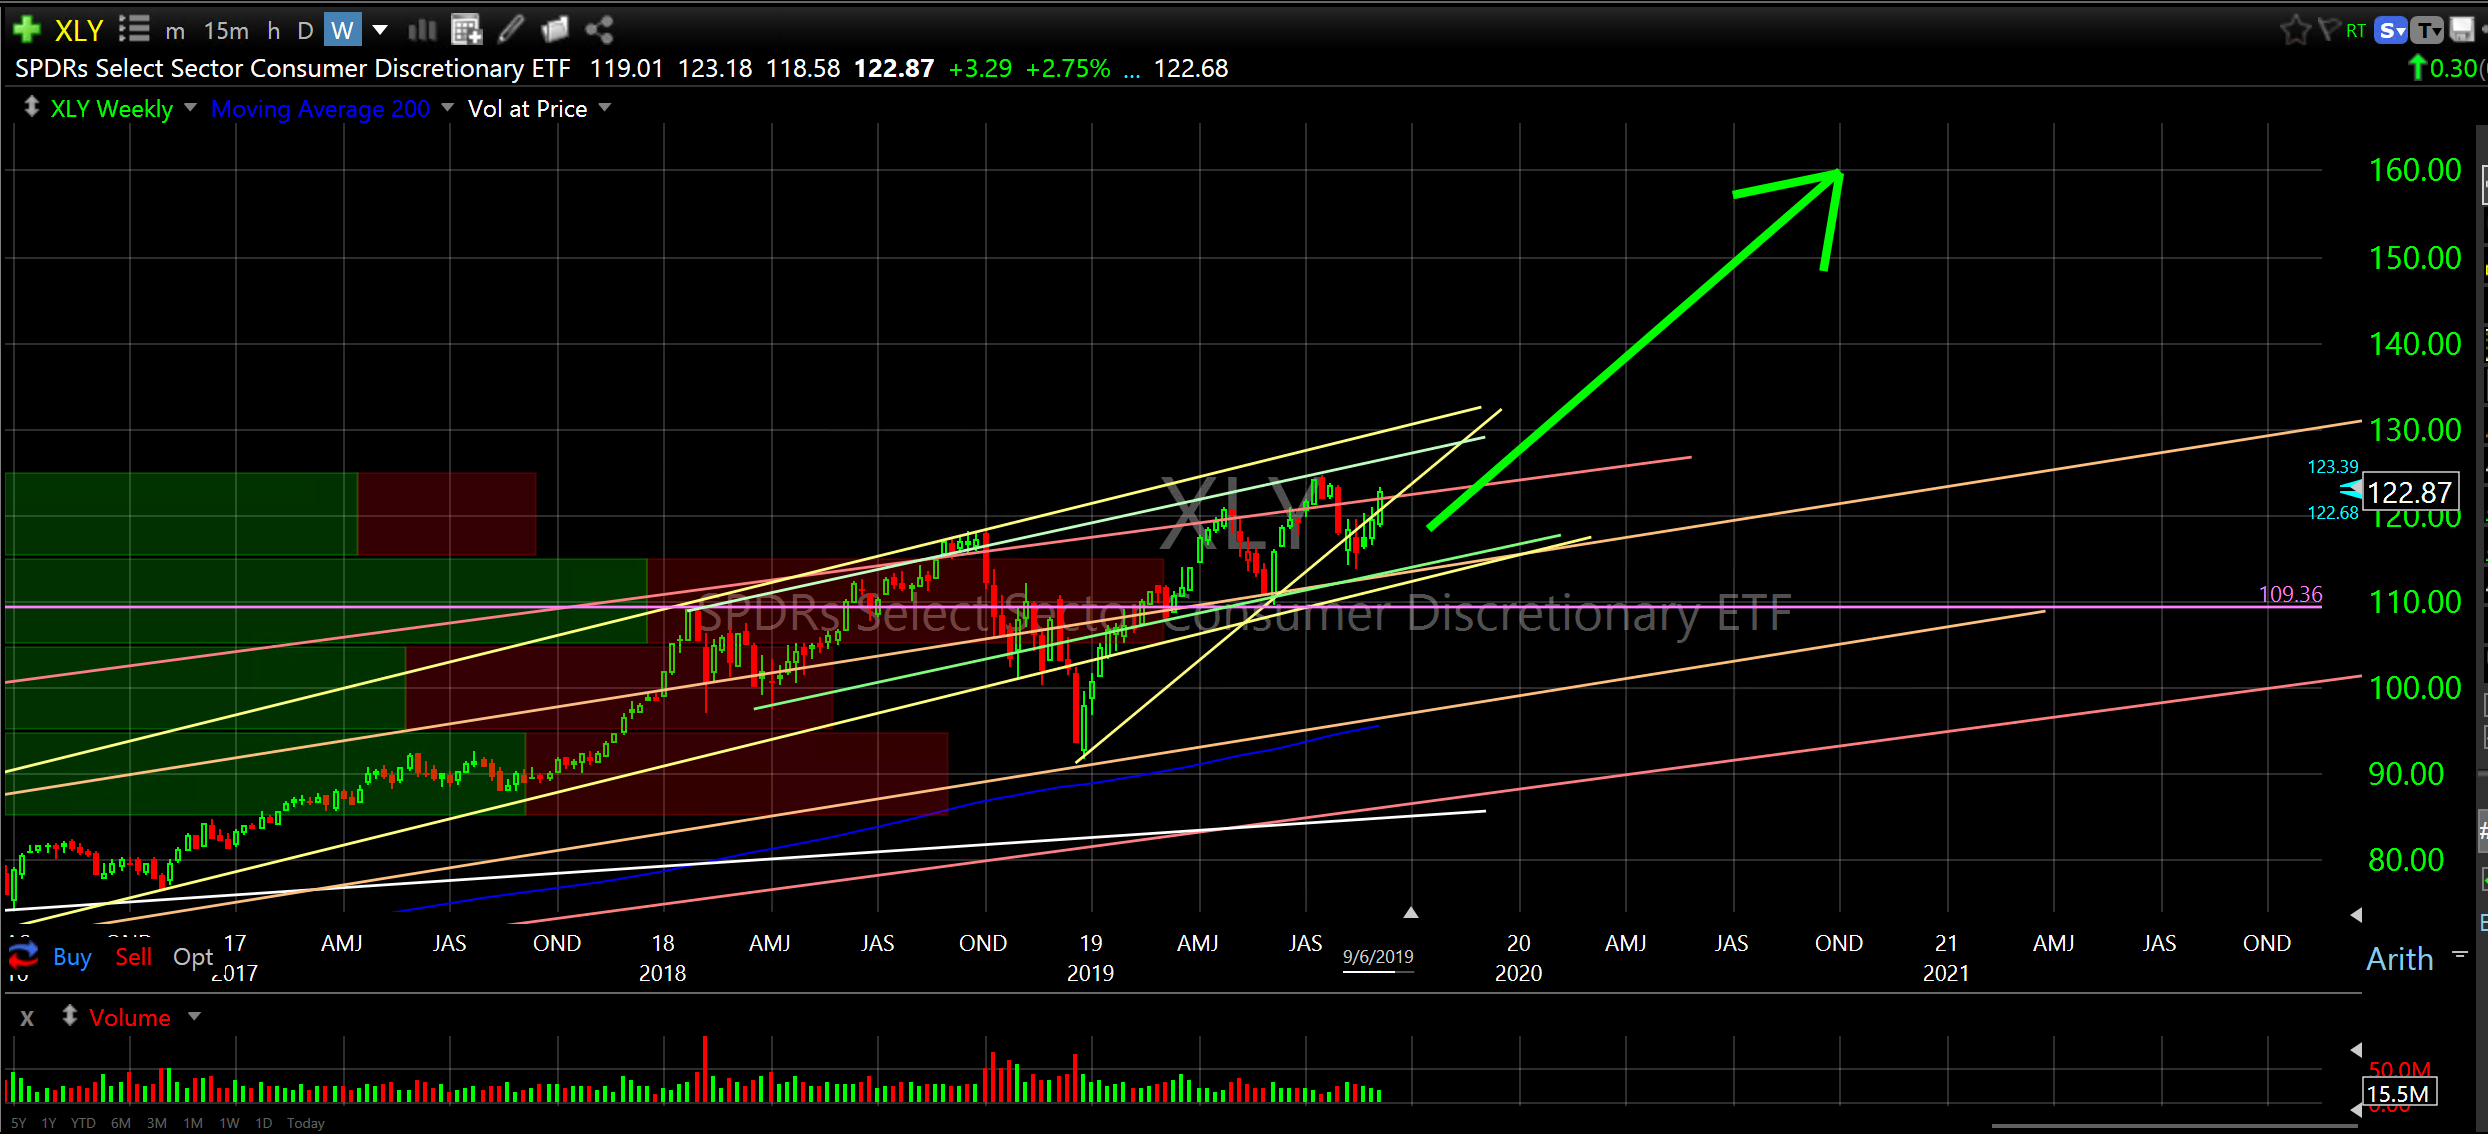
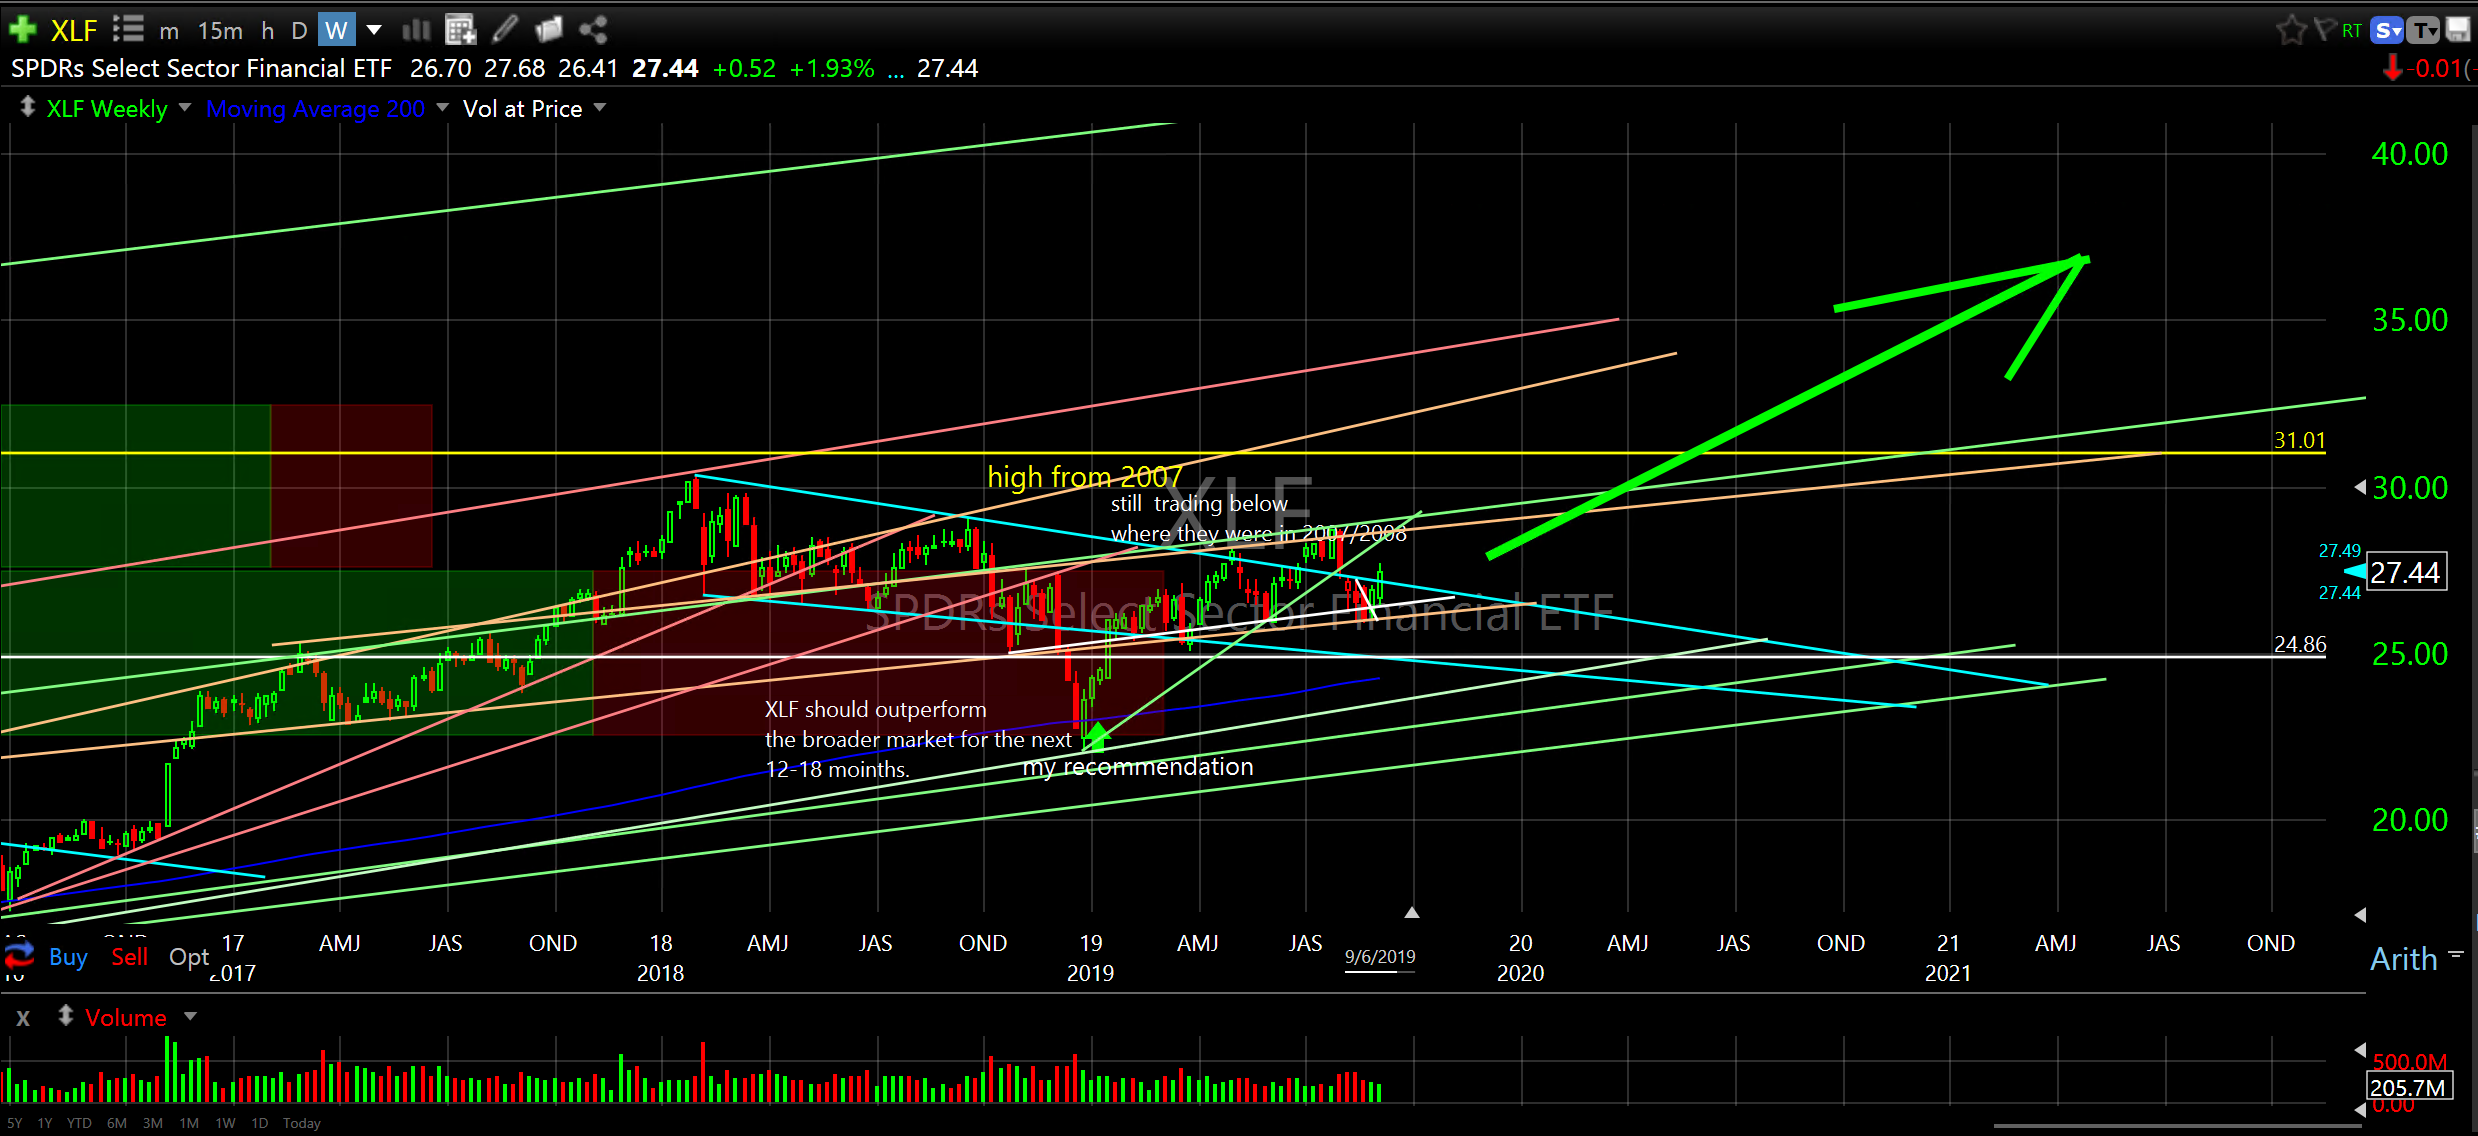
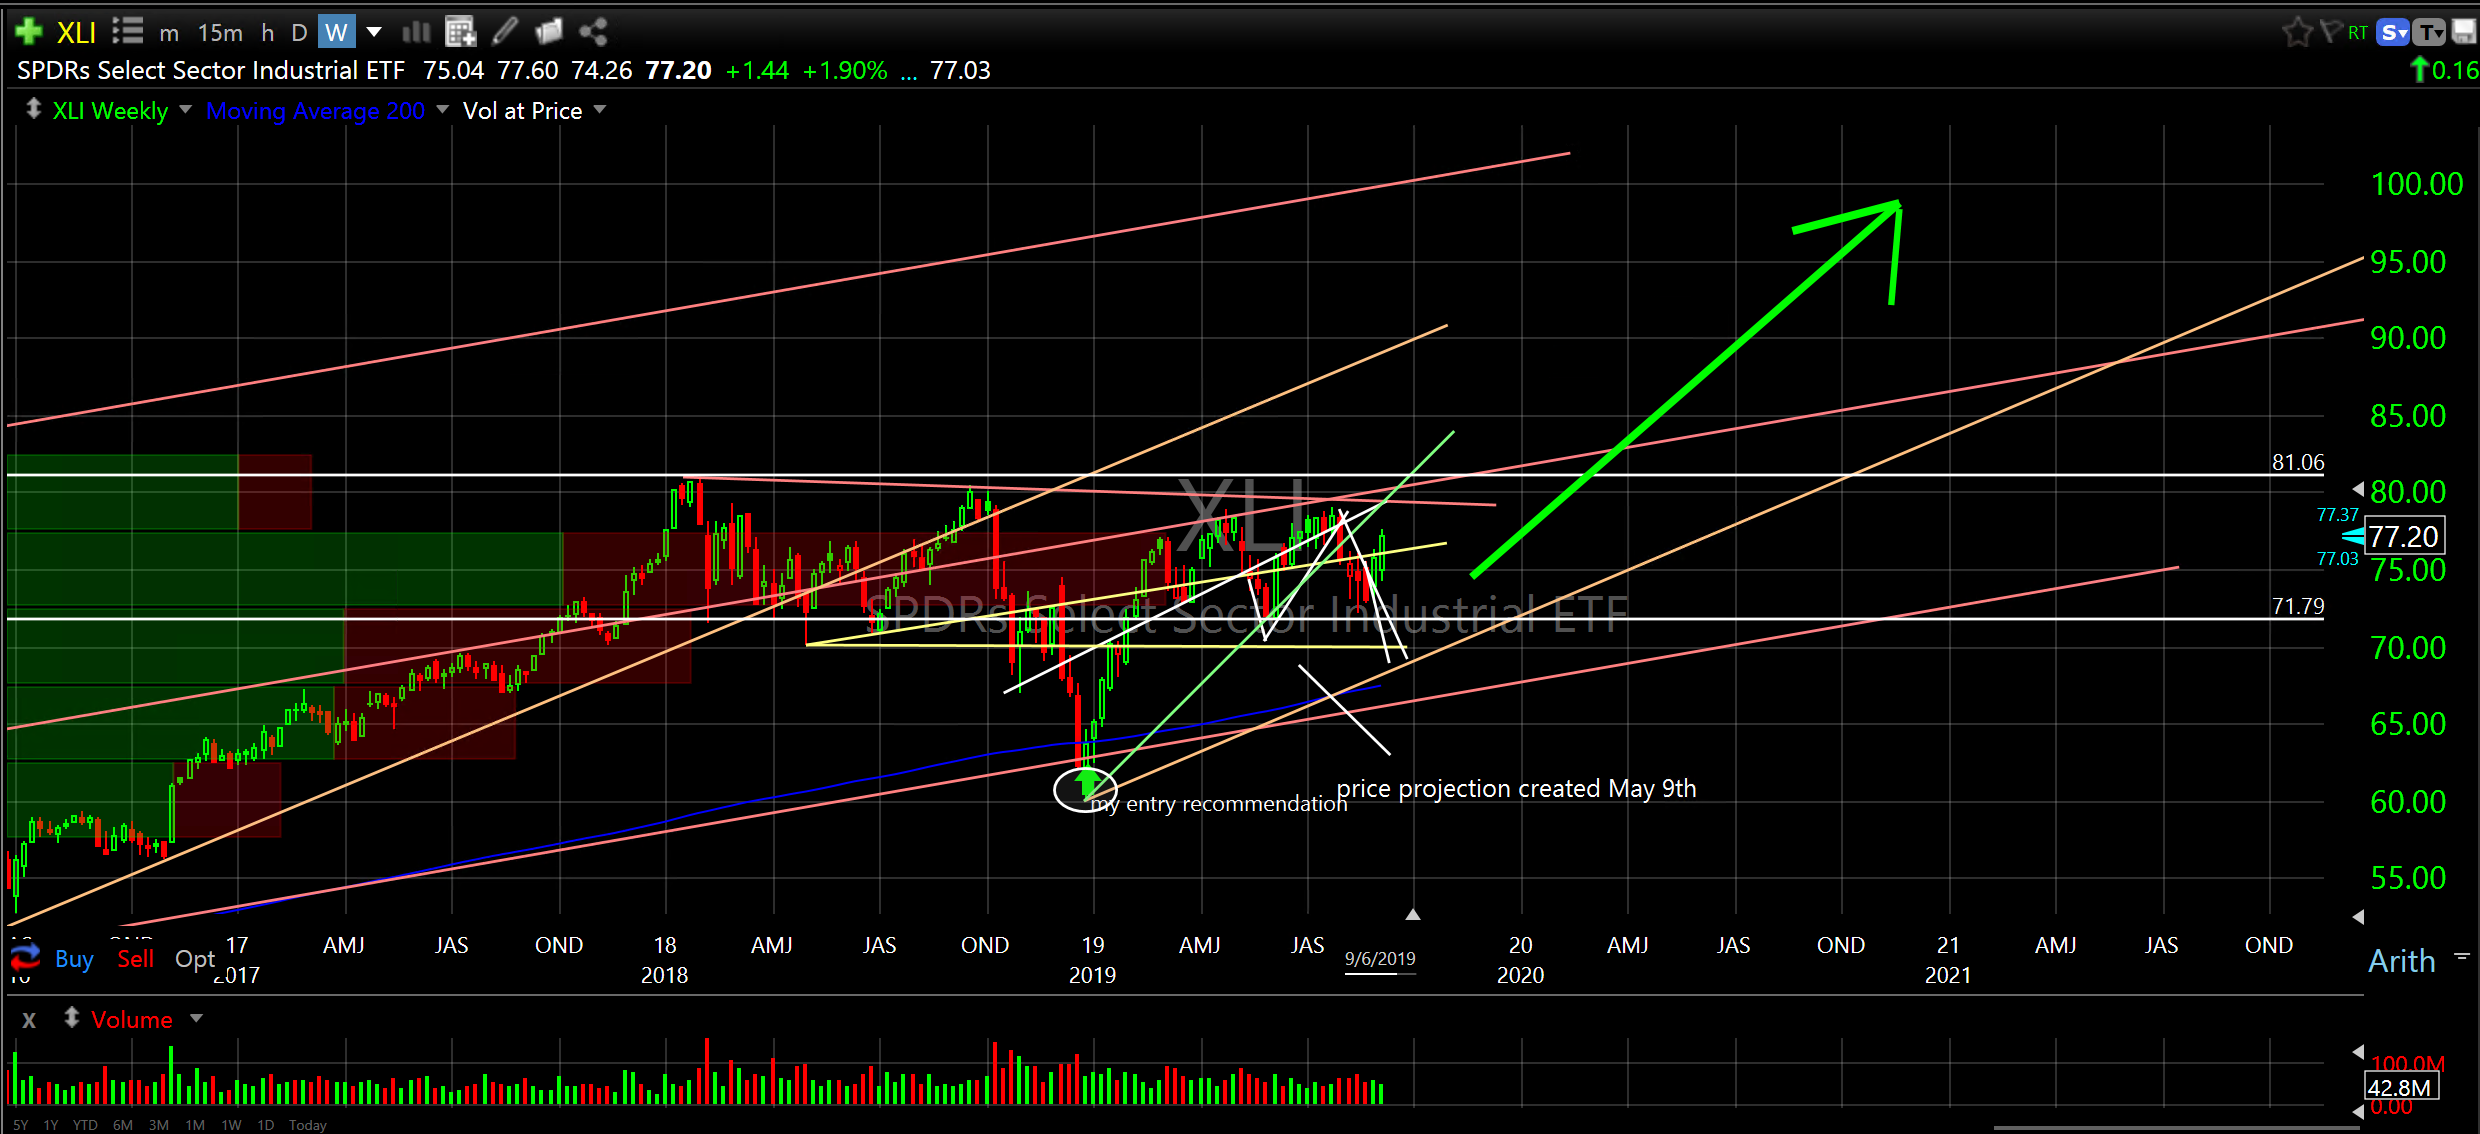
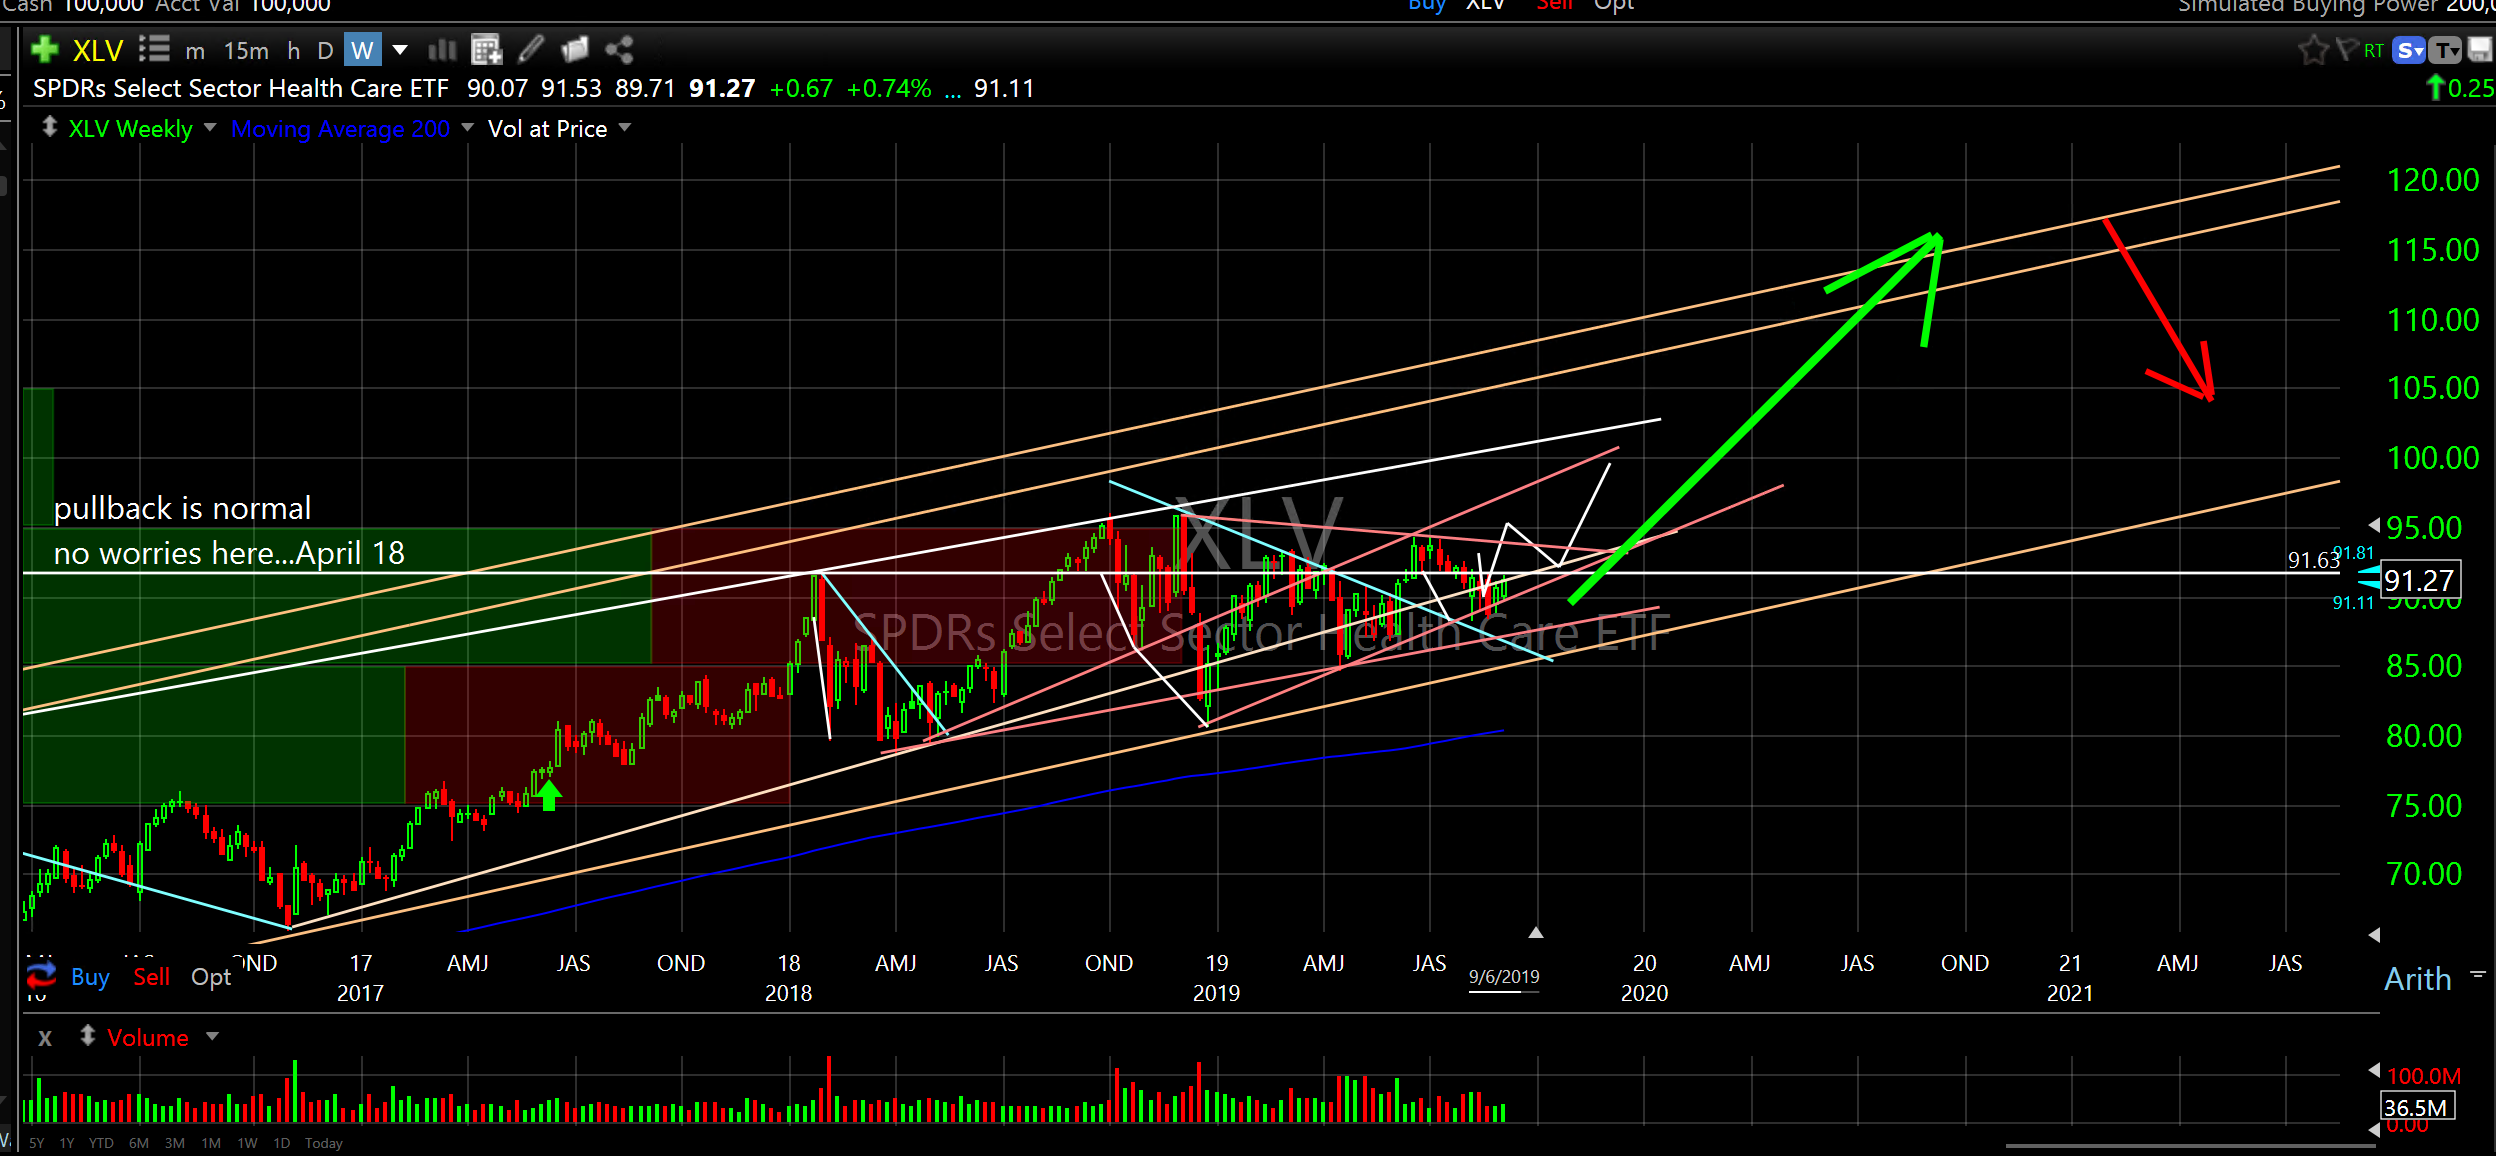
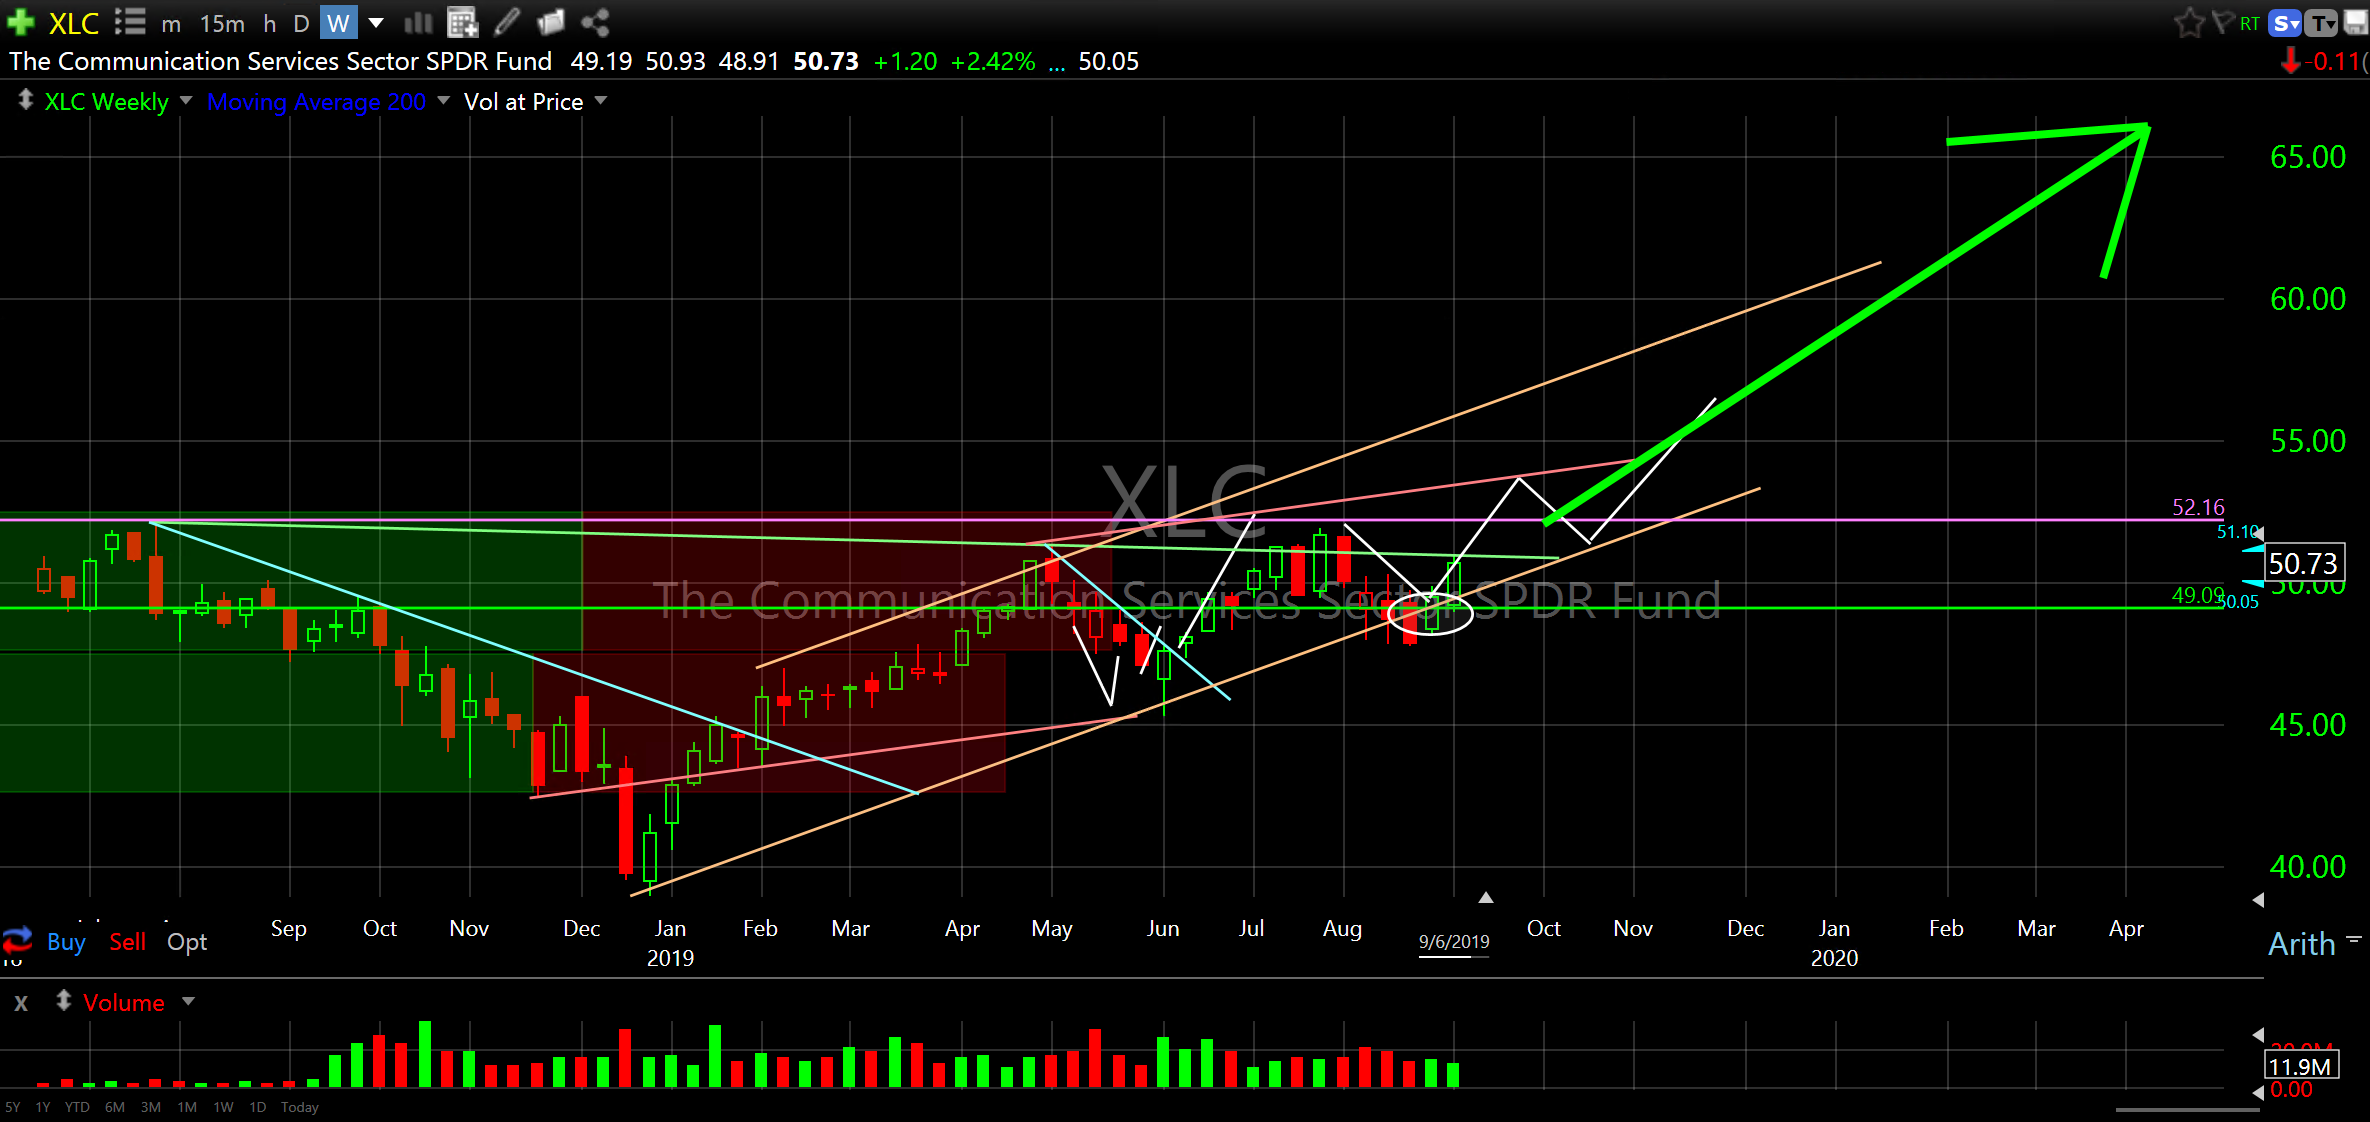
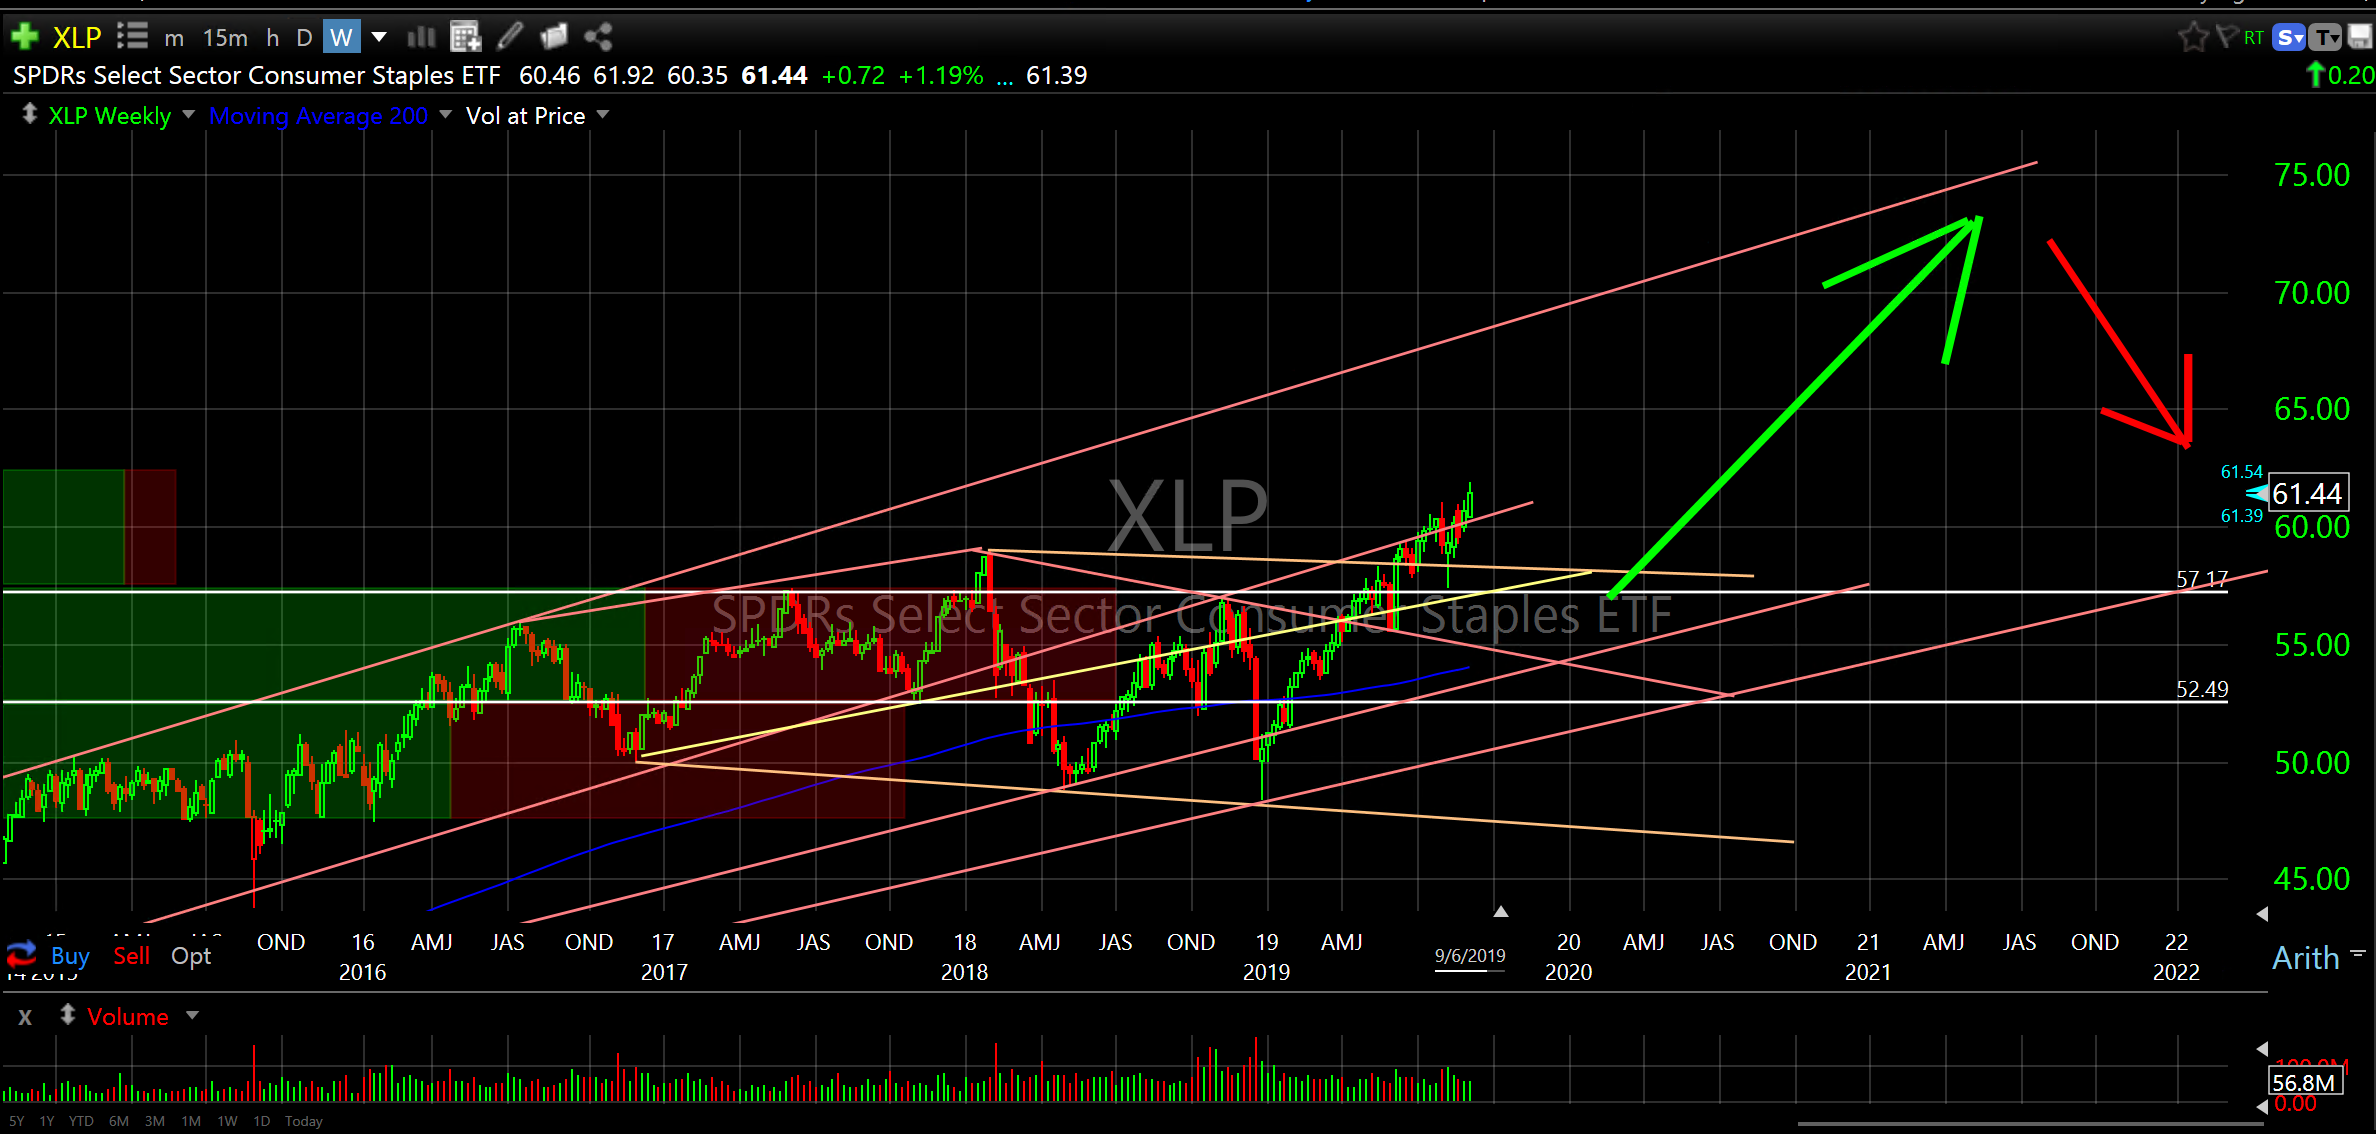
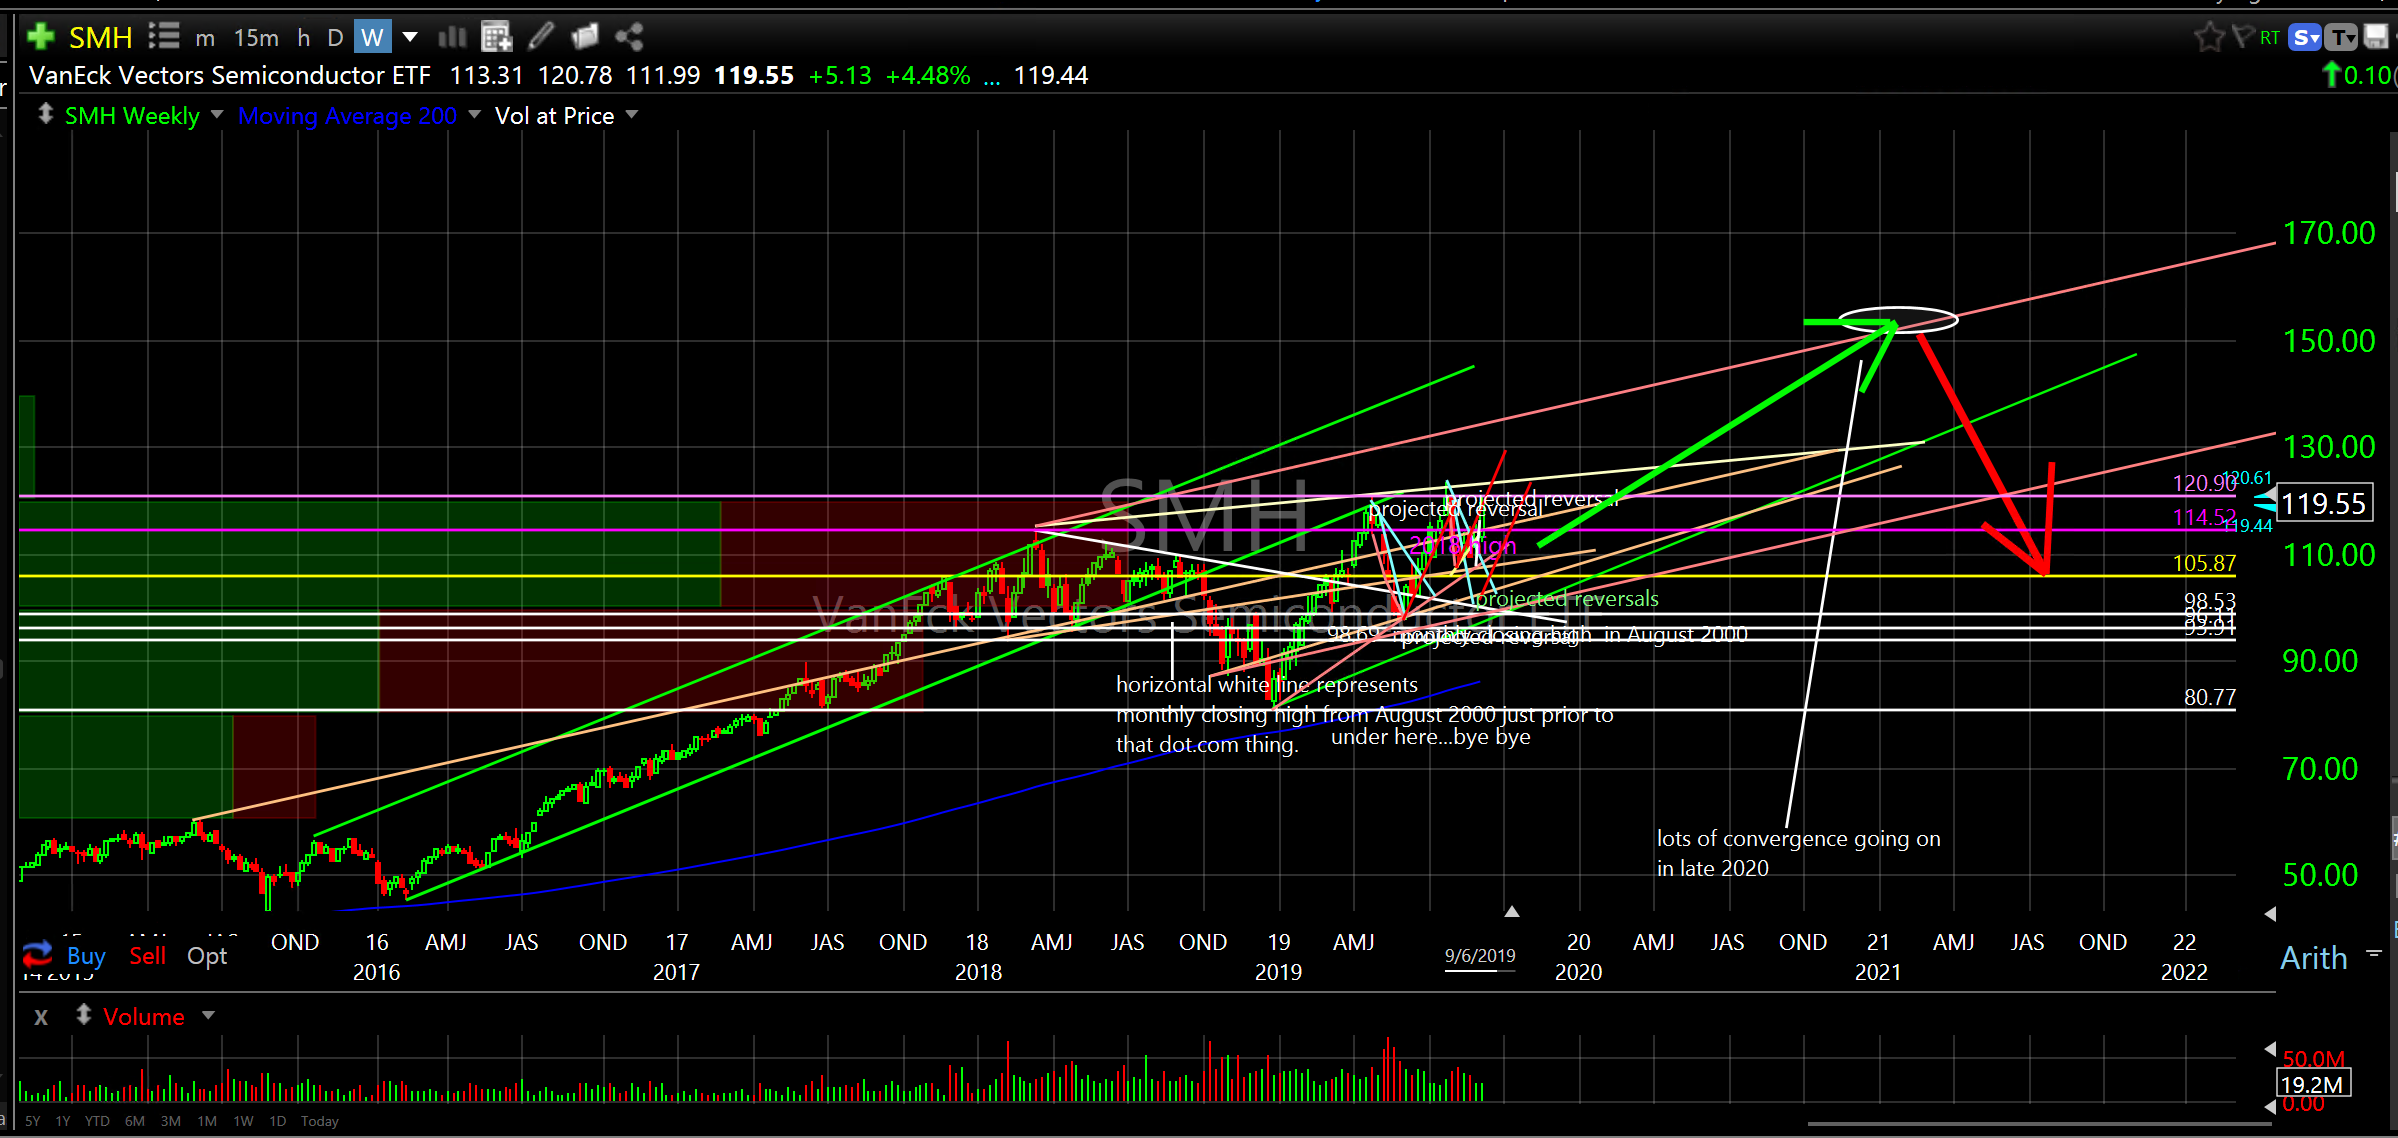
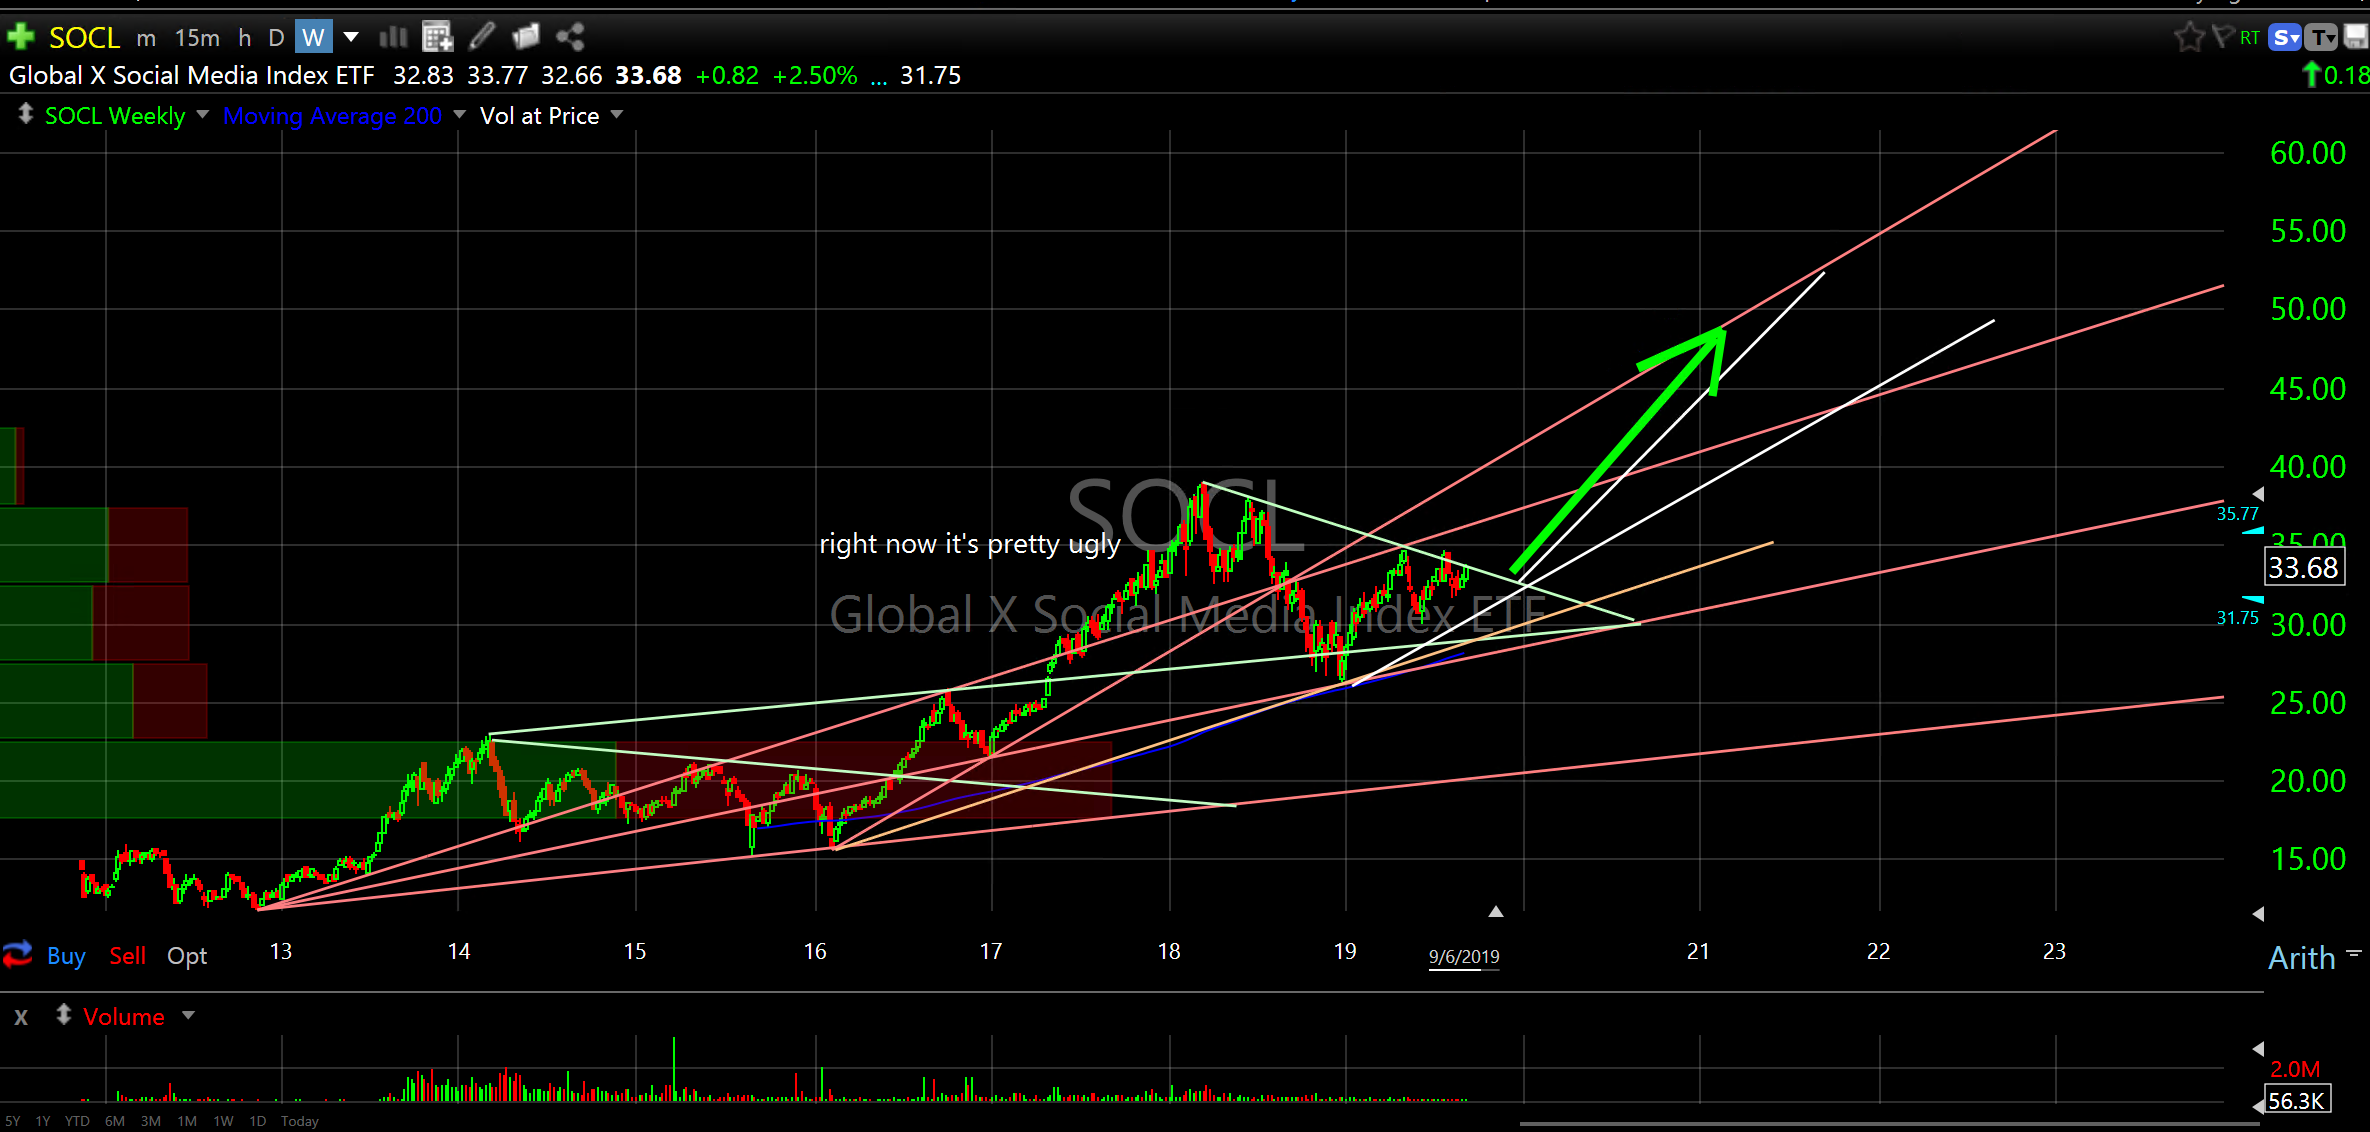
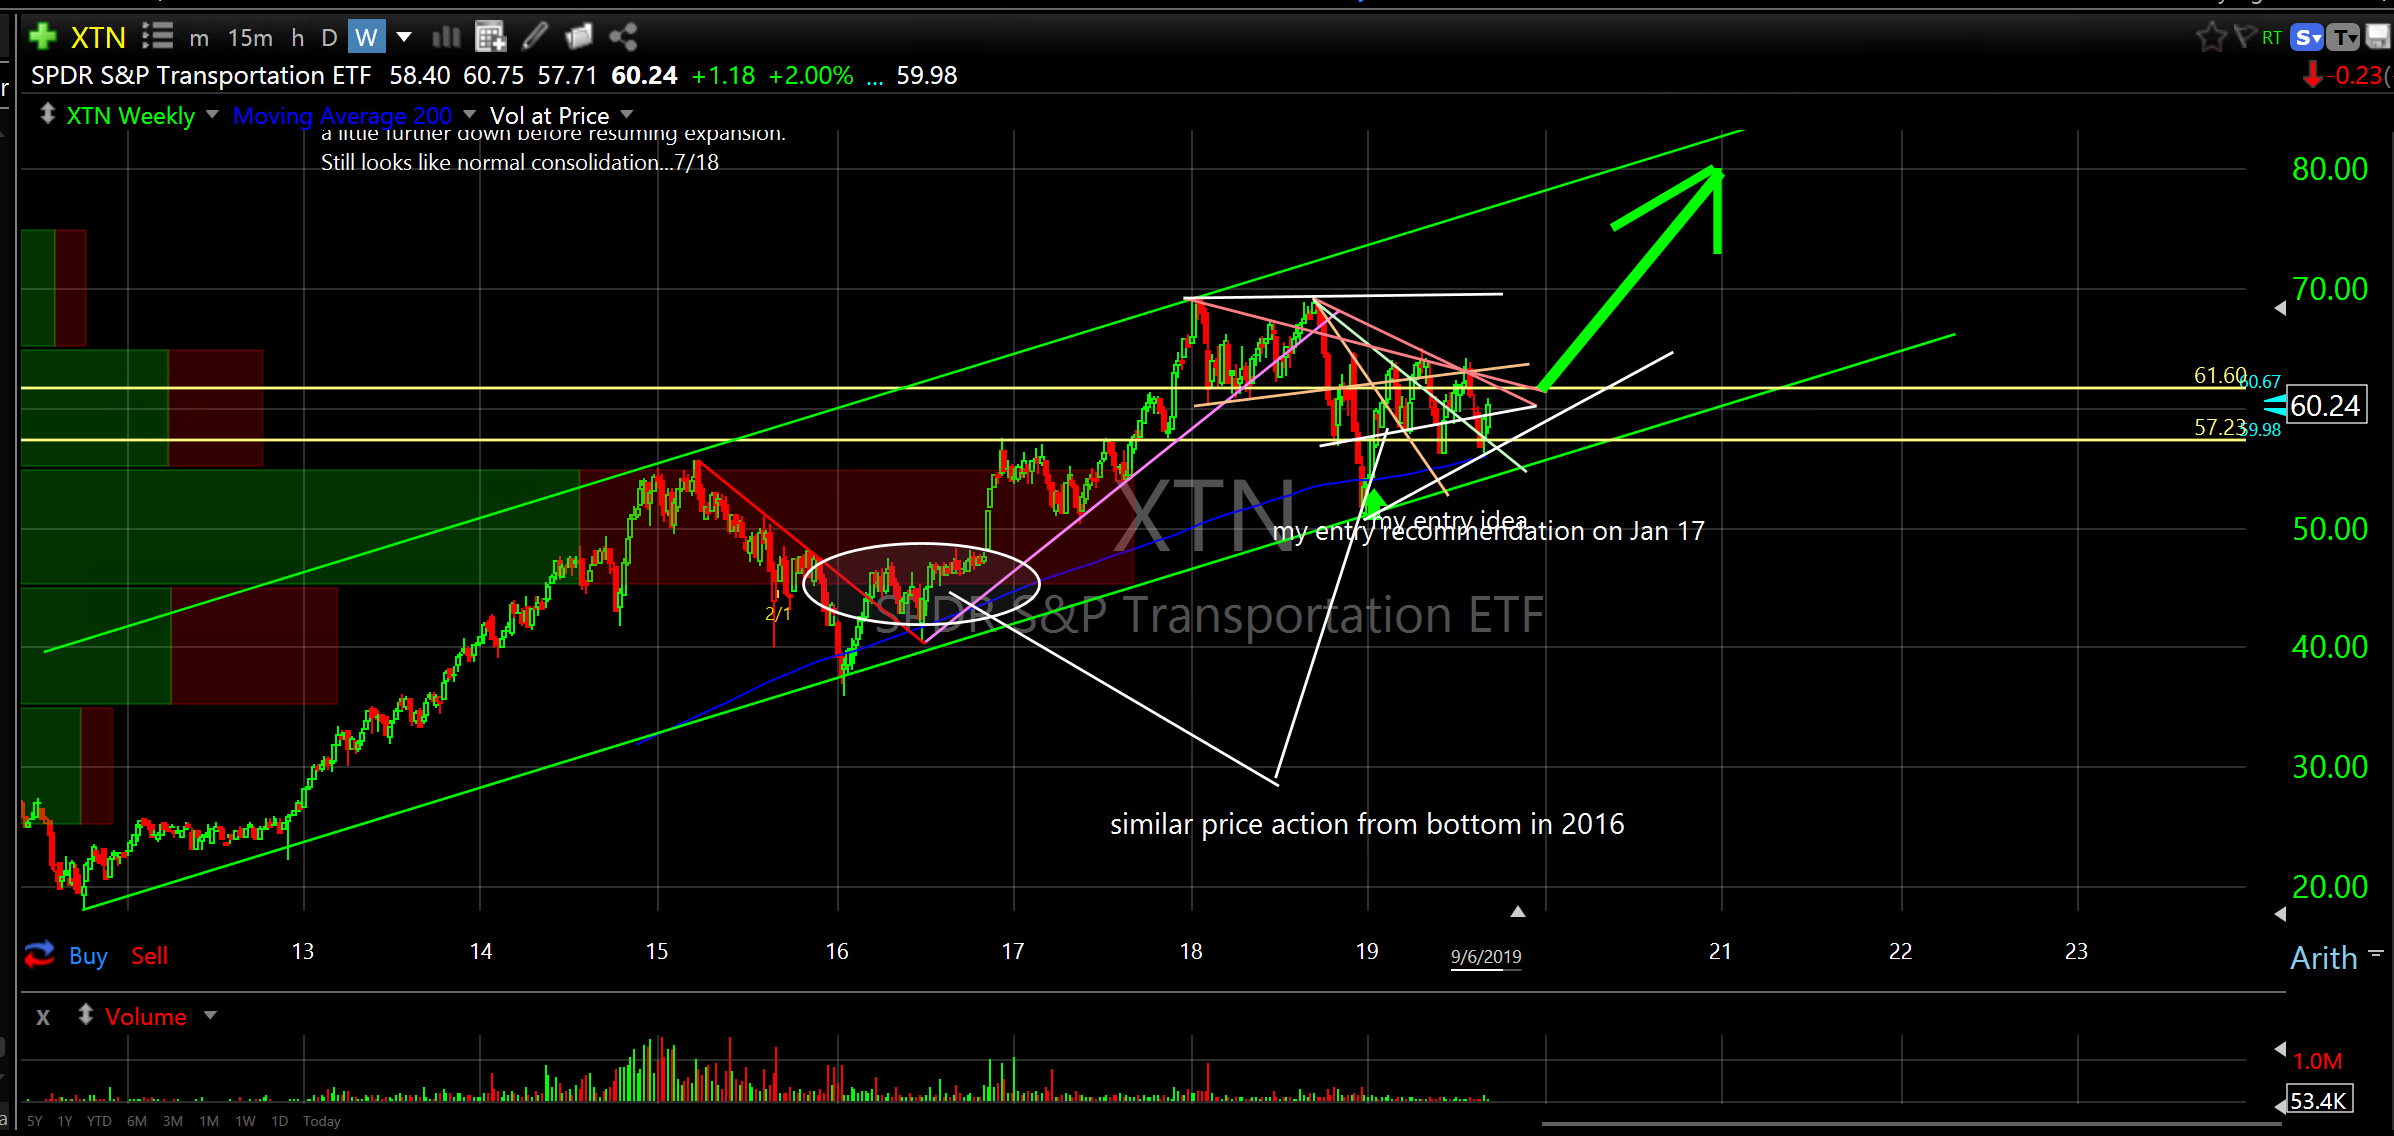
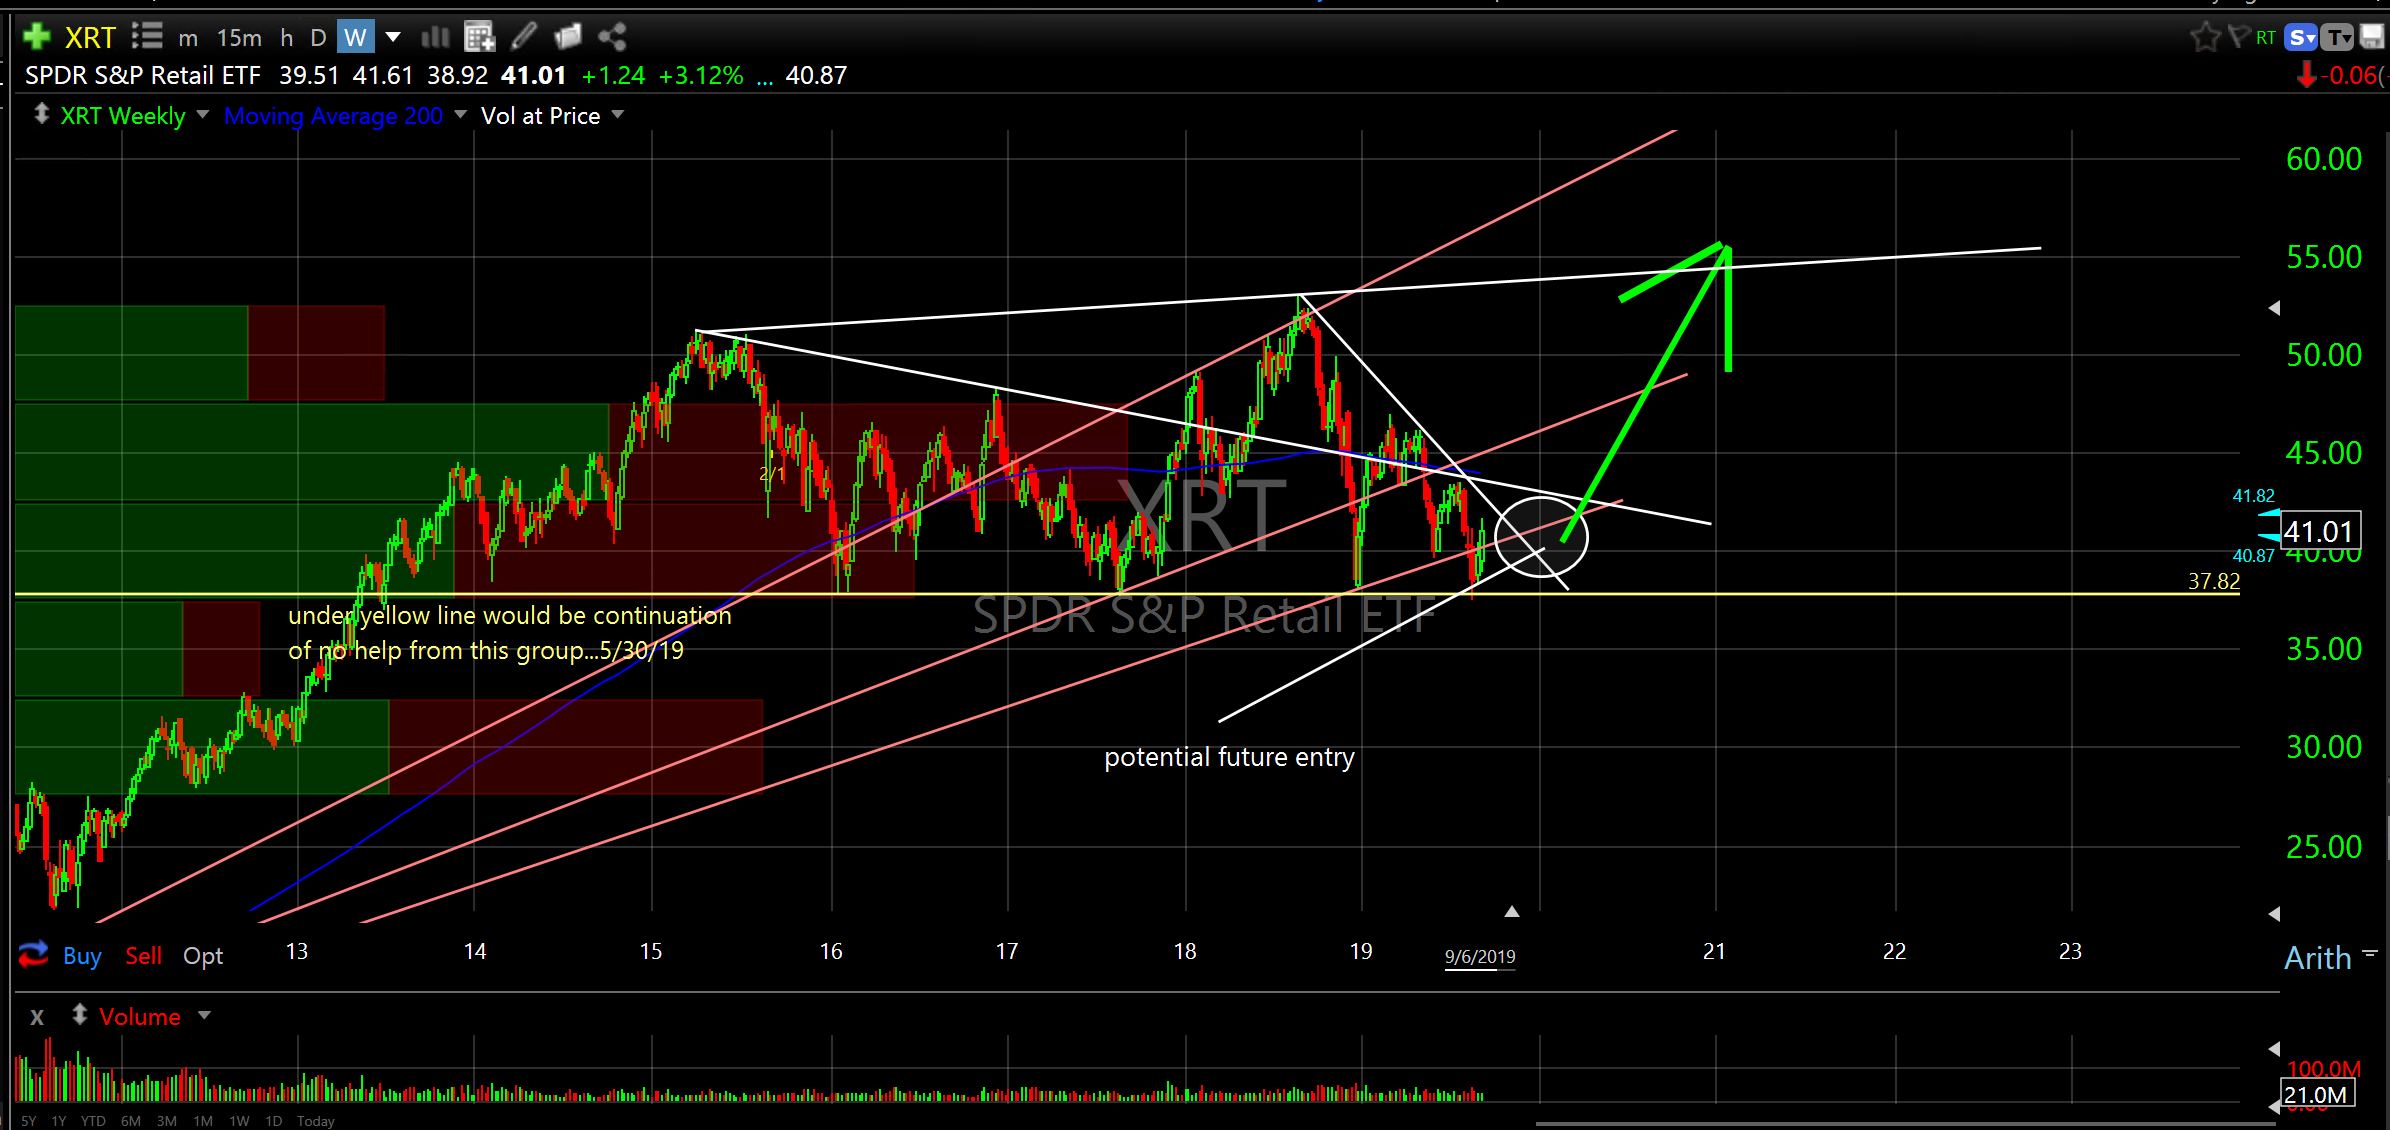
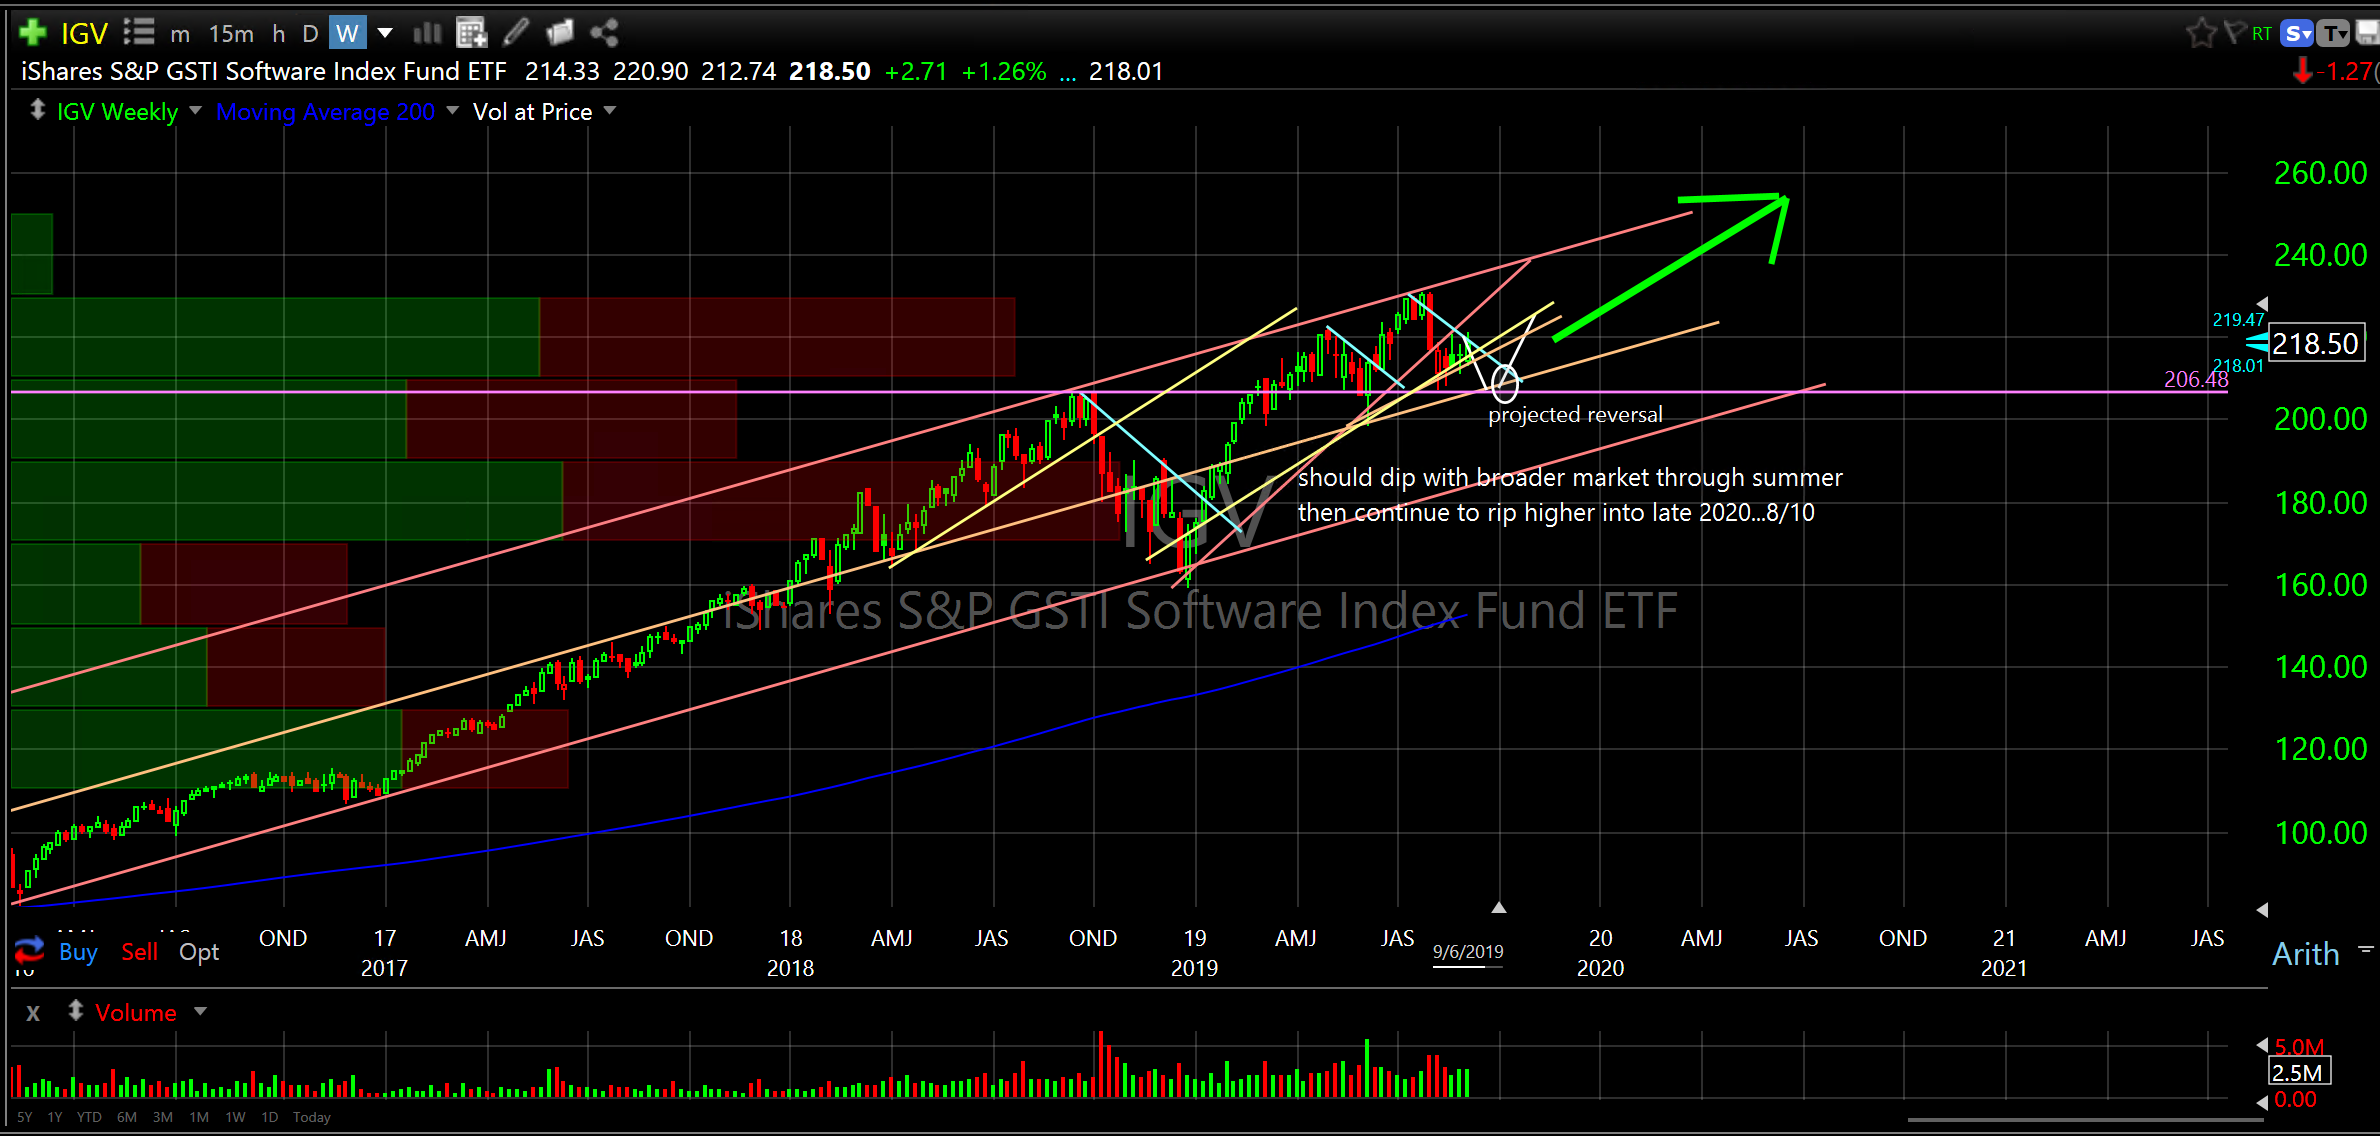
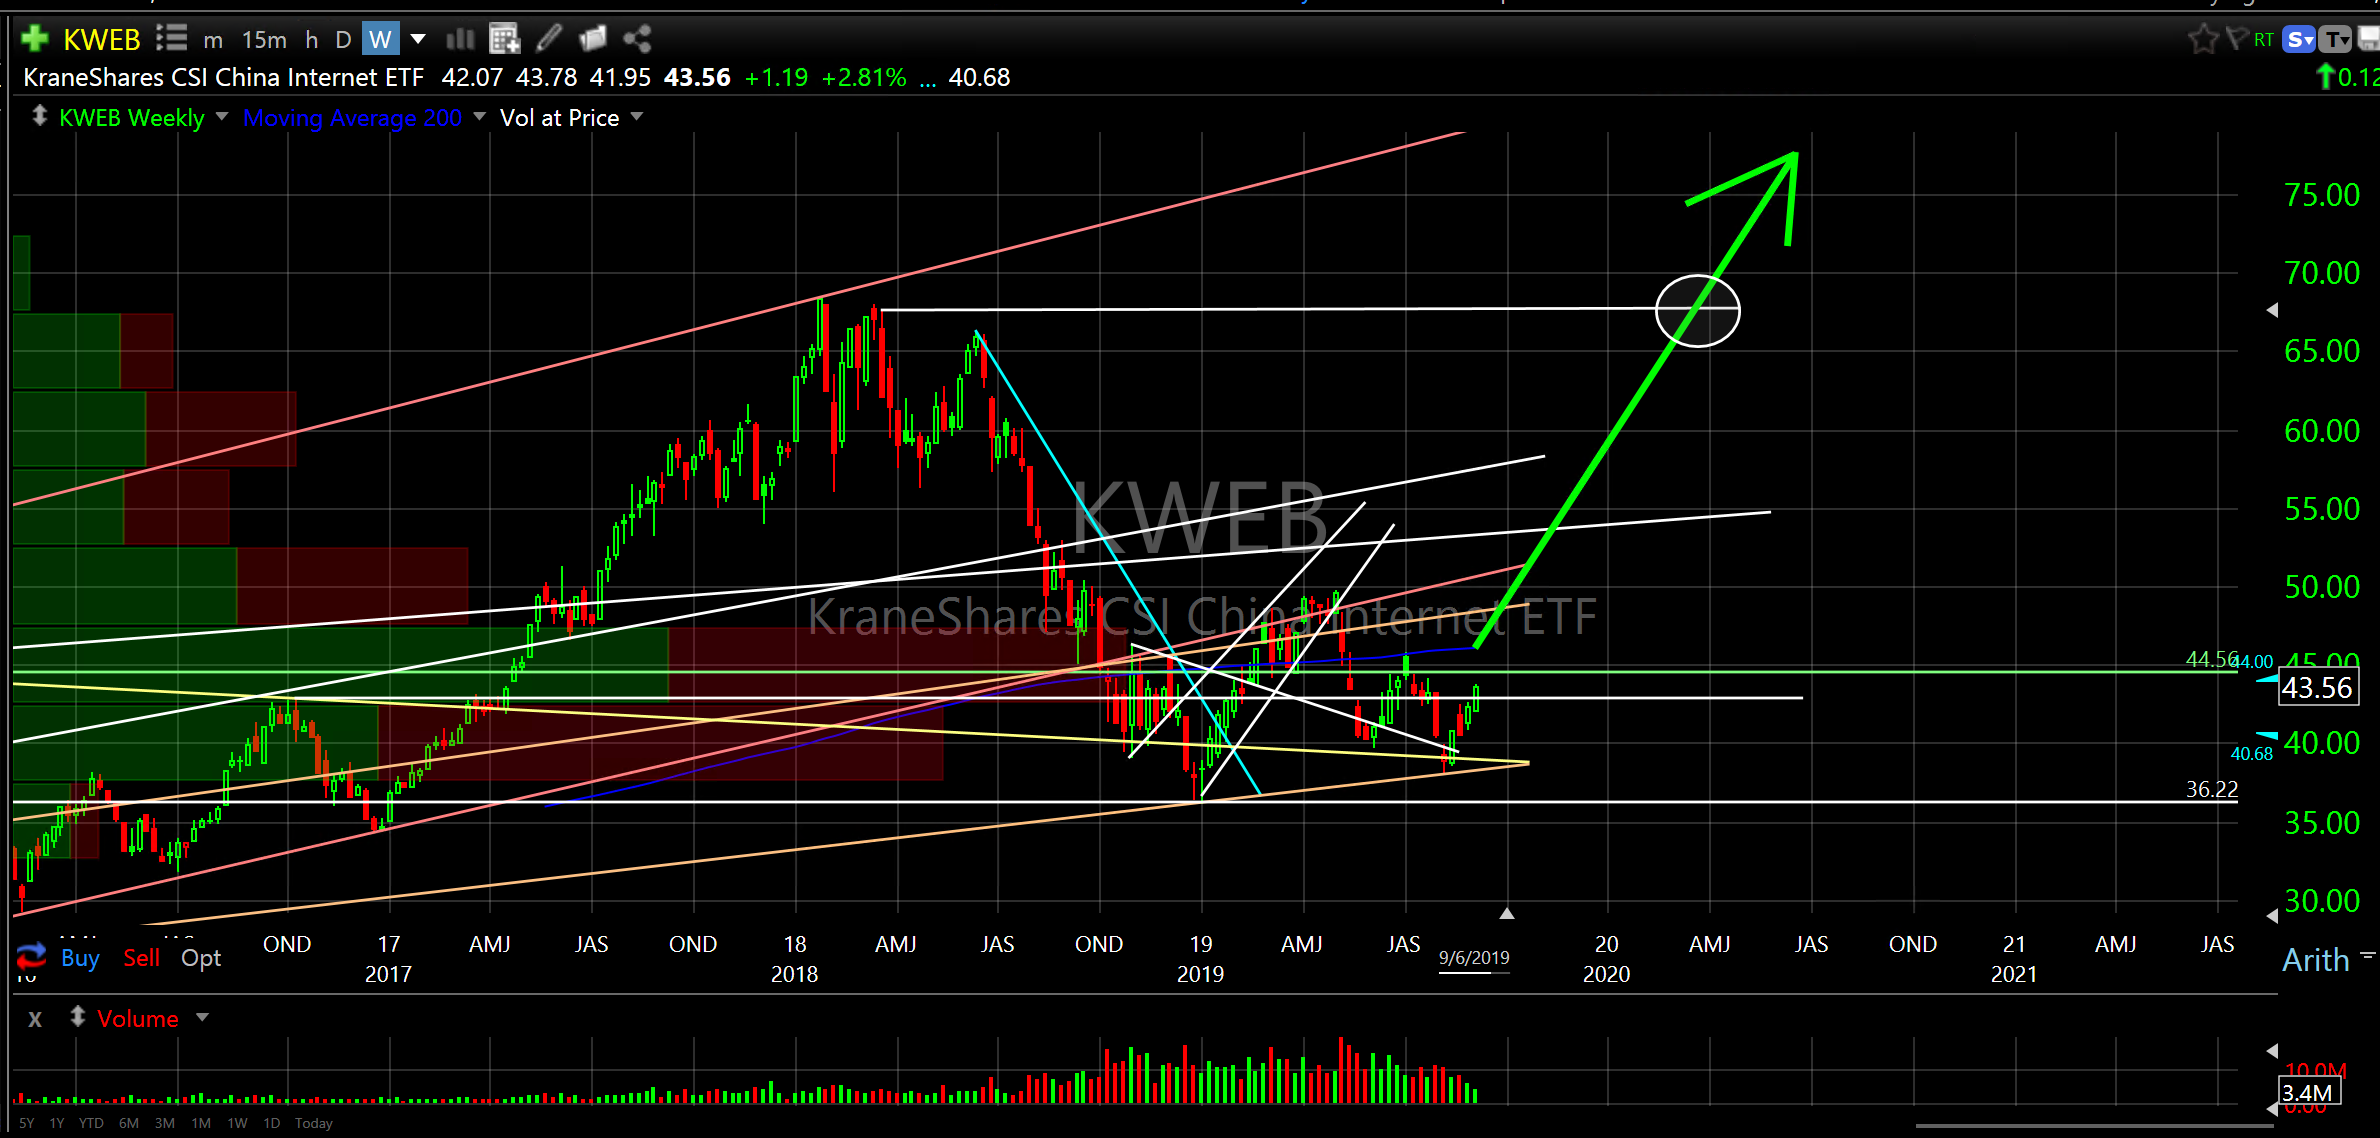
I consider the following ETF’s on the must have “exposure to” list. You can leg into them between now and the end of the year or just buy them all now. See charts for directional bias with green arrow.
This week I show the longer term weekly charts for better perspective. The volatility over the past 18 months forced me to study the markets on a much more granular level this year with shorter time frames which I think just confused people even though I think it was necessary. One of my sons commented…”Dad, your hourly charts are too confusing”. Ha! Good feedback Chris.
The following charts are a wider perspective and members of Sgt Peppers Lovely Charts Club Band…what’s life without humor…
Must Have Exposure To ETF’s…
SPDR’s S&P 500 Trust Series ETF (SPY) weekly
SPDR Dow Jones Industrial Average ETF (DIA) weekly
iShares Russell 2000 Index Fund ETF (IWM) weekly
Invesco QQQTrust Ser 1 (QQQ) weekly
SPDR’s Select Sector Technology ETF (XLK) weekly
SPDR’s Select Sector Consumer Discretionary ETF (XLY) weekly
SPDR’s Select Sector Financial ETF (XLF) weekly
SPDR’s Select Sector Industrial ETF (XLI) weekly
SPDR’s Select Sector Health Care ETF (XLV) weekly
The Communications Services Sector SPDR Fund (XLC) weekly
SPDR’s Select Sector Consumer Staples ETF (XLP) weekly
VanEck Vectors Semiconductor ETF (SMH) weekly
Global X Social Media Index ETF (SOCL) weekly
SPDR S&P Transportation ETF (XTN) weekly
SPDR S&P Retail ETF (XRT) weekly
iShares S&P GST Software Index Fund ETF (IGV) weekly
KraneShares CSI China Internet ETF (KWEB) weekly
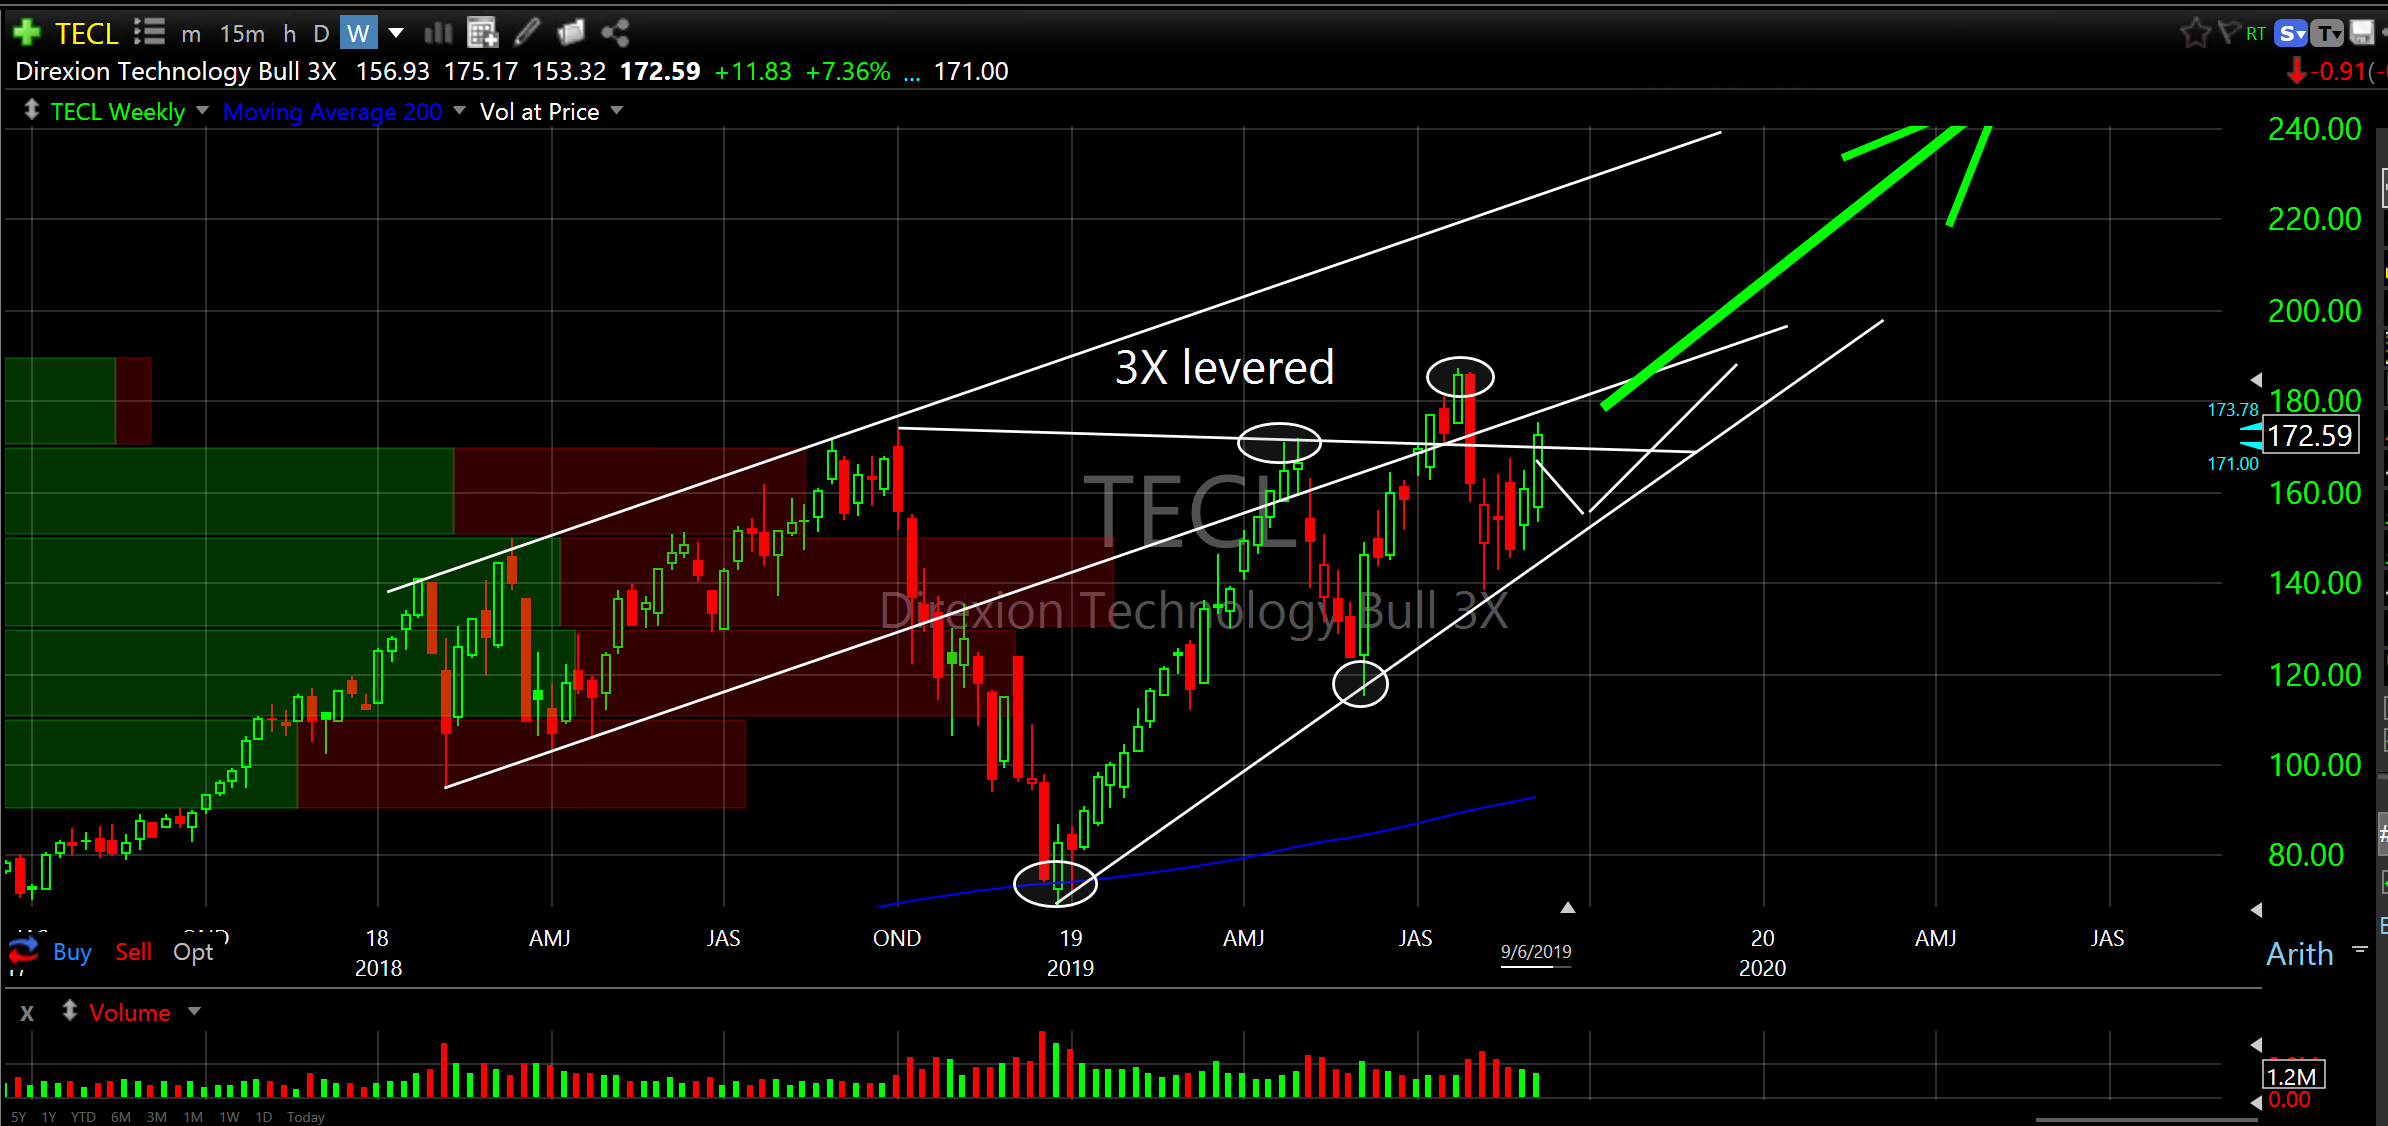
and if you really want to get it on…3X levered…TECL
Direxion Technology Bull 3X (TECL) weekly
There are more but this is a good start.
Gold, Energy and Yield Outlook
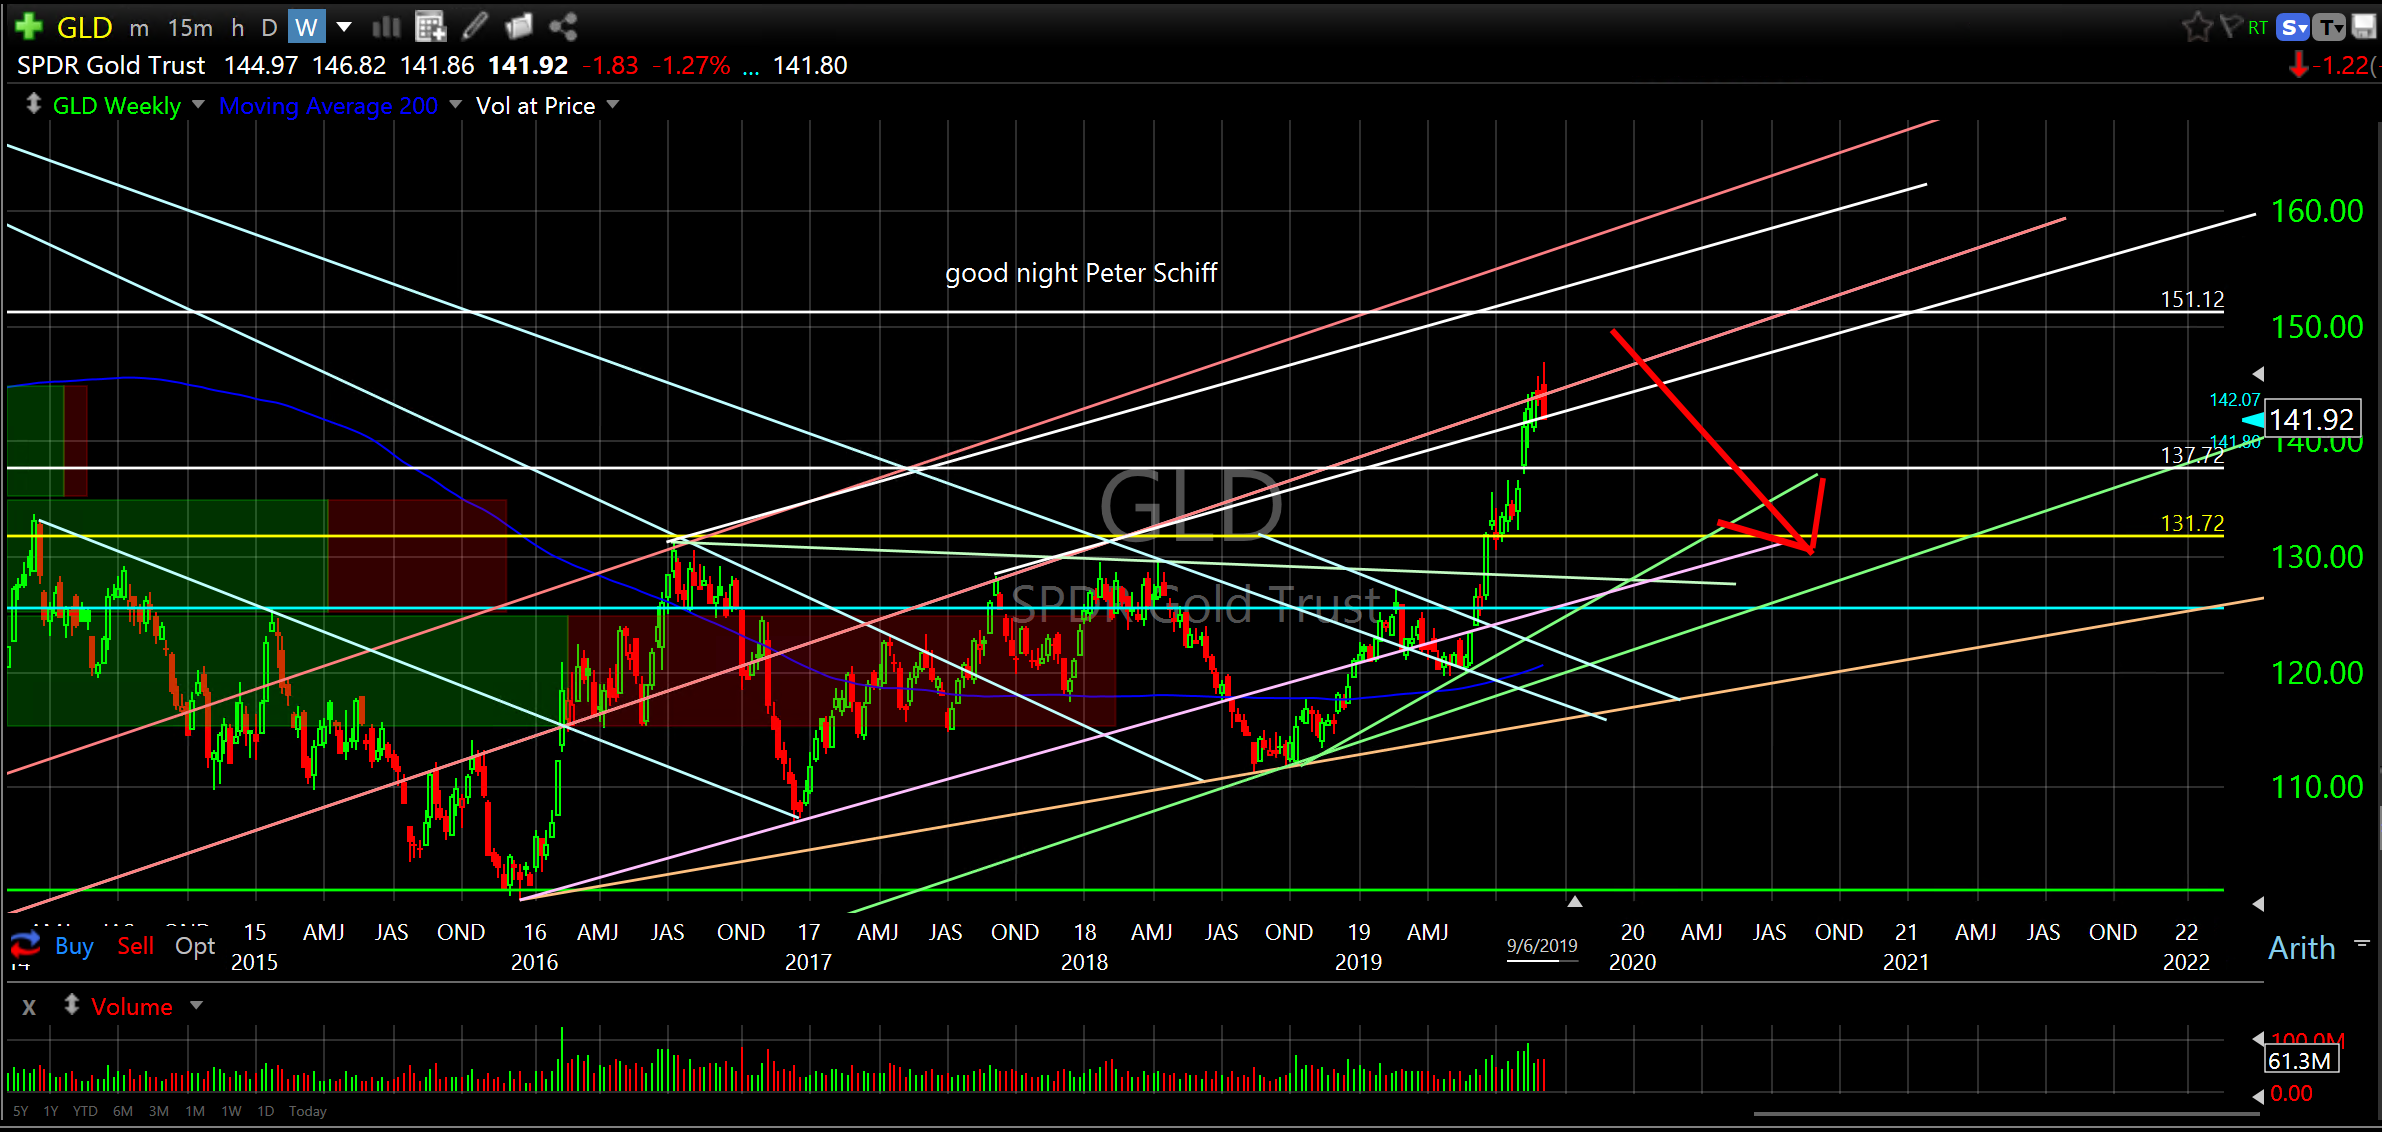
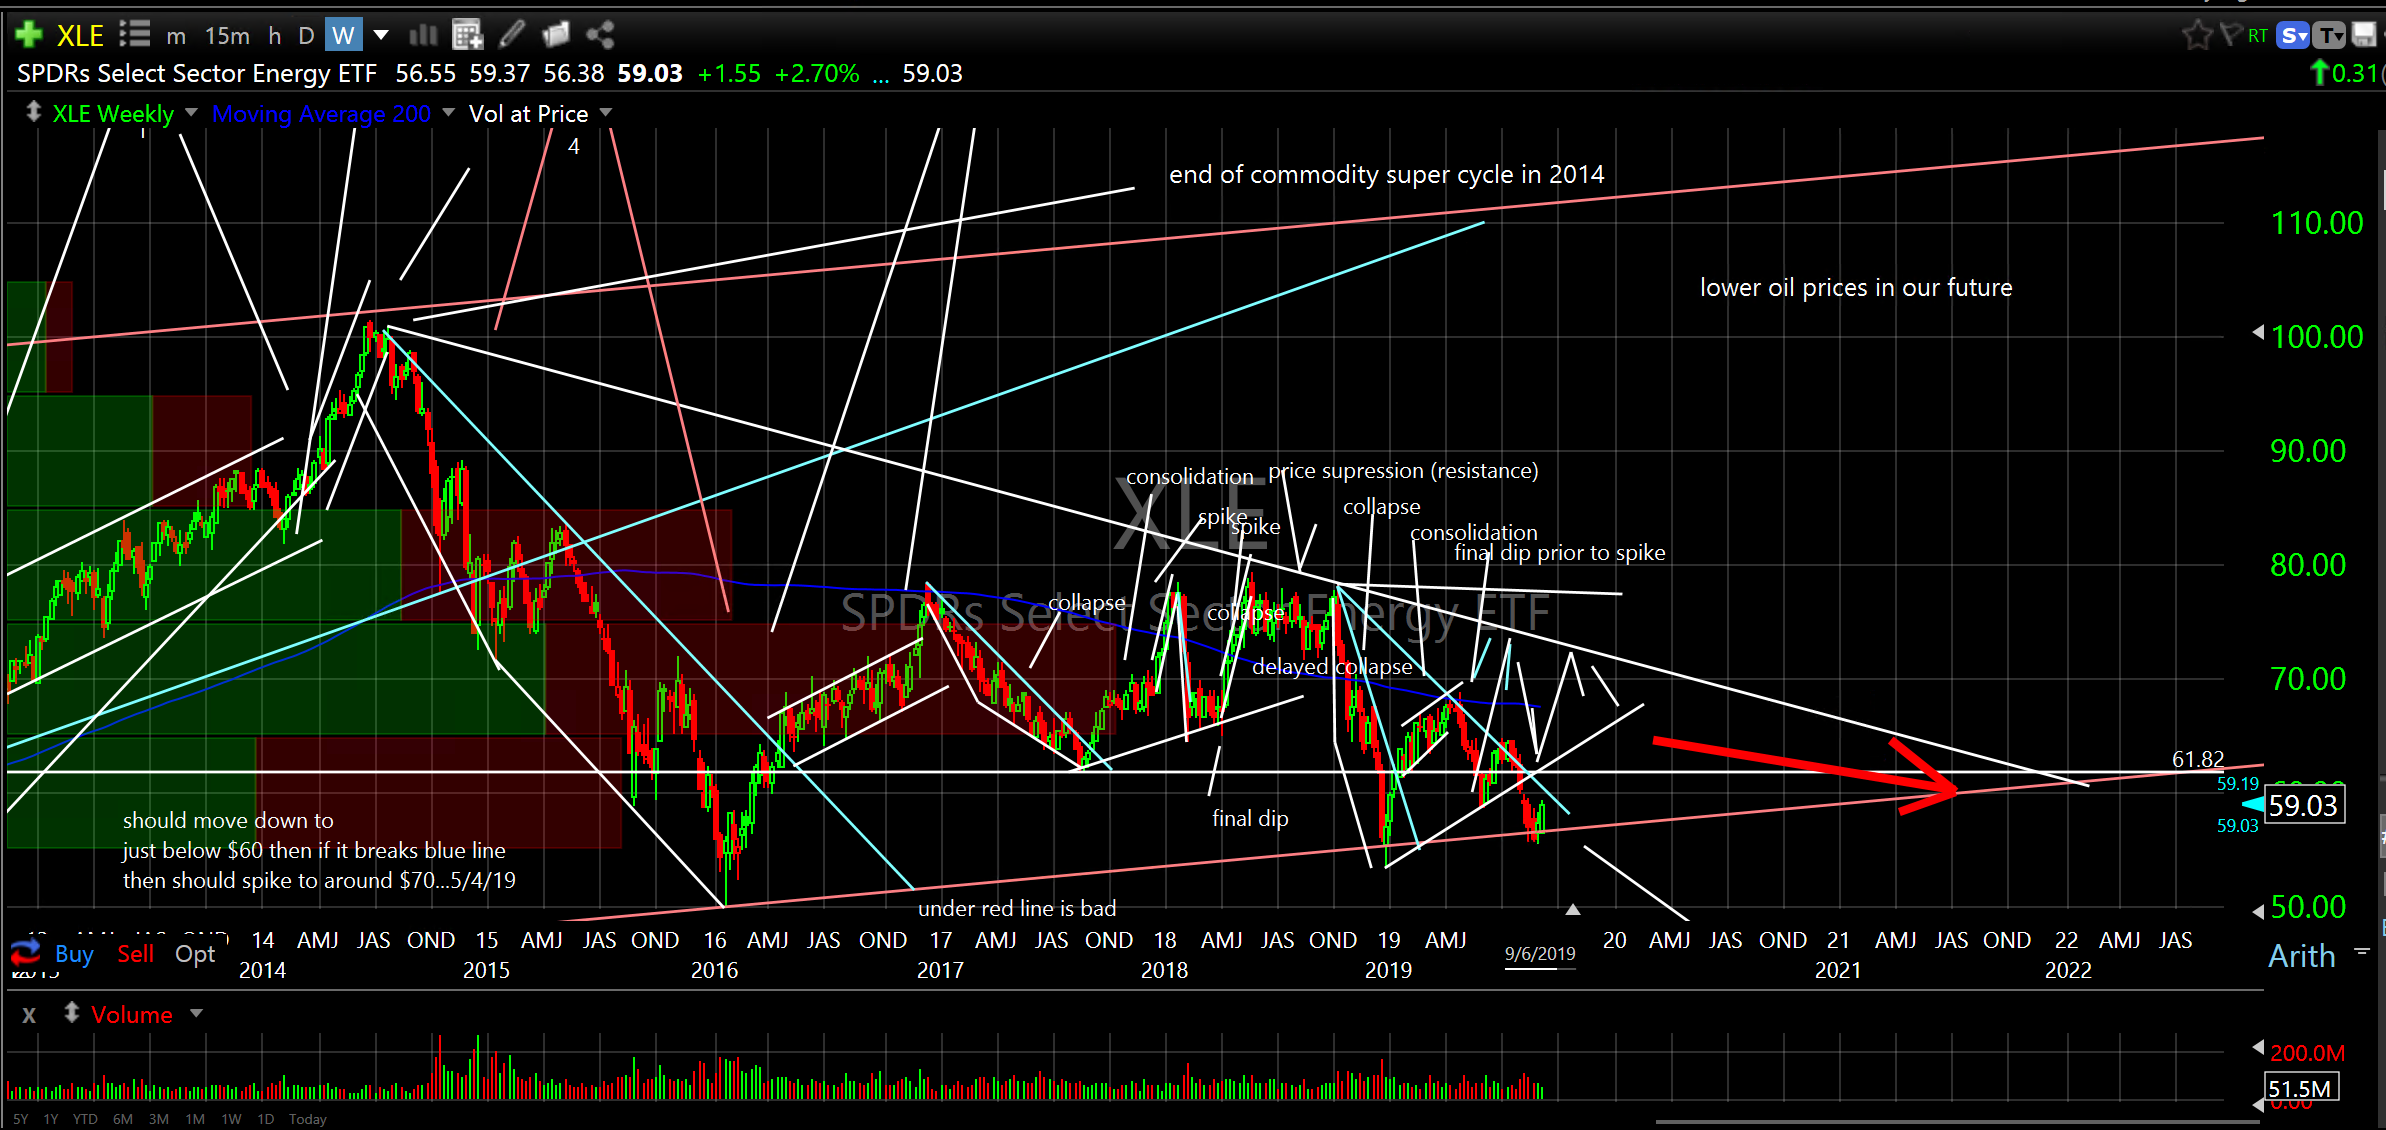
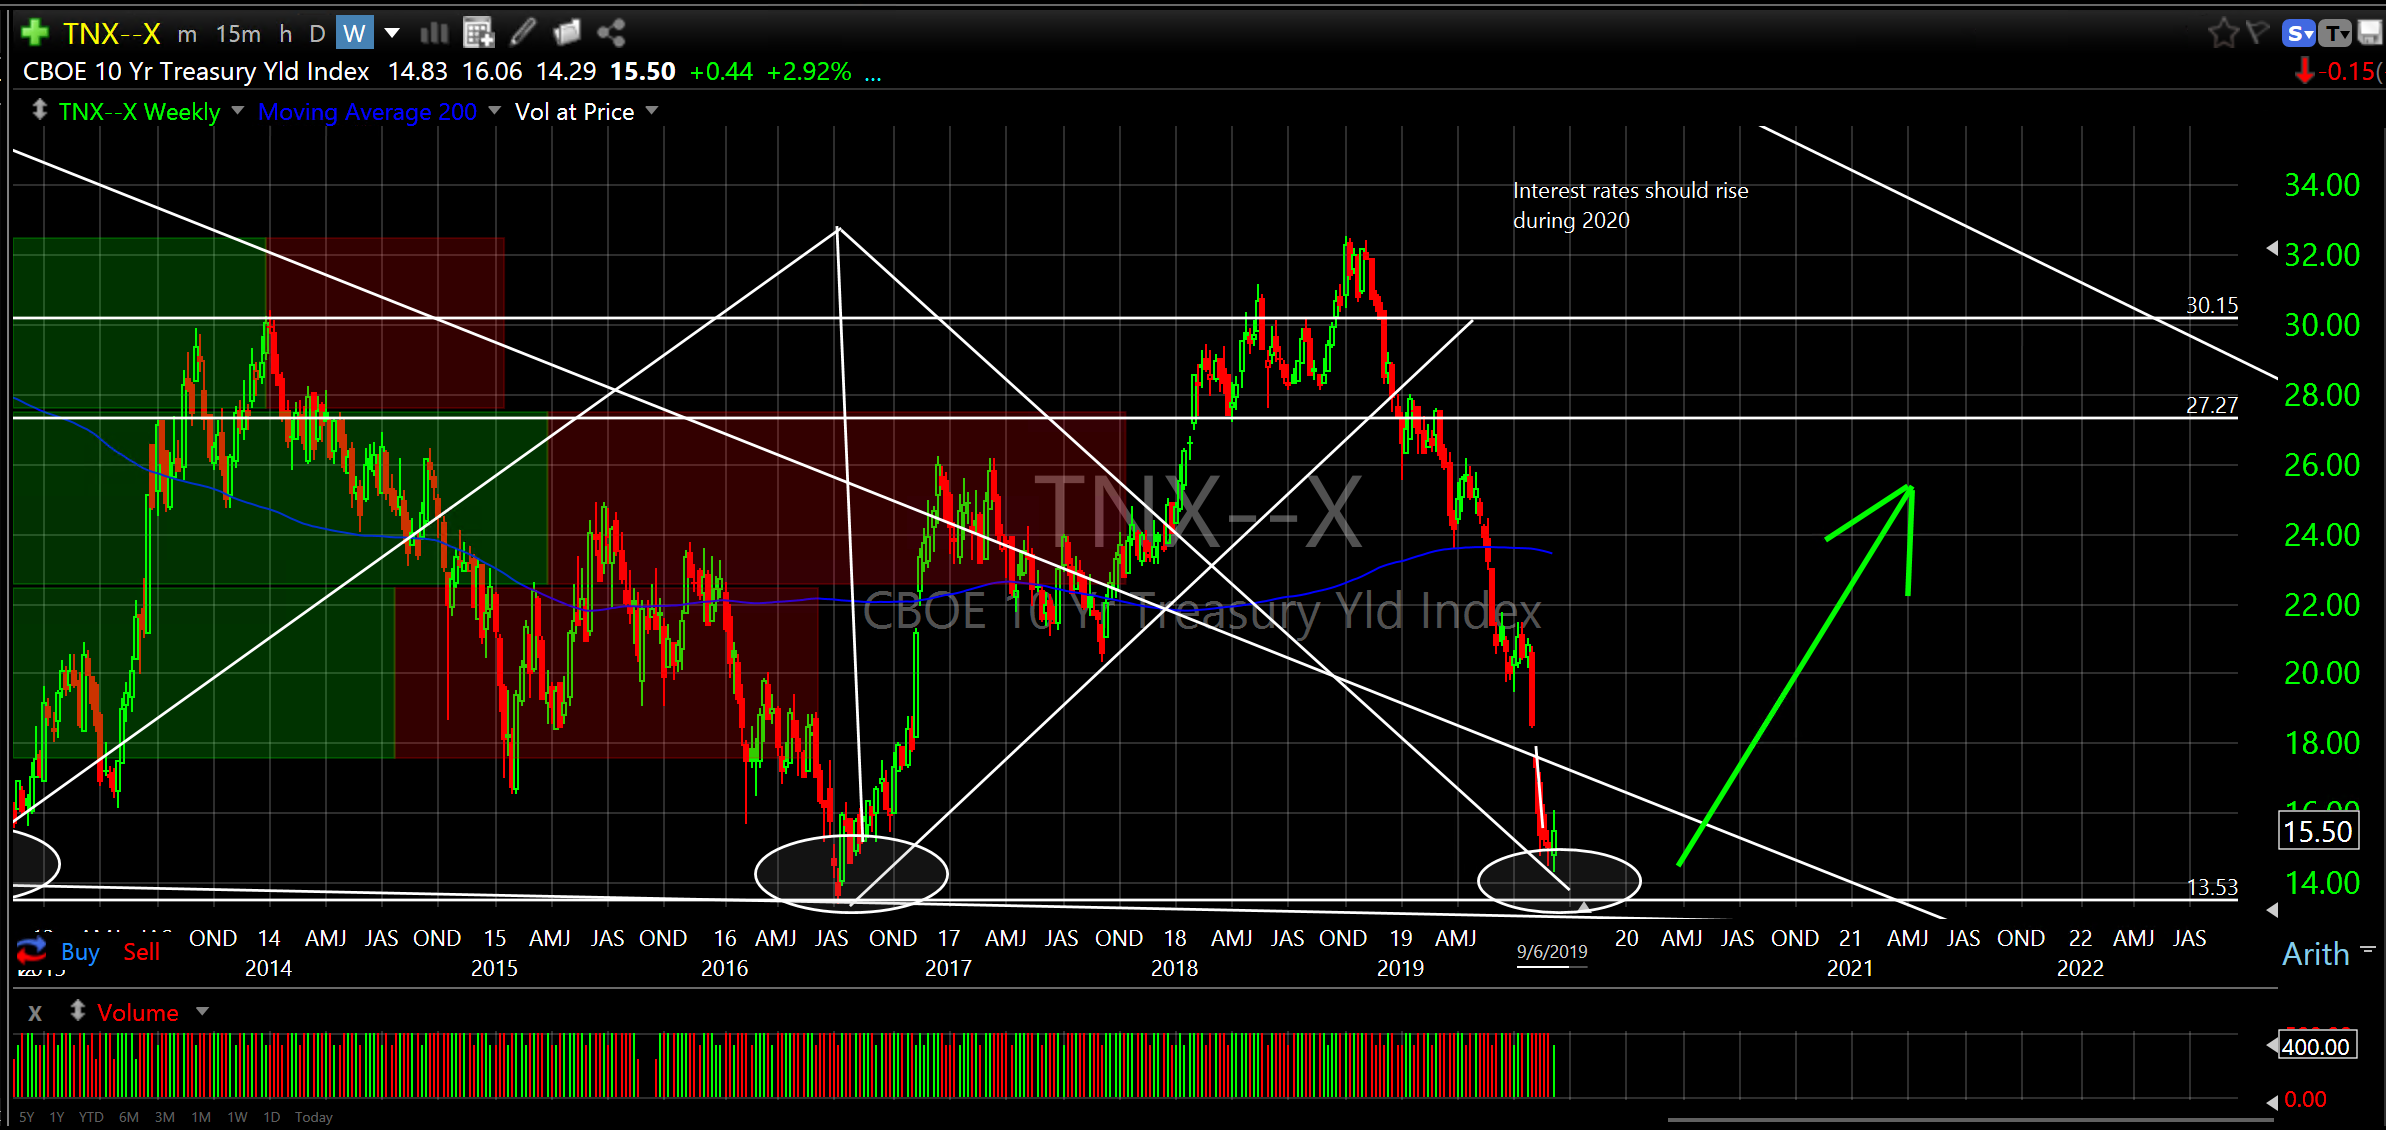
The following charts are more “for your information”. Gold should generally get weaker during the expansion. The energy sector should continue to underperform, at best (commodity super cycle should drift lower for a few more years). Yields should begin to rise early next year and continue that trend throughout most of the year during the expansion (Fed is always late to the party). See weekly, longer term charts below.
SPDR Gold Trust (GLD) weekly
SPDR’s Select Sector Energy ETF (XLE) weekly
CBOE 10 Yr Treasury Yield Index (TNX-X) weekly
Country ETF’s I like…
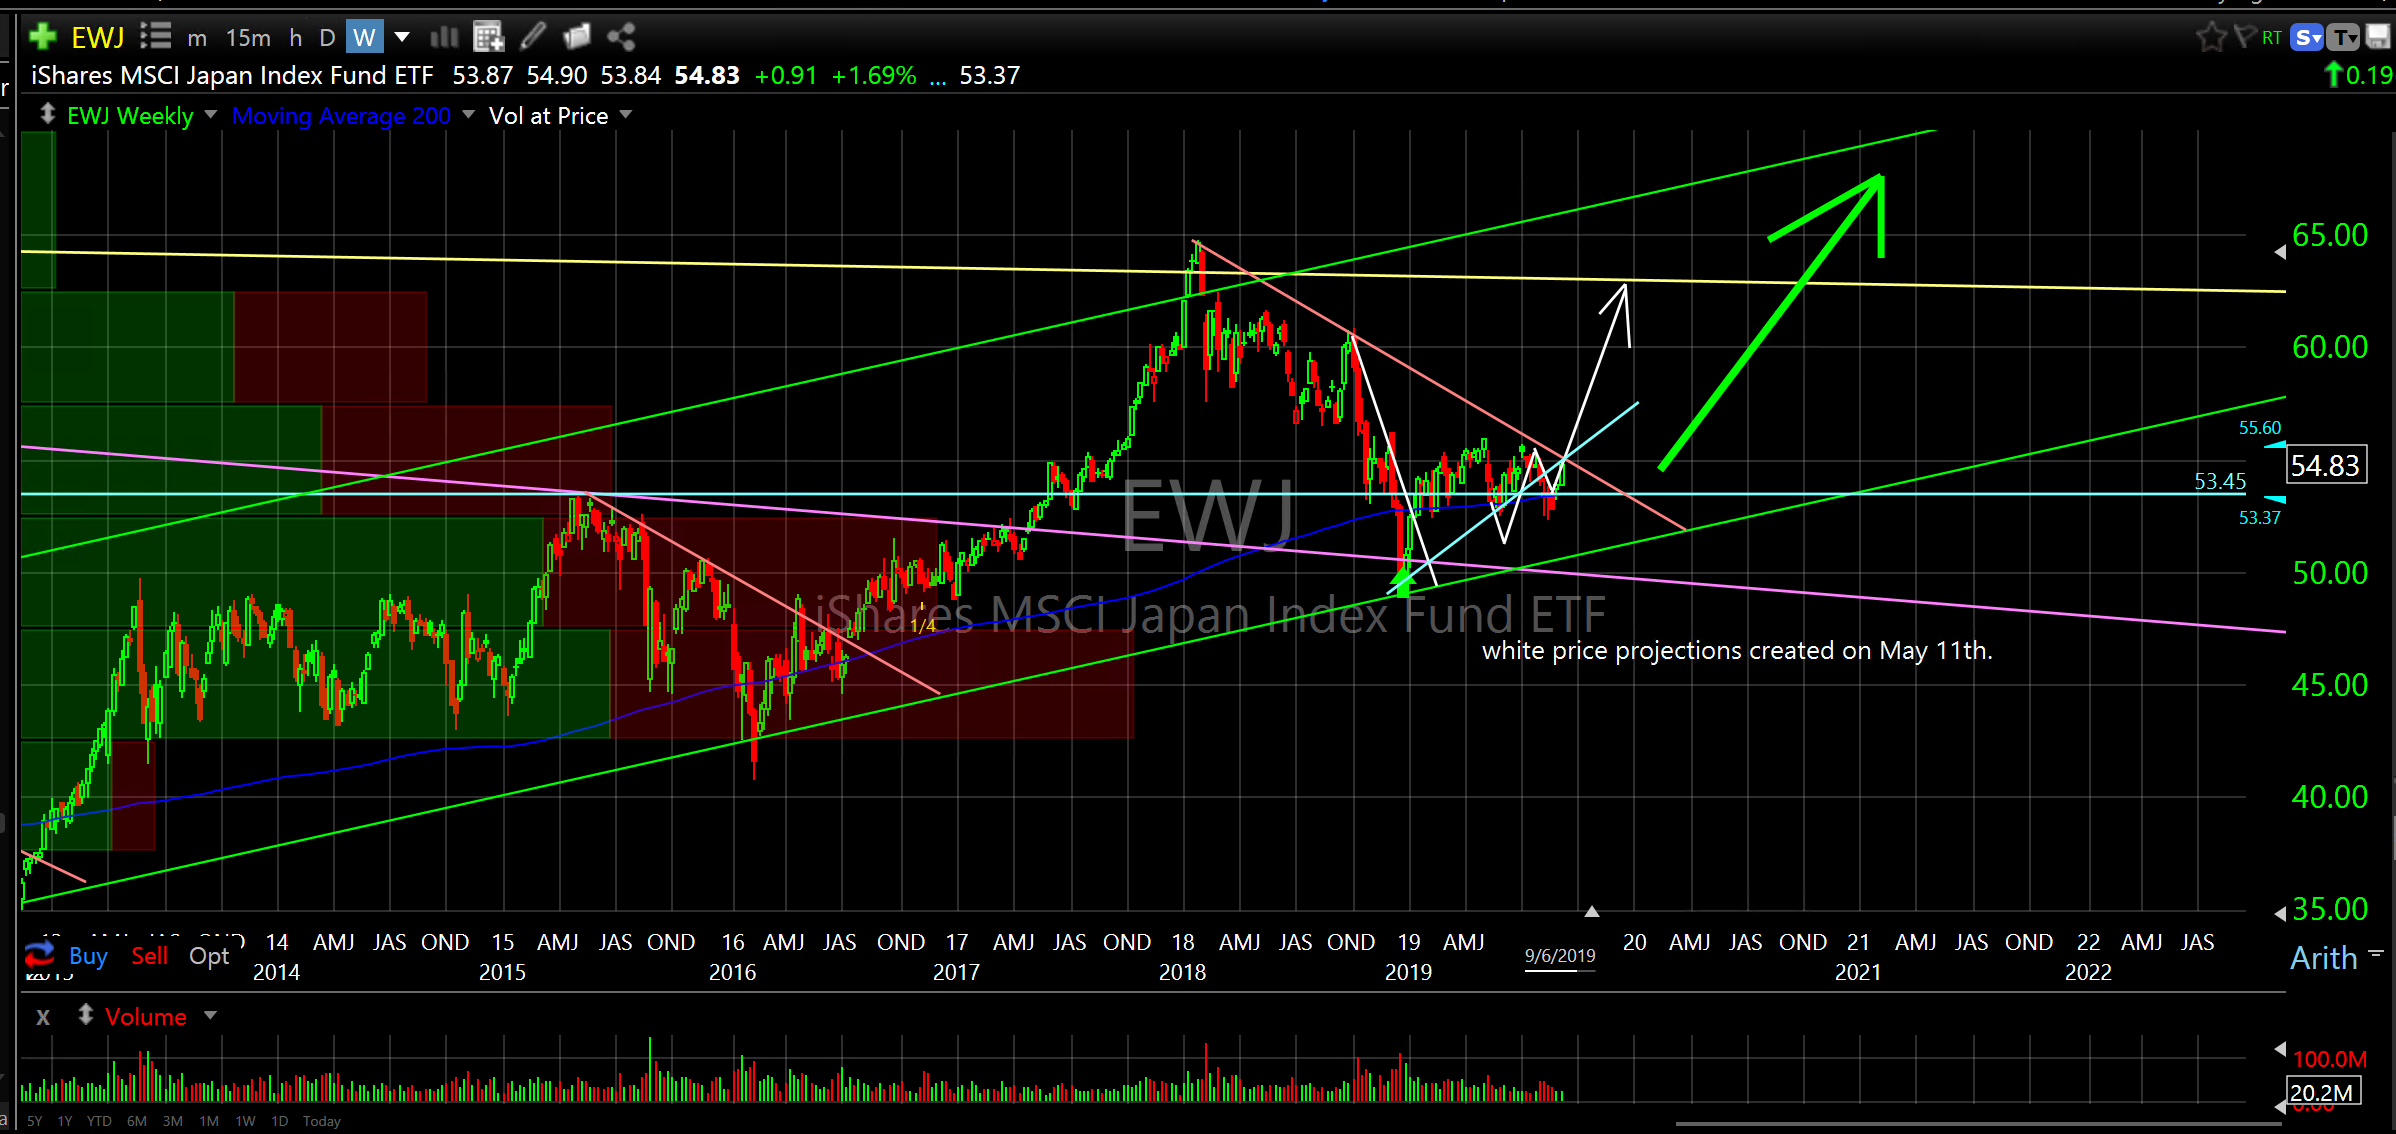
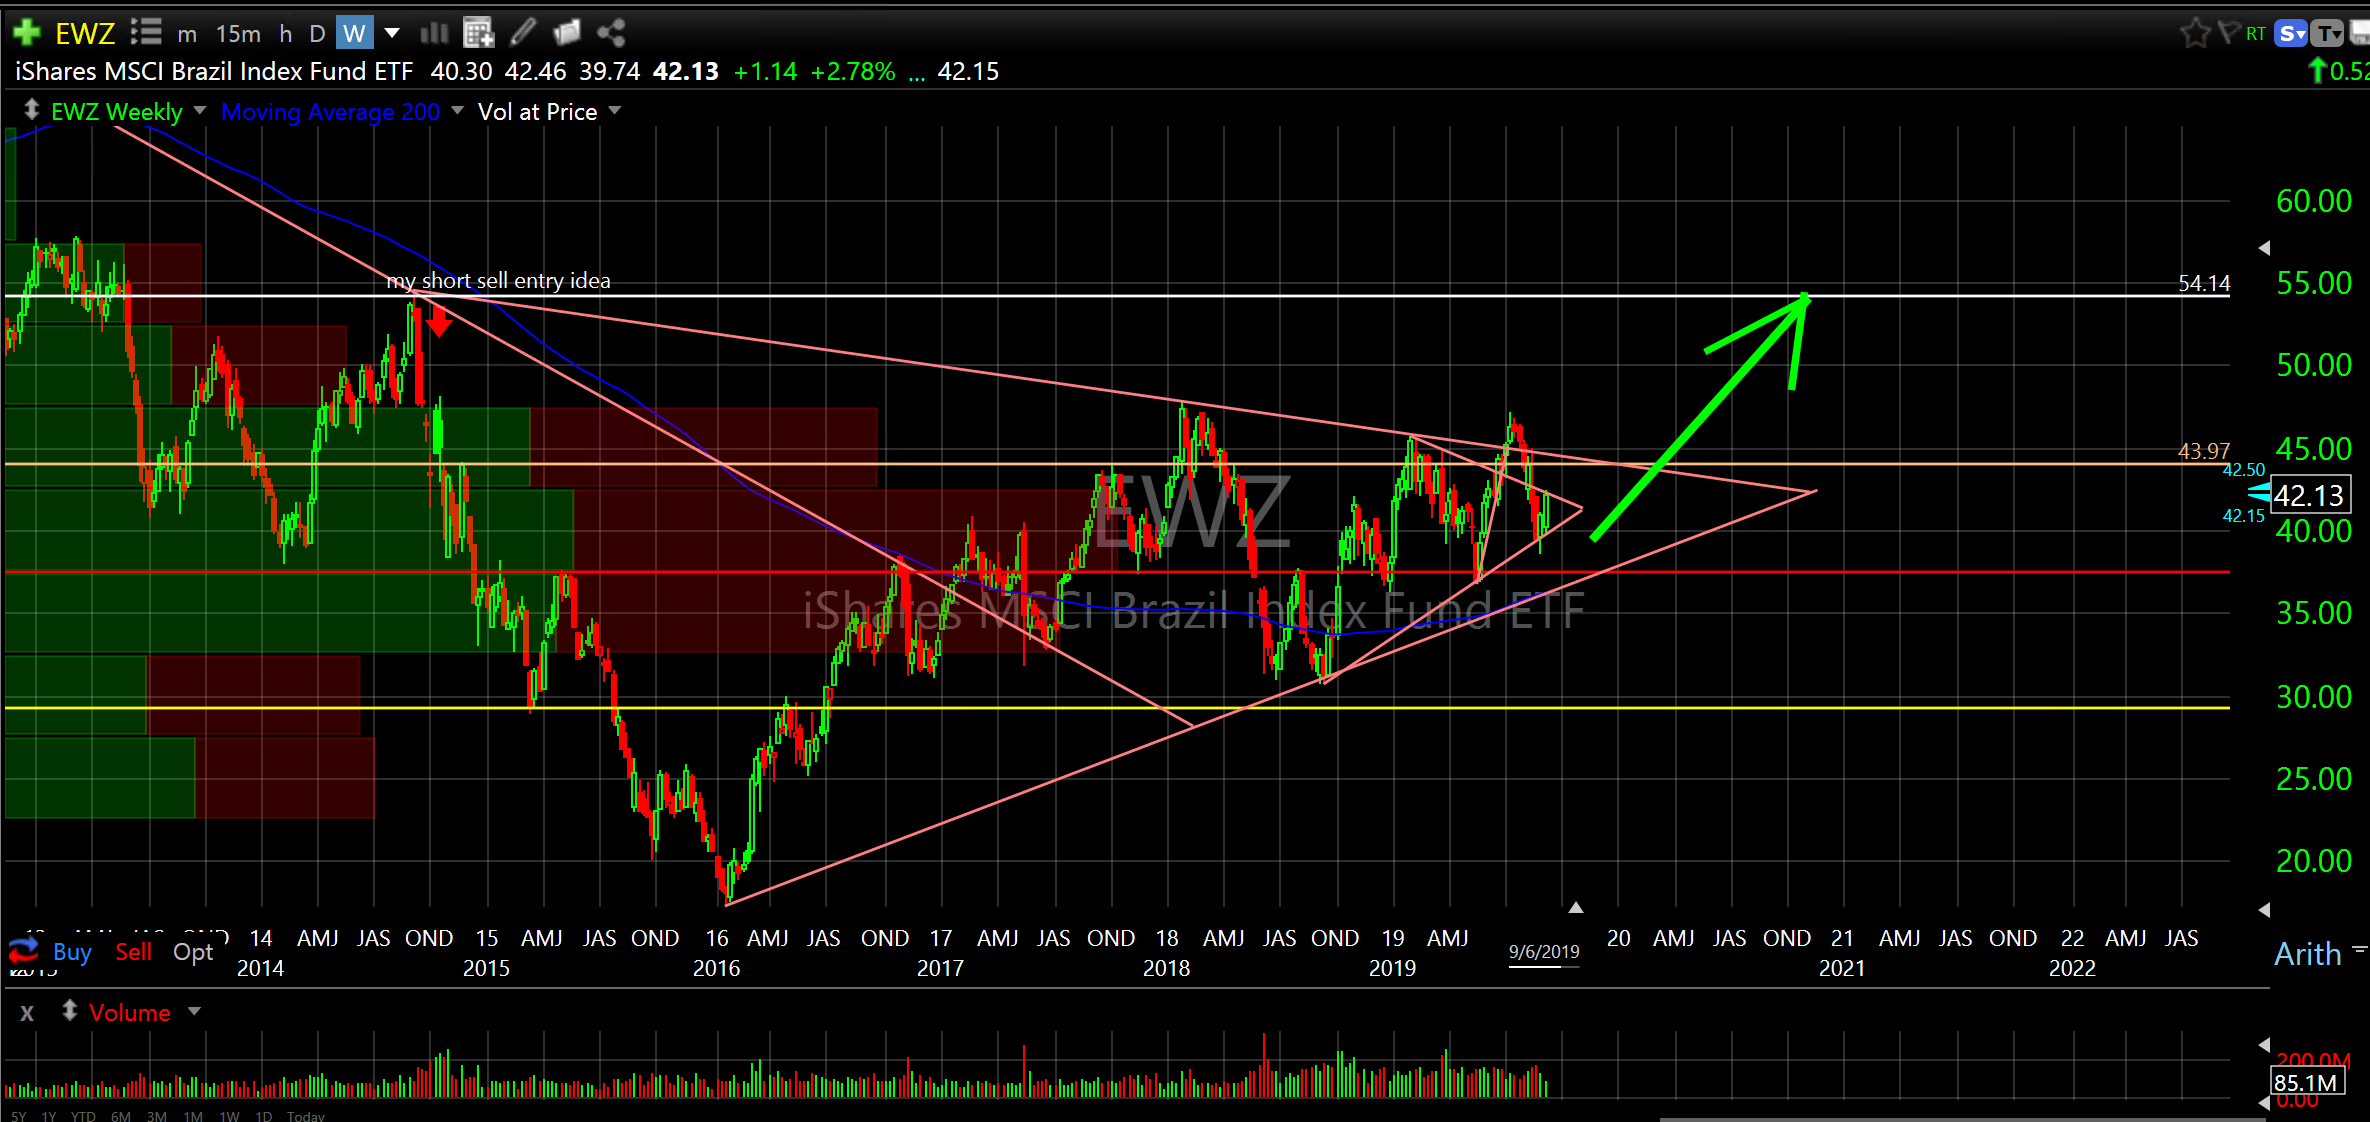
I like the following country ETF’s for some geographic diversification…
iShares MSCI Japan Index Fund ETF (EWJ) weekly
iShares MSCI Brazil Index Fund ETF (EWZ) weekly
I believe we are very close to the beginning of a final market thrust higher before the next recessionary collapse which could begin 12-18 months from now. The list of “must have exposure to” ETF’s above is a good place to start building from. As we get closer and have additional confirmation of the expansion it will be a good time to add individual securities. I have a long list of what look like “super performers” and I’m not so sure I can keep the list capped at 30 as there are so many.
I will start sharing the individual securities that are best positioned to ramp higher during 2020 next week with premium subscribers and fund managers.
These are opinions based on my research and not investment advice. With that said, let me tell you how I feel about charting. It is the most accurate, predictive analytical tool in use today to project future price action almost down to the minute. Do we always know what’s going to happen? Of course not. Do we know what should happen? Yes, and most of you have seen the proof. This is not traditional technical analysis.
Don
PS. Fun fact…my wife was in the movie “Sgt Peppers Lonely Hearts Club Band”.