Broader Market Review
The broader market is now two months into the expansion that began on November 4, 2019 when the S&P 500 index crossed over its 22 month resistance. It was confirmed when the Dow crossed over on November 7, 2019.
This is what I wrote on November 18, 2019 in my report “The Expansion has Begun“.
“All broader market indexes have crossed over and are separating from their individual ascending yellow line resistance levels (now support) from early 2018 that I have been referencing for most of 2019. This separation is GOOD. It’s exactly what we want to see. The separation is BULLISH. The expansion has finally begun. Price action is right on it’s expected and projected track and the thrust higher in 2020 should catch most people off guard as there aren’t too many (experts or otherwise) that expect the kind of rip roaring expansion that should take the Dow close to 34,000 before the presidential election next year.”
“This does not mean we won’t have choppy price action. We are always vulnerable at resistance levels. In fact, the broader market is on track to run into another ascending resistance level over the course of the next couple of weeks. It would not be surprising or out of the ordinary to get a pullback soon. What I do not expect is anything too deep. See DIA year end price projection chart for expected depth of next dip which might be a re-test of the yellow line ascending resistance level recently crossed over. This is now ascending support. I expect it to hold (at worst a slight dip below) and propel price higher leaving “most” everyone scratching their heads in disbelief and coming up with “reasons” to explain why. Where the heck were they six months ago when they were all crying “yield inversion! recession…recession!”
I wrote that two months ago and the Dow, S&P 500, Nasdaq, Small Caps, sectors, subsectors, ETF’s, individual stocks and yields are performing exactly as they should and as I have projected they would since early last year. We got the shallow dip re-test of the yellow line and price was propelled higher leaving everyone scratching their heads as I described it would happen. The broader market continues to separate from the old 22 month resistance level it crossed over in November and confirm the expansion that has caught most everyone off guard, except us.
So now what? My price projections from early November shows that at current levels we should expect a slight dip that should last into late January/early February to load up pressure for a steep ramp into April. It appears we are in that dip now. If you haven’t already done so, it’s time to get positioned for the rip that should follow the dip.
The Dow and S&P 500 charts below show my updated projections for the potential depth of the current and relatively shallow pullback and the expected ramp into April.
DIA SPDR Dow Jones Industrial Average ETF

SPY SPDR’s S&P 500 Trust Series ETF

This dip should be a tremendous buying opportunity, just like it was in early November.
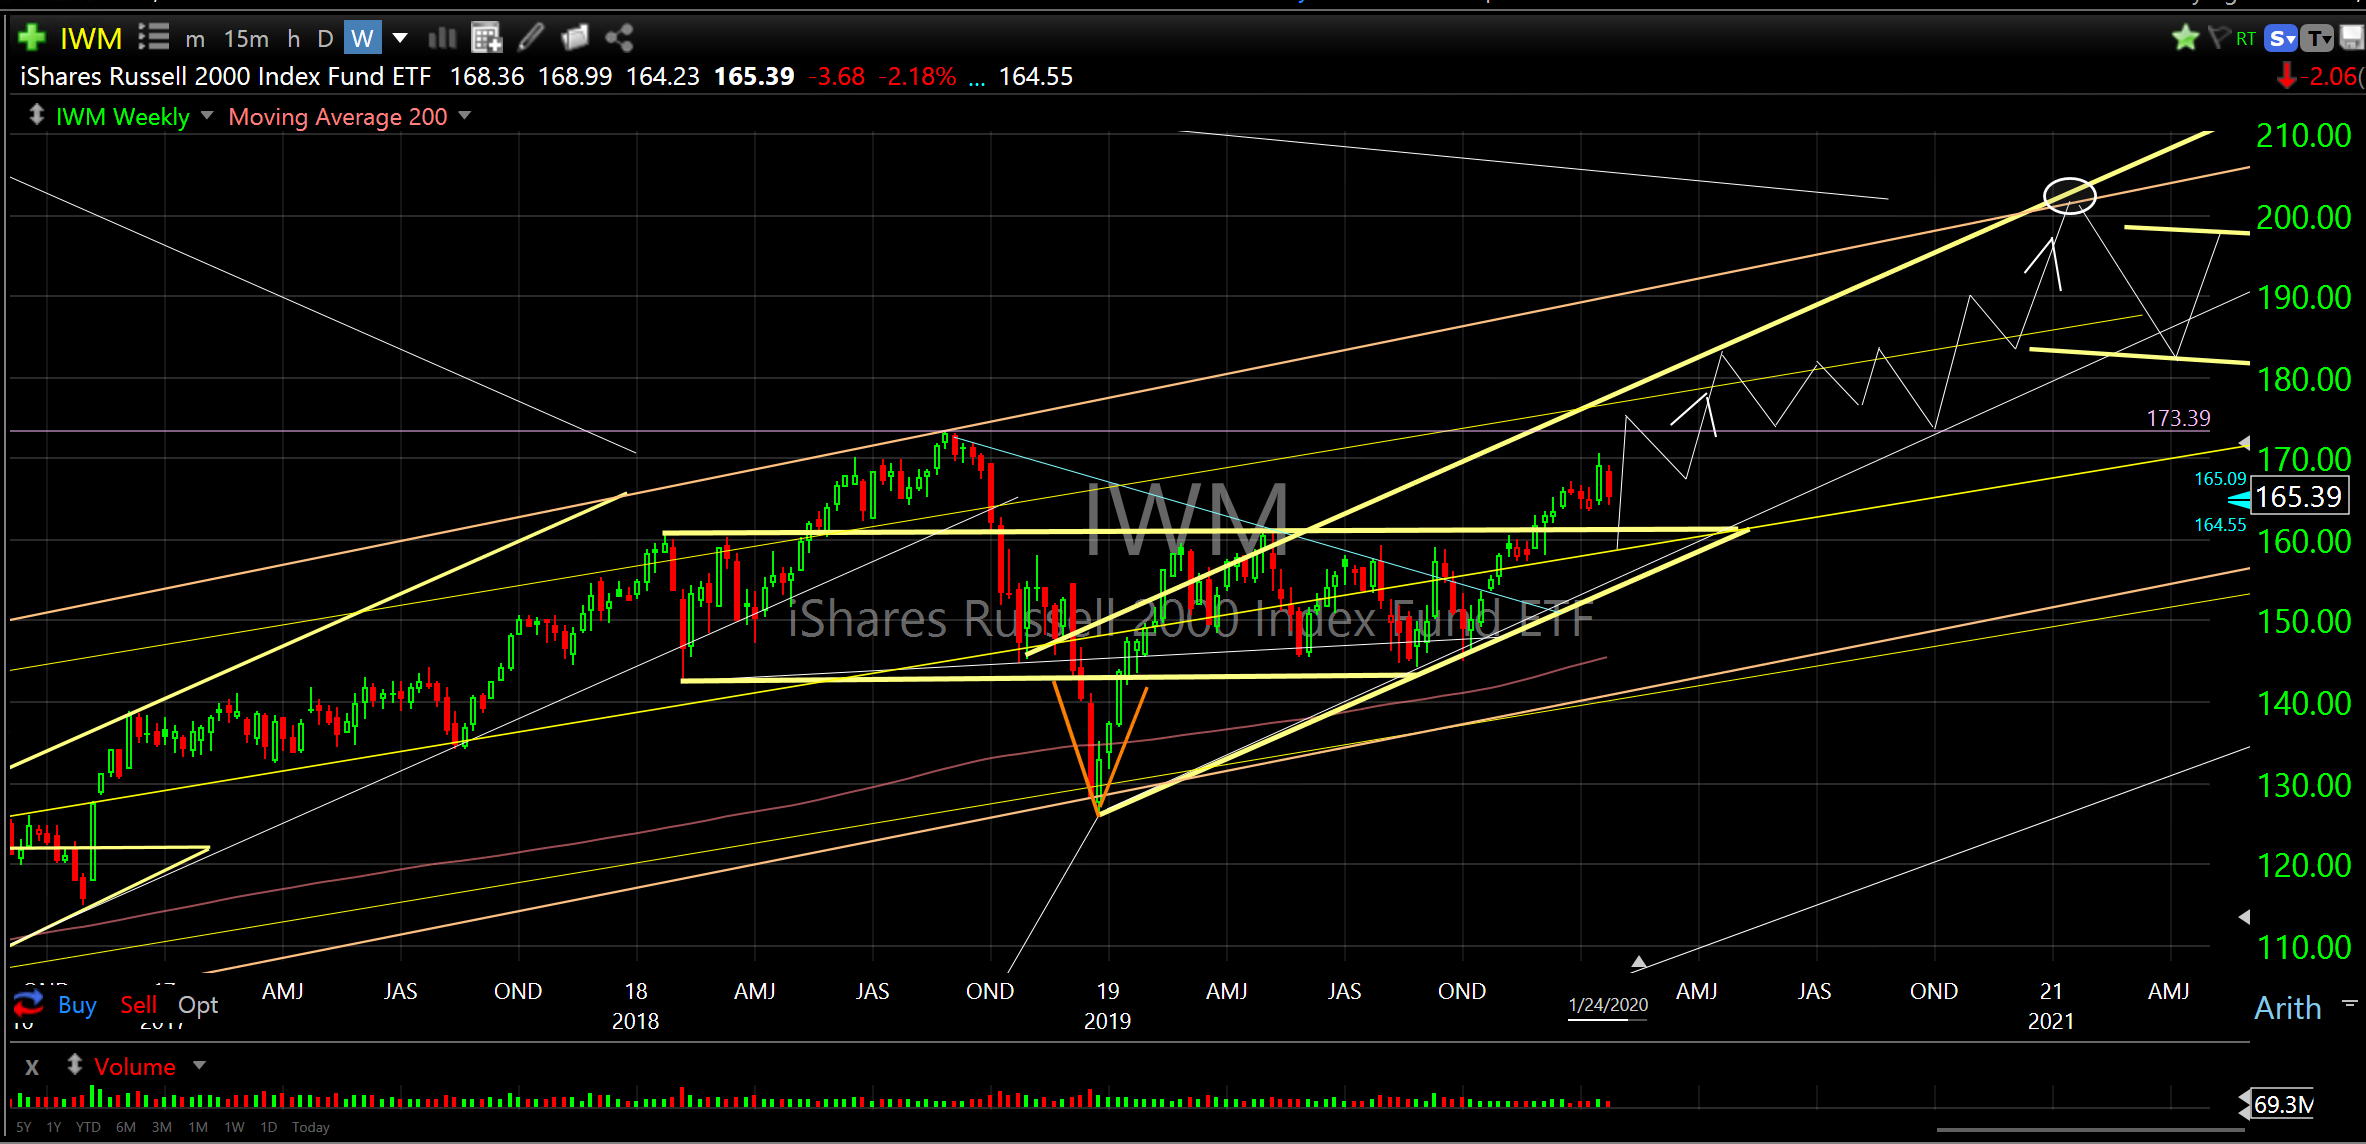
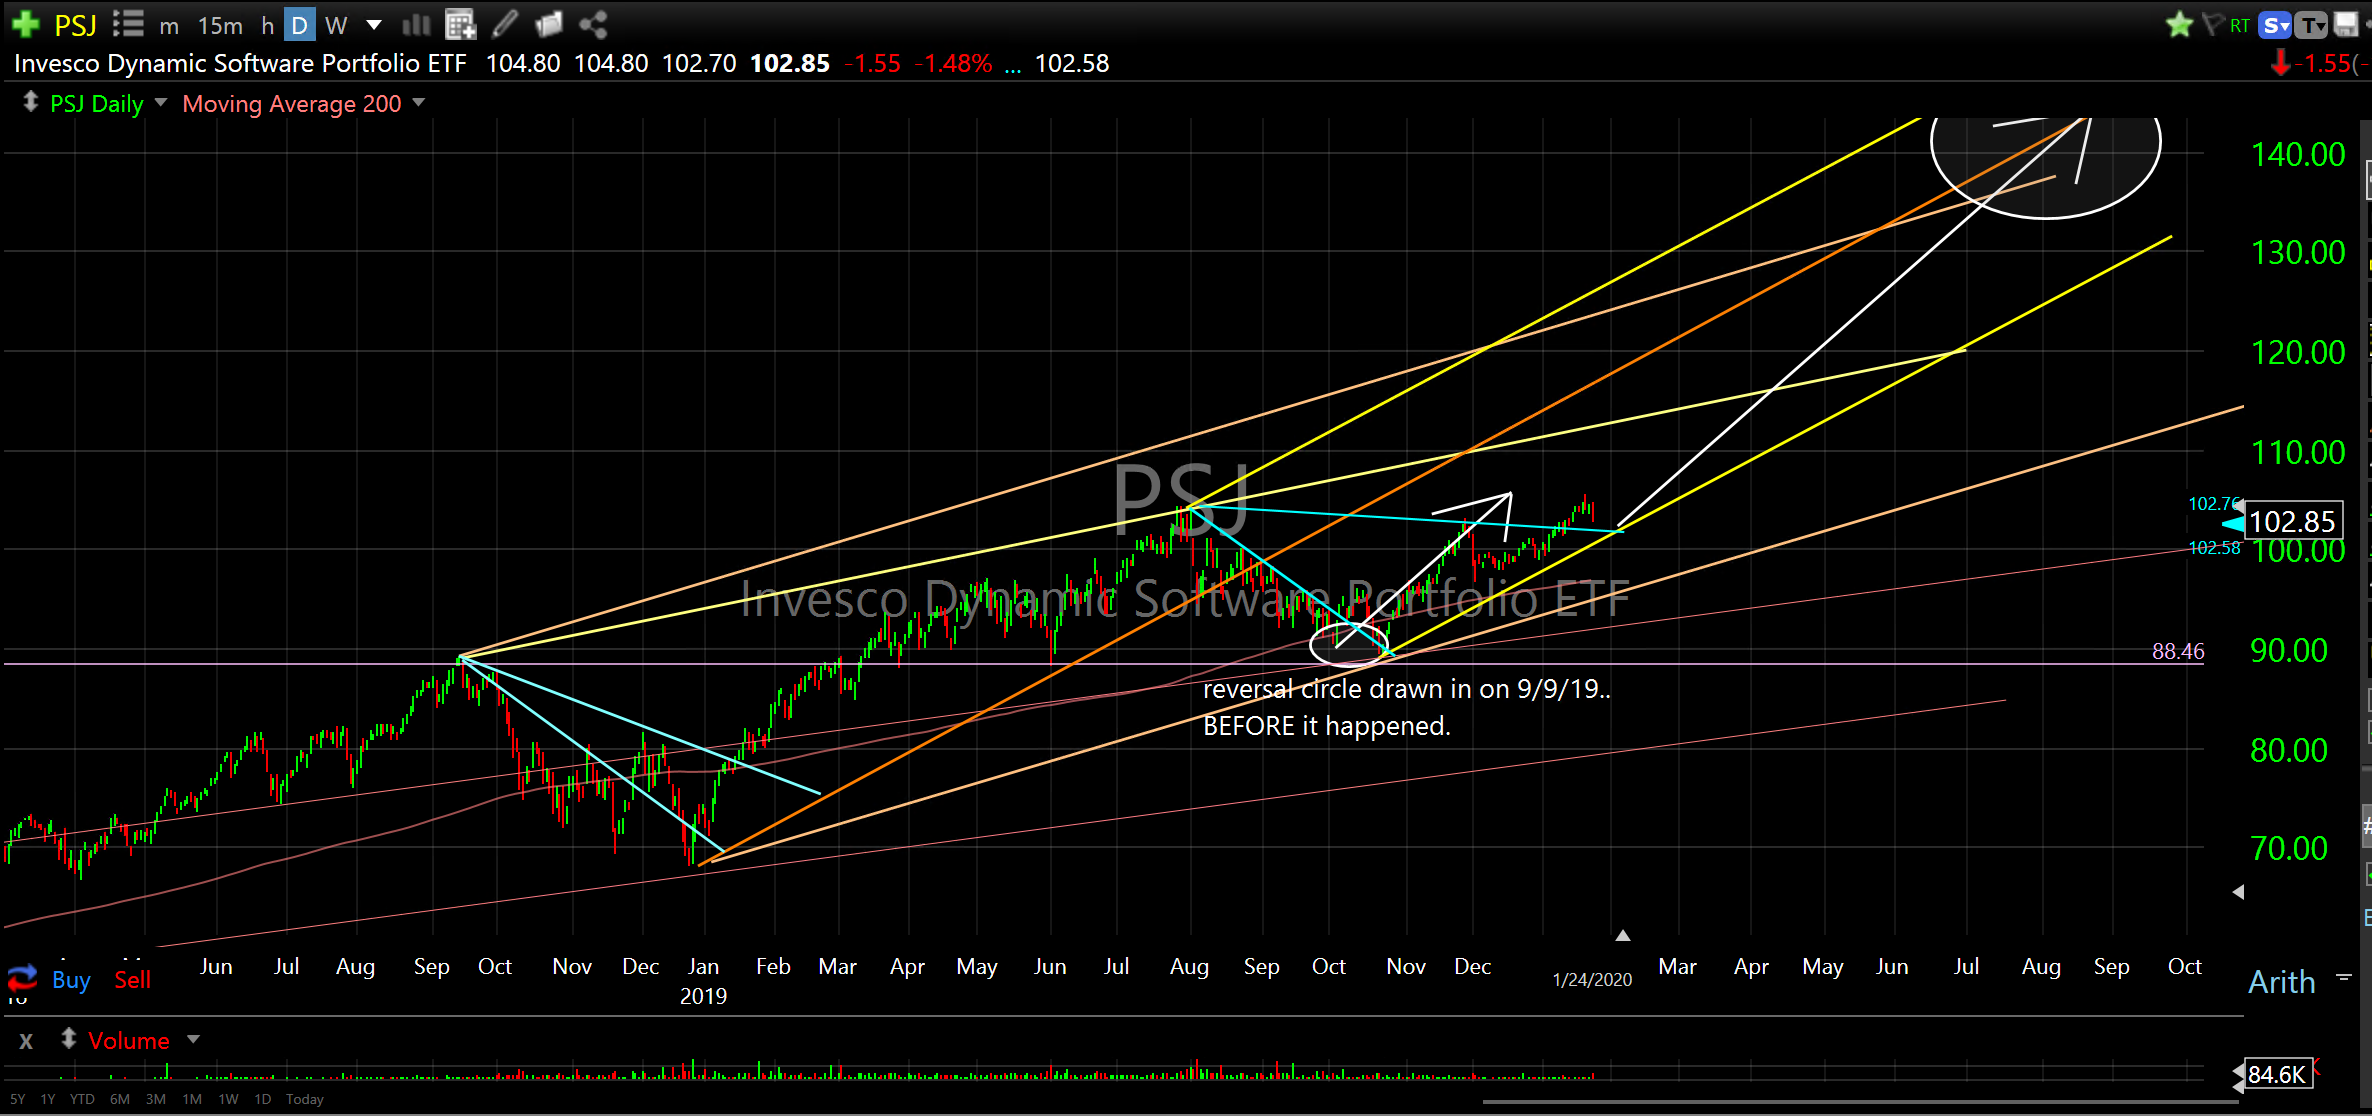
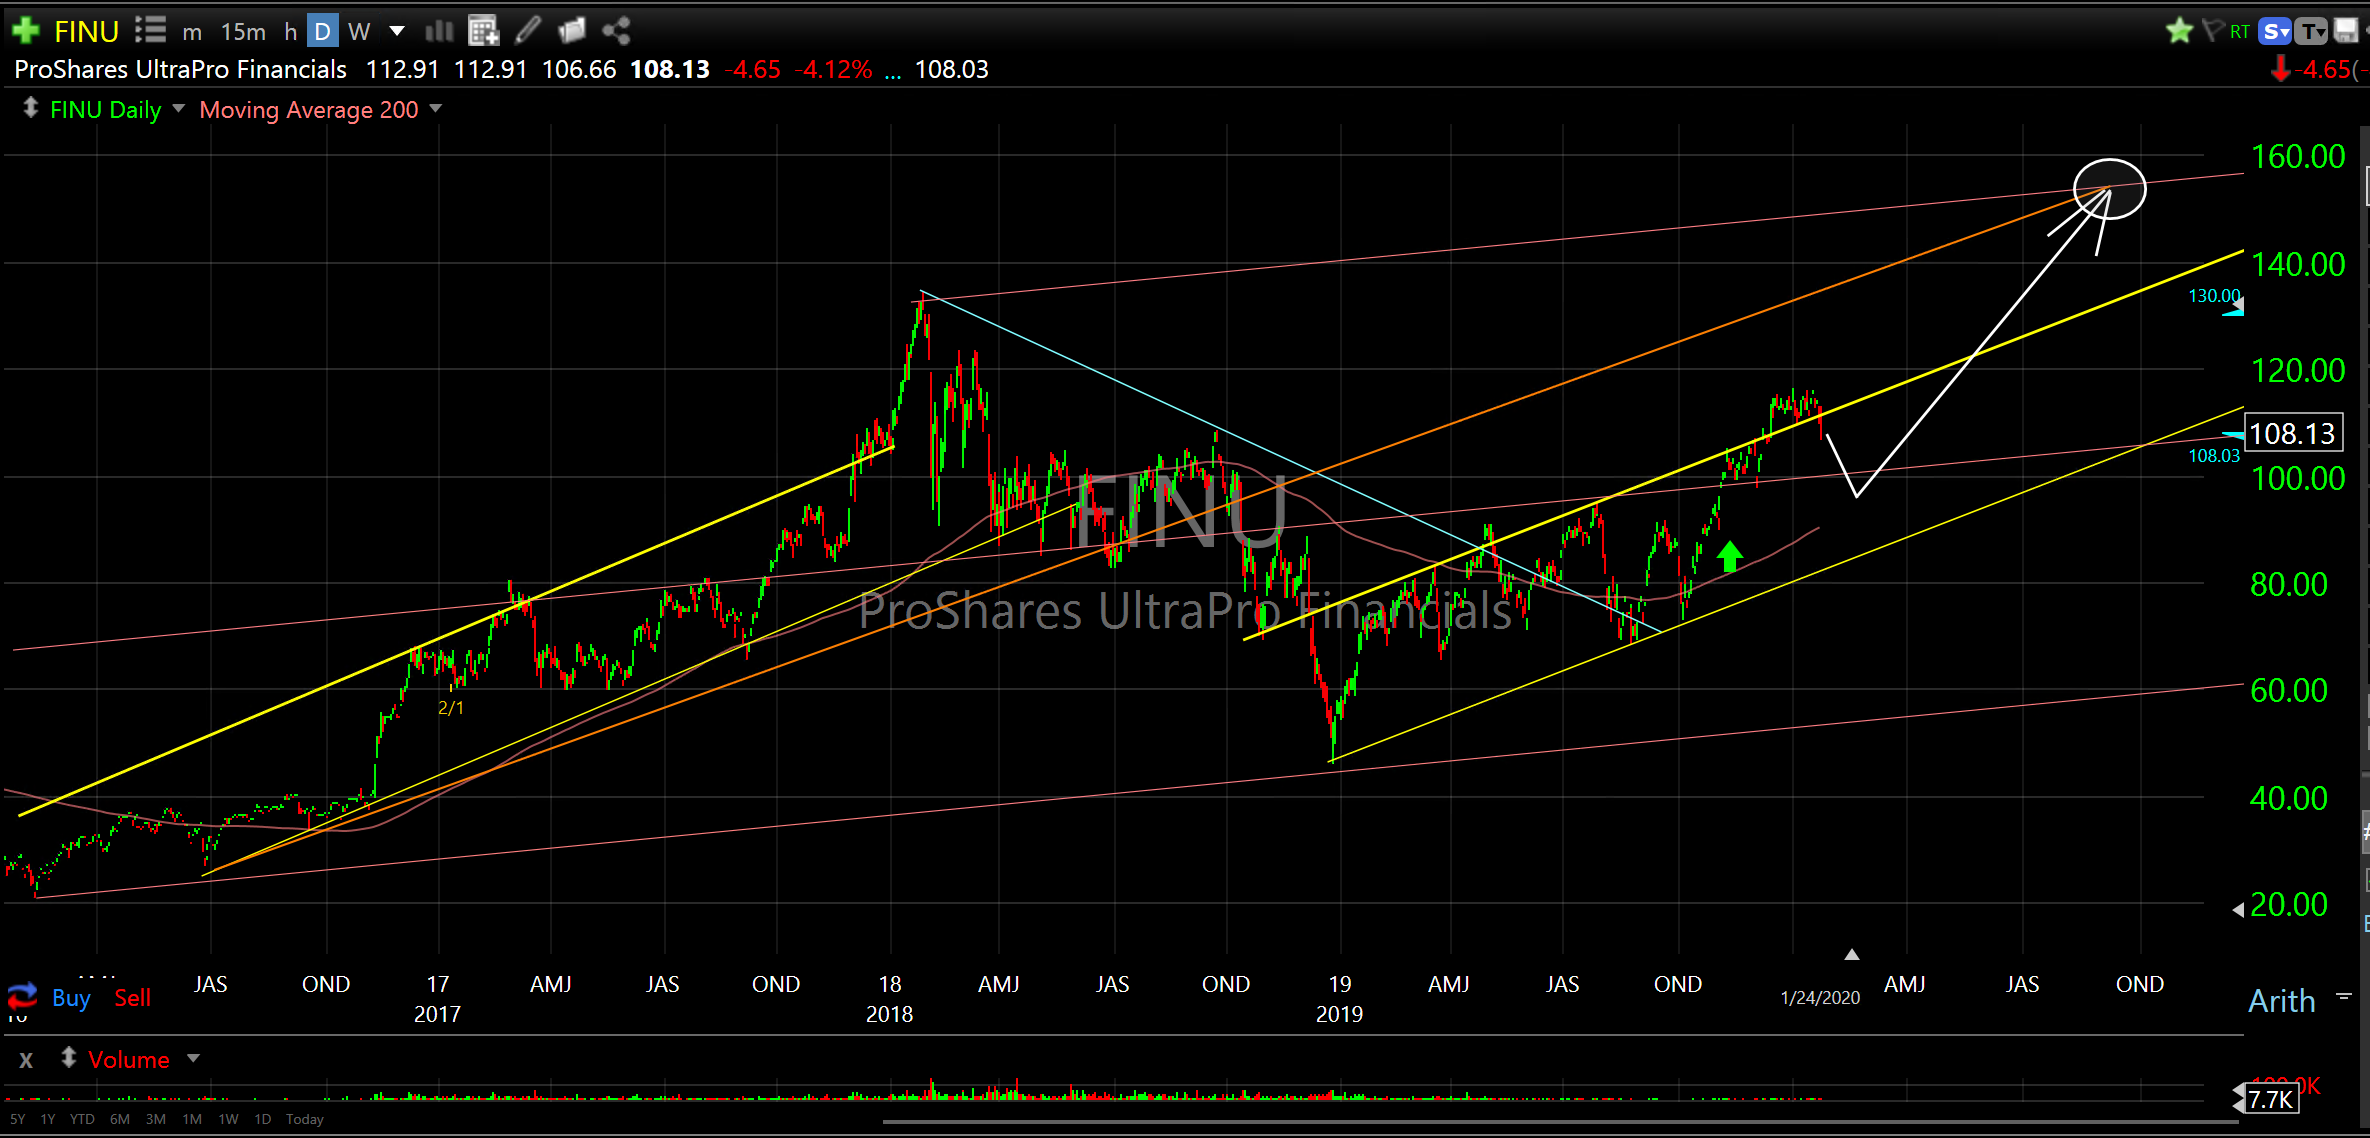
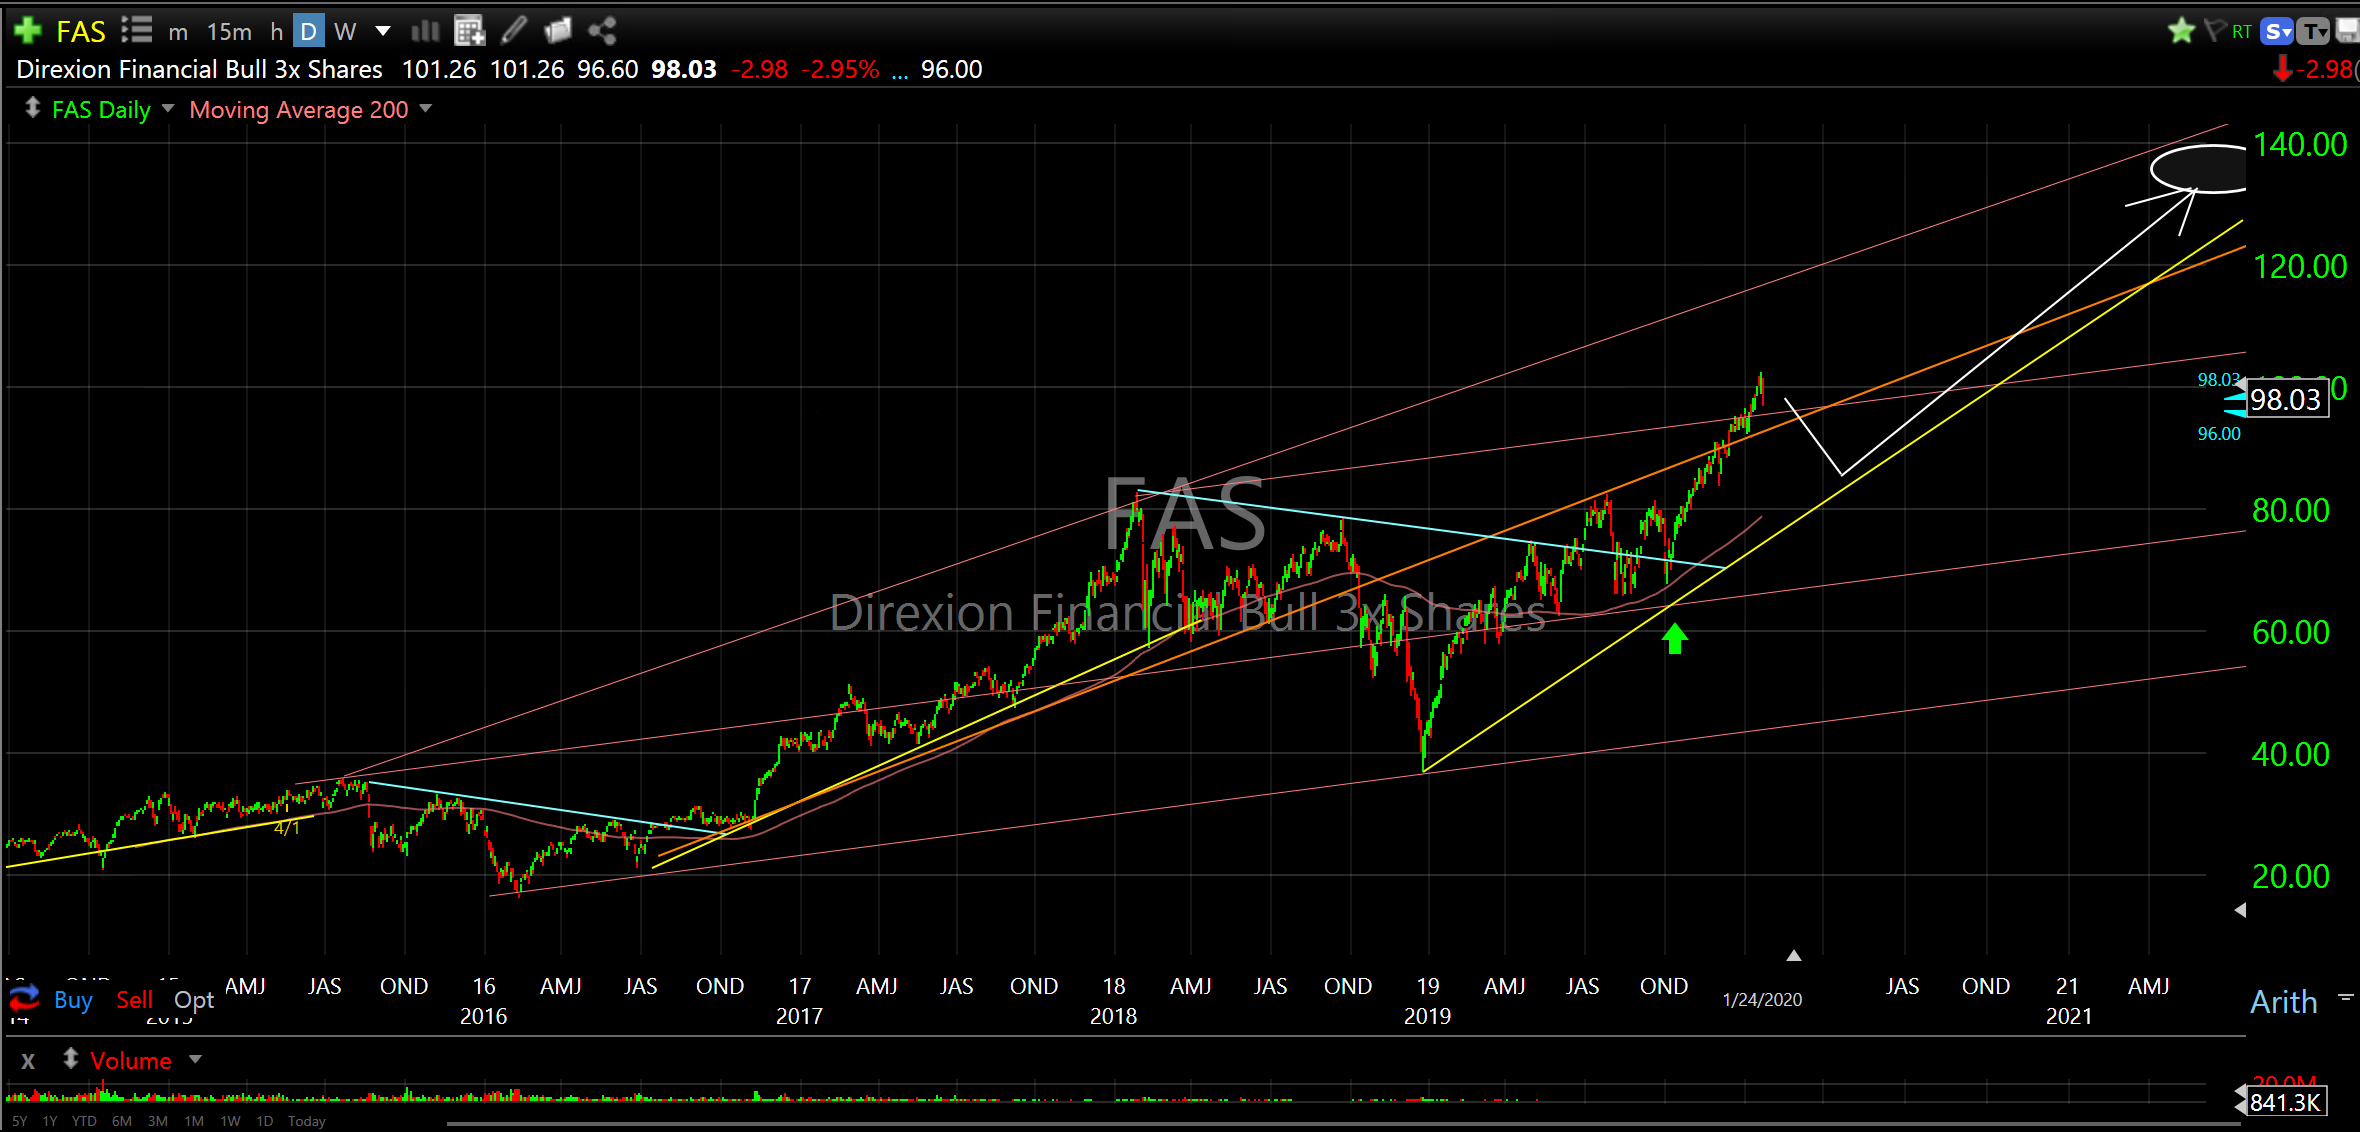
My forecast remains unchanged; a robust expansion during 2020. All sectors are likely to contribute, however, some more than others. Technology stocks remain positioned to continue their outperformance with semiconductors and software companies leading the way. Financial stocks are positioned to play catch up and become a leading sector after being suppressed for almost ten years. Small caps should start running later in the cycle towards the back half of 2020 and we will likely see interest rates continue to rise into a more neutral zone before going higher again later in the year.
China and Japan are also positioned well. Japan has been suppressed for thirty years and should continue to channel higher (recommended in January 2019). China technology companies have recovered about half their collapse during 2018 and the current dip should provide a lower entry for a continuation of the expansion that began last summer (recommended in May 2019).
I would avoid gold and oil related instruments. They might get a sympathy bid up over the next few months but will likely underperform during the back half of 2020.
The following ETF’s are still my favorites.
DIA SPDR Dow Jones Industrial Average ETF
SPY SPDR’s S&P 500 Trust Series ETF
SPXL Direxion Daily S&P 500 Bull 3X *

QQQ Invesco QQQ Trust Ser1

TQQQ Proshares UltraPro QQQ *

IWM iShares Russell 2000 Index fund ETF
TNA Direxion Small Cap Bull 3X *

XLK SPDR’s select Sector Technology ETF

TECL Direxion Technology Bull 3X *

SMH VanEck Vectors Semiconductor ETF

SOXL Direxion Daily Semicon bull 3X *

PSJ Invesco Dynamic Software Portfolio ETF
IGV iShares S&P GSTI Software Portfolio Index Fund

XLF SPDR Select Sector Financial ETF

FINU ProShares UltraPro Financials *
FAS Direxion Financial Bull 3X Shares *
KWEB KraneShares CSI China Internet ETF

CQQQ Guggenheim China Technology Index Fund *

EWJ iShares MSCI Japan Index Fund ETF

XLV SPDR’s Select Sector Health Care ETF

XLC The Communication Services Sector SPDR Fund
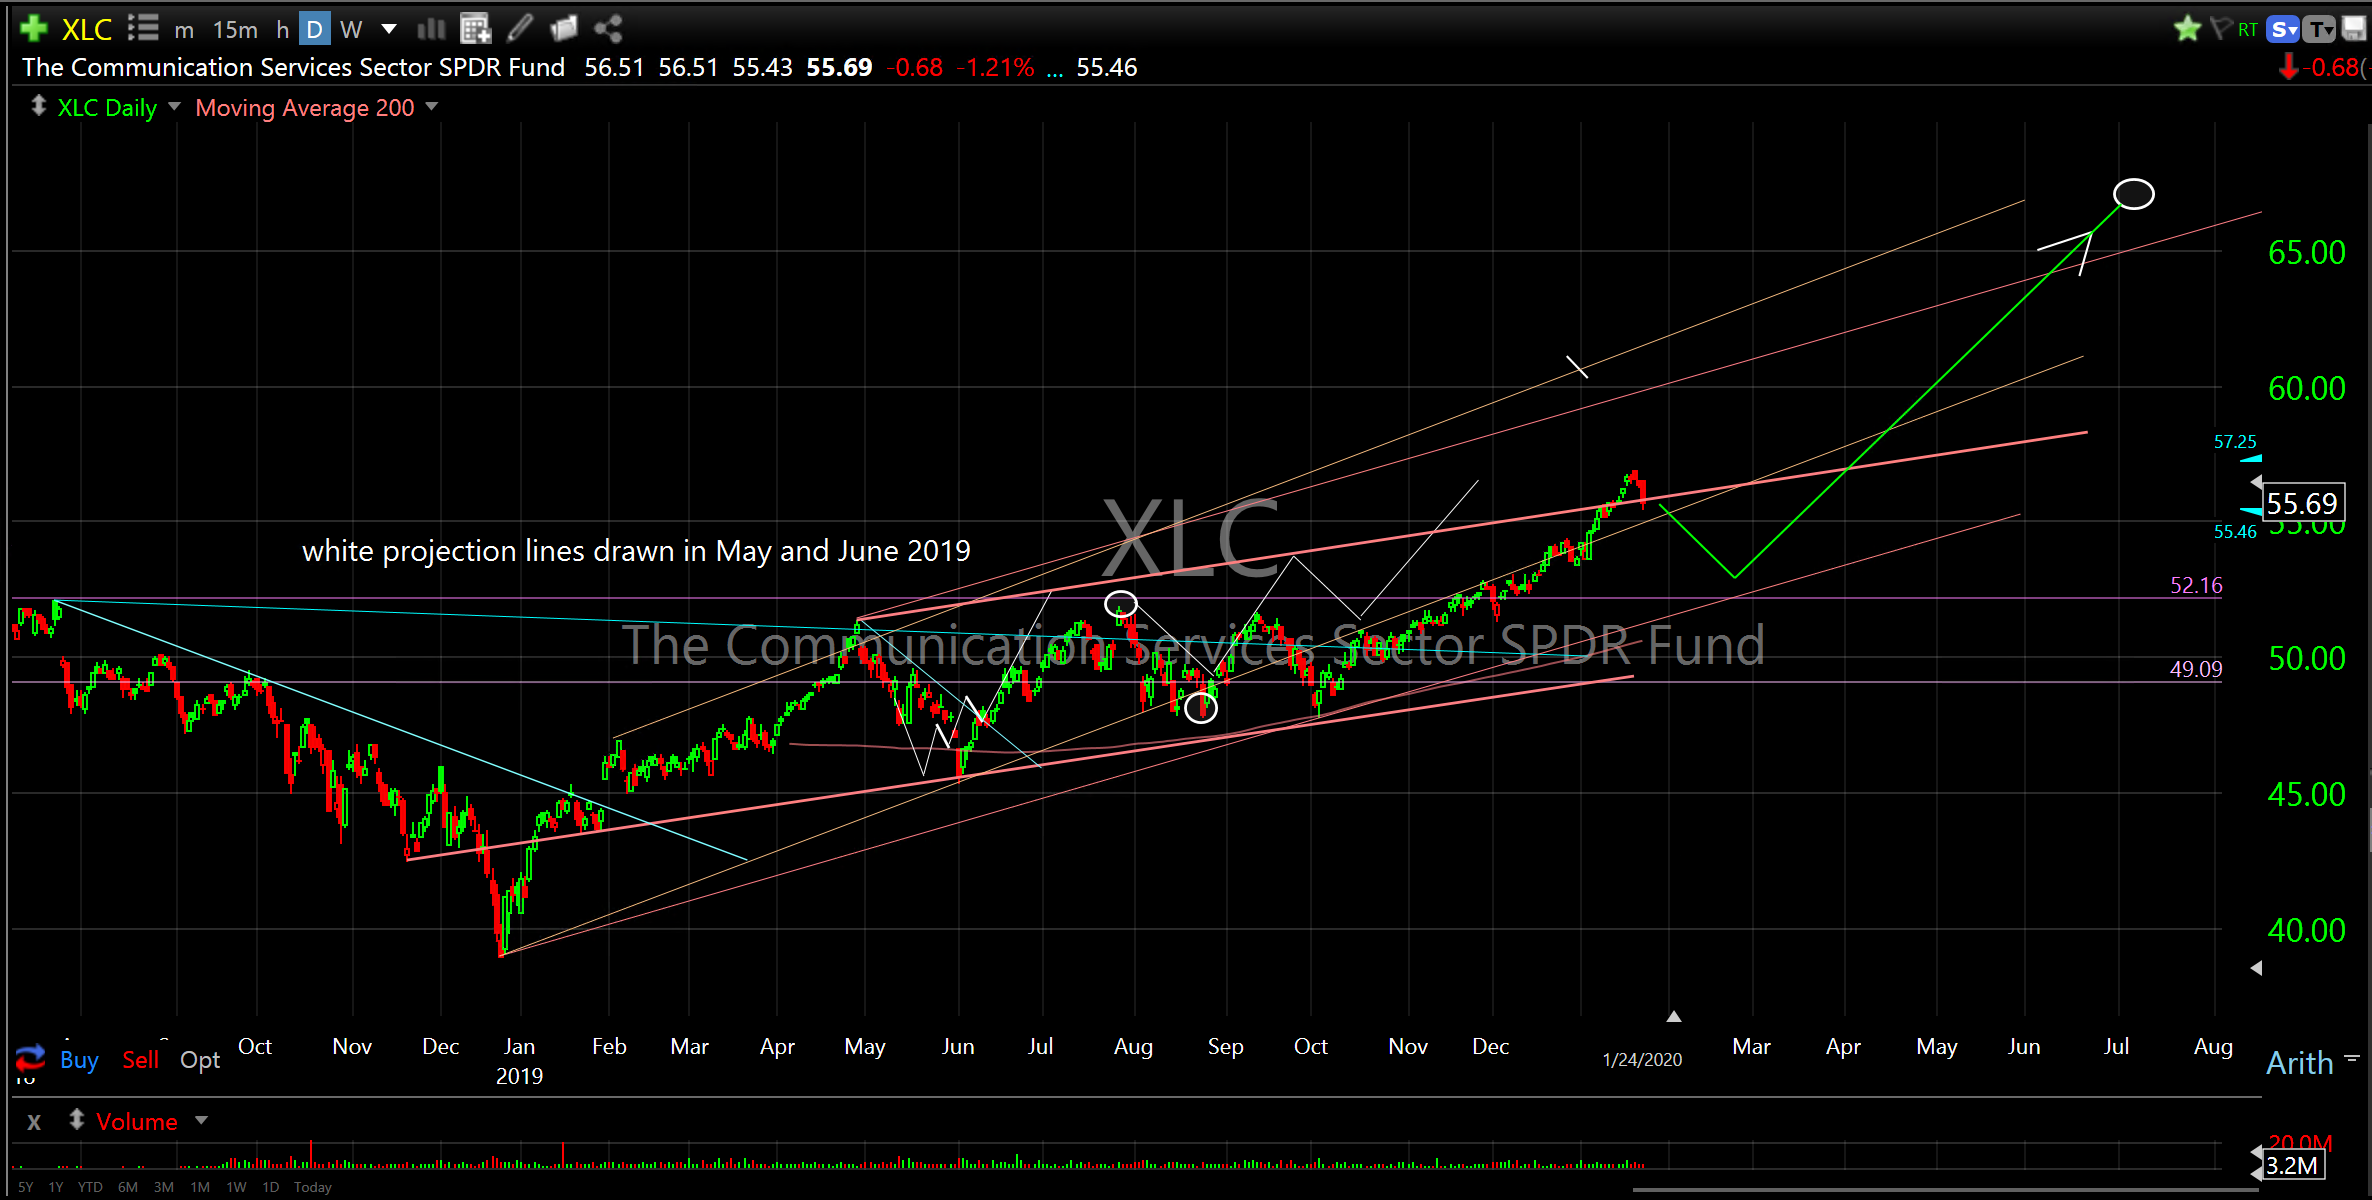
SOCL Global X Social Media Index ETF
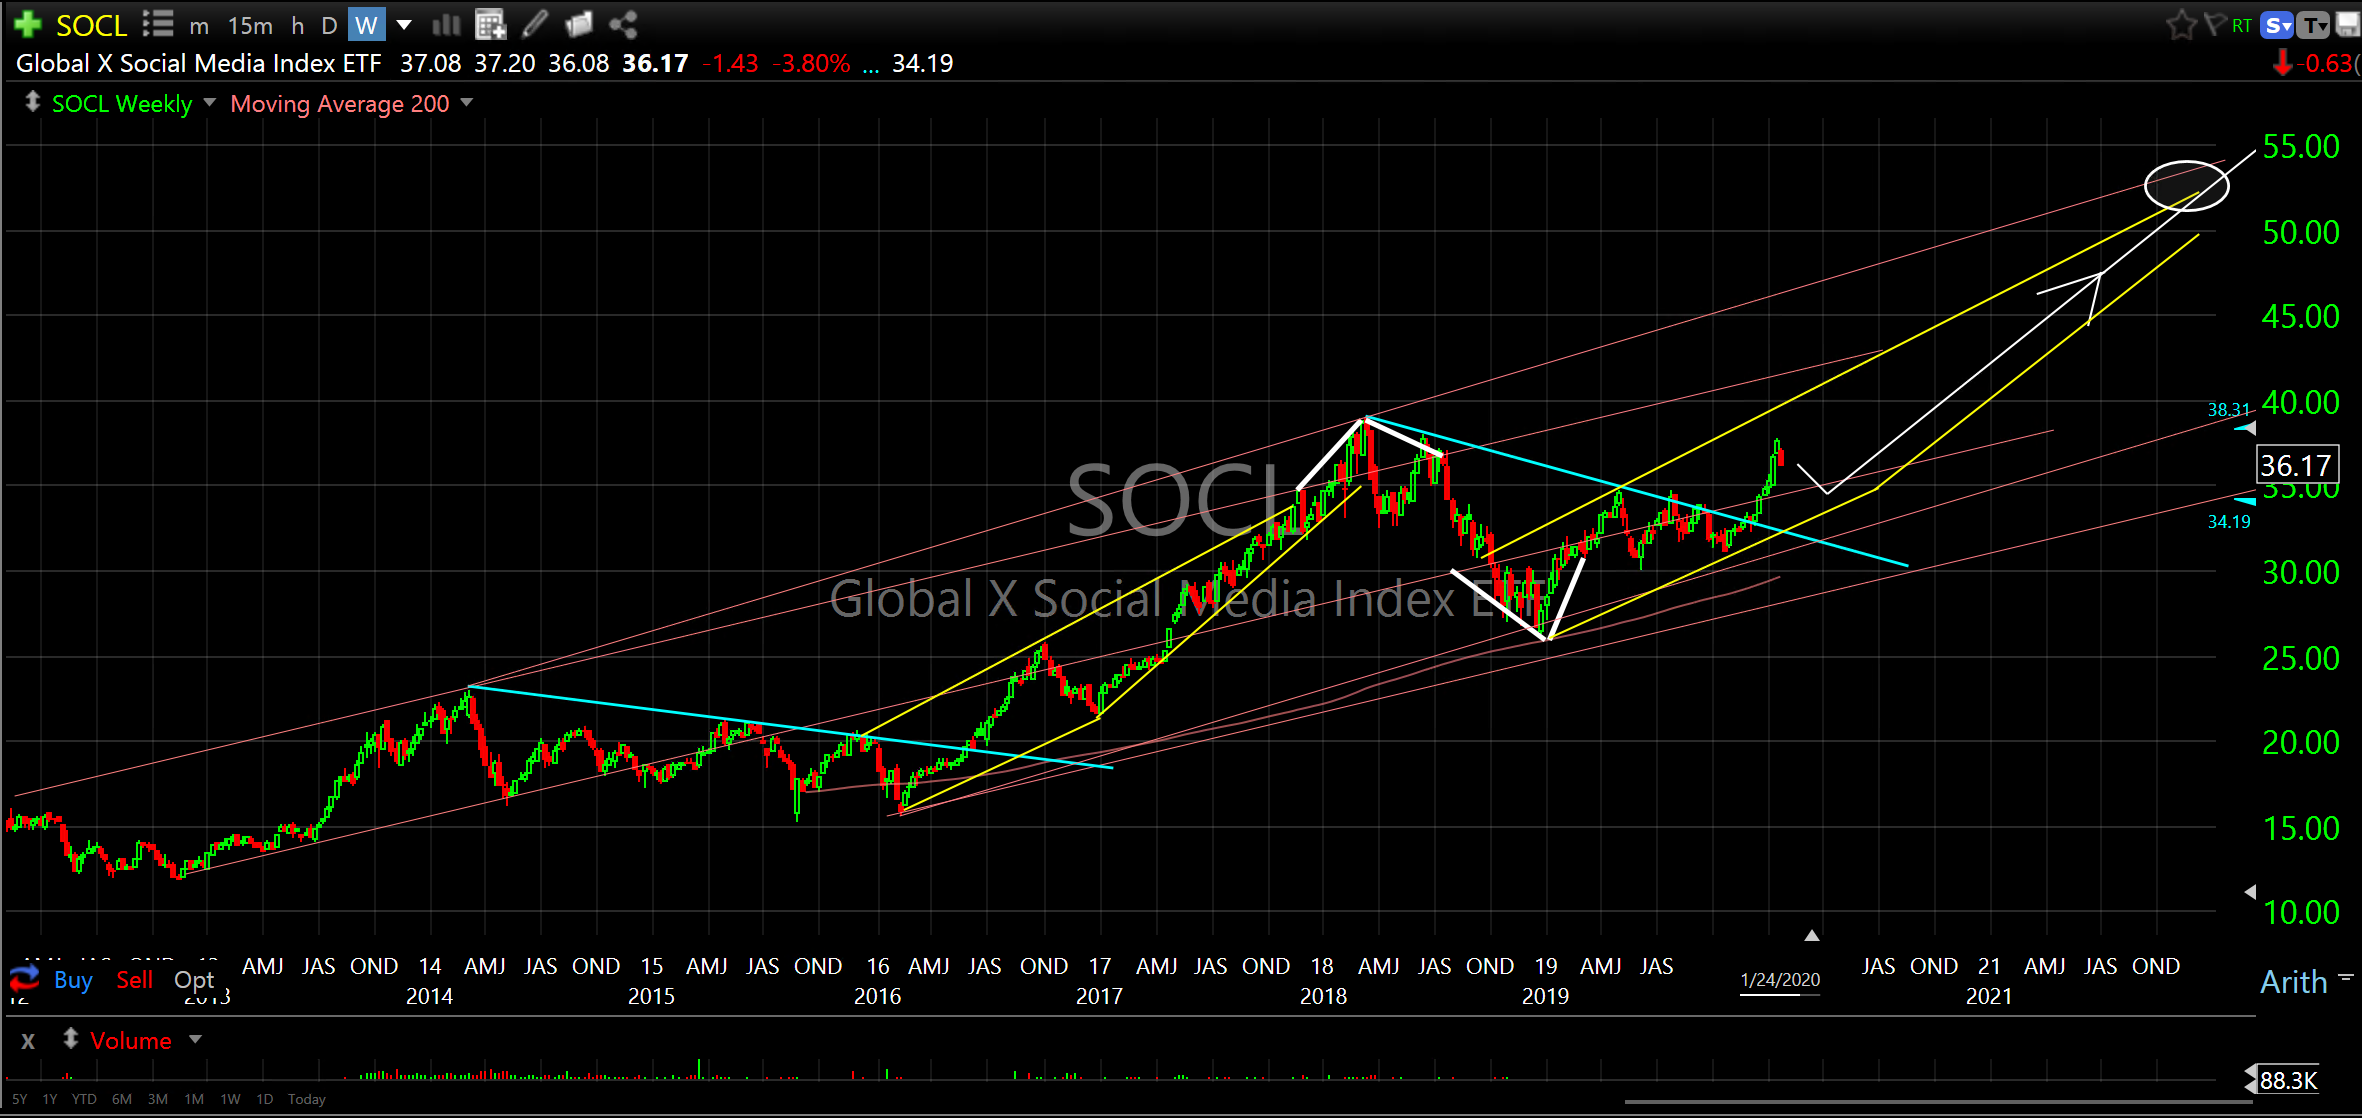
Except for FAS, XLC and SOCL, these are all on the Entry List located on the Trade Alert page. I will add these three towards the beginning of February when the dip will likely be concluded.
If you wish to begin a position or add to any of the ETF’s above consider waiting for the current dip to conclude.
Please be aware, some of these instruments are leveraged and meant for shorter duration trading. They are noted with an *.
Here is a link that provides more fundamental data on ETF products.
Over the course of the next couple of weeks (during the expected dip) I will filter through my favorite individual stocks (most of which are on the Entry list and mentioned in previous weekly reports) that look to be best positioned for the next expansion ramp which should last into April. I will share them over the course of the next few weeks.
That’s all folks,
Don