Cycle Positioning
All instruments trade in measurable cycles. Broader market indexes, sectors, ETF’s, individual stocks, commodities, currencies and debt each have their own distinct cycle. Cycles have three main characteristics: expansion, collapse and consolidation. (Float/Volume rotation can be included). If we can identify where price is positioned in the cycle we can identify the reversals. If we can identify the reversals we can make a lot more money in a shorter period of time than just buying and holding. We would actually know when to hold ’em and when to fold ’em.
This is how entries and exits are identified. This is how to buy and sell stocks better than anyone you know. This is what I try to do. So far, so good.
Where are we positioned in the current cycle? Let’s take a look.
Broader Market Update
All major averages couldn’t look any better although we did have an exciting news inspired Dow 700 point overnight reversal event last week. Other than that, indexes, sectors and yields are positioned perfectly in the cycle we are currently in. Here is a look at the Dow from 2017 with my price projection out to September 2020. I’m in “buying all dips” mode until further notice, including levered index products like the ones you will find on the Trade Alert page under “Entries” on my website that were entered early last November. Note levered products are designed for shorter term trading.
SPDR Dow Jones Industrial Average ETF (DIA) daily..2017-2020

Here is a longer view of DIA from the bottom in 2009 with my price projection out to 2021. For now, price scales out to near 350 in late 2020 before any recession related broader market collapse/correction. Yields need to get higher before an event like that is likely to occur. Current equity/debt cycle positioning calls for yields to rise during 2020 with sideways action through summer then proceeding higher in the back half of 2020. Please see all notes on chart. Cycle Positioning: Expansion
SPDR Dow Jones Industrial Average ETF (DIA) weekly..2009-2021

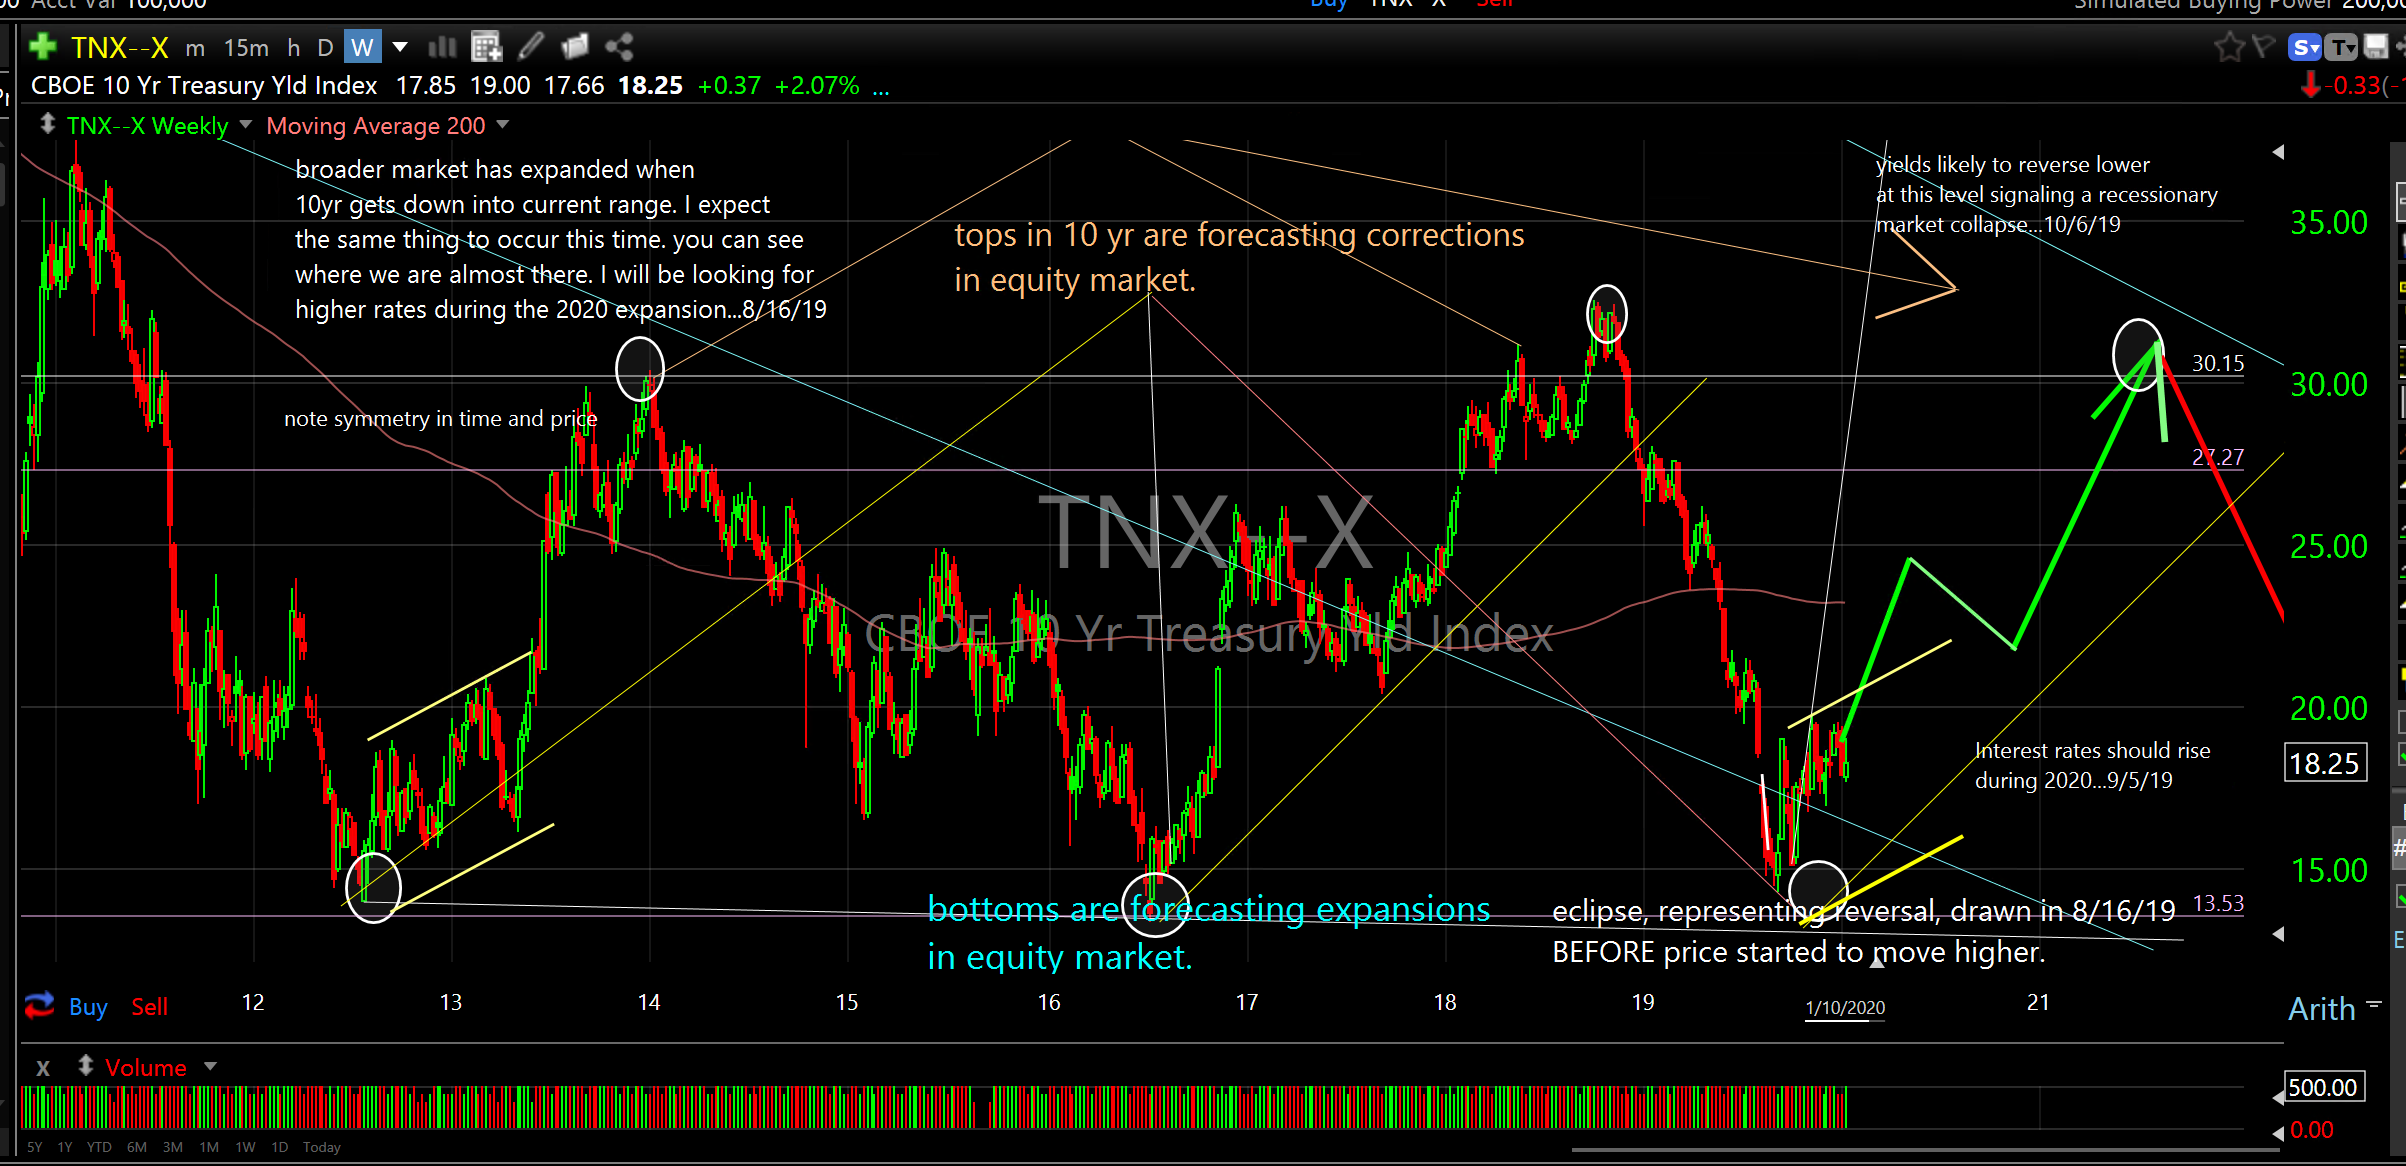
A look at the 10 year Treasury shows yields following the reversal/projection I made last August. Yields should continue to track the green line and move towards 30.00 before any deep, significant equity market event occurs.
CBOE 10 Yr Treasury Yield Index (TNX-X)..weekly..2011-2021
Small Caps historically catch up late in the cycle and are positioned to do exactly that. They are just now crossing over the top of the range they have been in since the beginning of 2019 and are right in the middle of the expansion channel from the bottom in late 2018. They look very buyable on dips. I included both the Small Cap ETF (IWM) and the 3X leveraged ETF product (TNA). Already on the Entry list. Cycle positioning: Expansion
iShares Russell 2000 Index Fund ETF (IWM)..daily 2015-2021

Direxion Small Cap Bull 3X Shares (TNA)..daily..2015-2021

Hot Charts
Four of my favorite charts this week are a major drug manufacturer, a 3D printing company I have been sharing with you for months, another software application company and a large investment/insurance company. They are all positioned well.
AbbVie Inc (ABBV), a drug manufacturer with almost $33B in sales, is positioned to move higher before getting really steep later in the year, ramping to $130 with a chance to get to $170. All this while paying a dividend of almost 6%. Consider legging in to establish a full position on an expected late January/early February dip. I’m putting this on the Trade Alert page as an Entry. Cycle positioning: Expansion
AbbVie (ABBV)

I highlighted DDD a couple of weeks ago and I put it on the Entry list on April 4th, 2019. My post, “Cycles, Channels, Reversals and Phase One Done”, dated December 16, 2019, shows a deep dive into the historical price cycle repetition characteristics of 3d Systems Corp. It continues to make new highs from bottoming in August and should fill the gap up to $10.50 before the next periodic retracement reversal. Look at the shorter term chart below to see the spike from last week which is exactly what we were looking for. This could easily get to $15.00 by May. Cycle Positioning: Expansion
3d Systems Corp (DDD)..daily..2019-2020

You know I love software companies. Everbridge (EVGB) looks like many others in the group; ready to rip higher. I have three separate price projections on this chart and I would be happy with any one of them. Like the others I have been highlighting over the past few weeks, this one is positioned really well. Price should start crossing over blue line resistance soon and be up near $140.00 by summer. Cycle positioning: Expansion
Everbridge (EVBG)..daily..2018-2020

Financials are the new tech sector. I have shared most of my favorites over the past year and began getting really bullish one year ago this week when I put a bunch on the entry list. Make sure to check this one out if you missed it recently. Principal Financial Group (PFG) looks right on track to begin the section of its cycle that just rips higher. Previous expansion channels (yellow line) have returned 300%,100% and 120%. The current channel appears to scale out at about $90.00, close to a 90% gain. This one looks like it’s really close to launch. Cycle positioning: Expansion
Principal Financial Group (PFG)..weekly..2009-2022

If you have been following my research you understand how accurate cycle positioning analytics can be. You understand how charting can reveal expansion, collapse and consolidation channels. You understand the importance of identifying the reversals. You have seen the accuracy of entering trades at reversal bottoms and exiting at reversal tops. You have seen how the broader market influences sectors and individual securities. You have seen the relationship between equities and debt. You have seen how we can make a lot more money in a shorter period of time than just buying and holding. You can see when we should hold ’em and when we should fold ’em.
So far, so good.
Current Cycle Positioning: Expansion
I’m pushing all in,
Don
PS. This is not personal investment advice. Do your own due diligence.