Analyzing the components of any index or ETF is important. Long term trend analysis and relative performance of each component can reveal the health of the overall index.
It takes a long time to analyze every stock chart in the S&P 500 index. 85 hours to be exact.
An easier way to accomplish this is to analyze each of the 30 Dow components and each of the S&P 500 Index sectors. The Dow and the S&P 500 index have a very high correlation despite the fact that the Dow is only 30 stocks and price weighted compared to the S&P 500 index having 500 stocks and is market cap weighted.
Dow Components
Twenty-two of the stocks in the Dow are in long term uptrends. Eight are not. Of the eight, only two have been in multi year downtrends; IBM and you guessed it…Walgreens (WBA), which replaced GE (an original Dow component) this week and which of course has been in decline since 2001. The other six are either sideways or sideways with upward bias; VZ,KO, DIS, XOM, WMT and PG.
Only two Dow stocks are in multi year downtrends and six have been going sideways for a long time. This is a pretty healthy index.
S&P 500 Index Sectors
XLF, the financial sector ETF, is in a long term uptrend from the bottom in 2009. Price is approaching the 2007 highs and has struggled for the past six months breaking intermediate support.
XLU,the utility sector ETF, is in a long term uptrend and shorter term looks like a good position to accumulate.
XLI, the industrial sector ETF, is in a long term uptrend but has broken intermediate support.
XLE, the energy sector ETF, is in a long term uptrend and shorter term looks like a good position to accumulate.
XLK, the technology sector ETF, is in a long term uptrend that is typically referred to in chart class as “Why didn’t you just put all of your money in that one a few years ago”?
XLP, the consumer staples sector ETF, has been in a long term uptrend from the bottom in 2009. Primary uptrend support was violated in February and price has declined since. Any time this type of support is violated it is a significant event. Price has been under performing since.
XLV, the health care sector ETF, has been in a long term uptrend from the bottom in 2009. Intermediate support was broken earlier this year and price has been trading sideways since.
XLB, the materials sector ETF, is in a long term uptrend and has been trading sideways for all of 2018.
XLY, the consumer discretionary ETF, is in a long term uptrend from 2009 and is rising like a rock star.
Long term uptrend seems to be the common denominator. Certainly, a significant violation in consumer staples (XLP) and shorter term violations in financials (XLF), industrials (XLI), health care (XLV) and materials (XLB).
Relative Performance Analysis
Comparison Charts
1999 (just before “dot com bubble”) to now
S&P500 Index ETF (SPY) monthly
1999 – Present
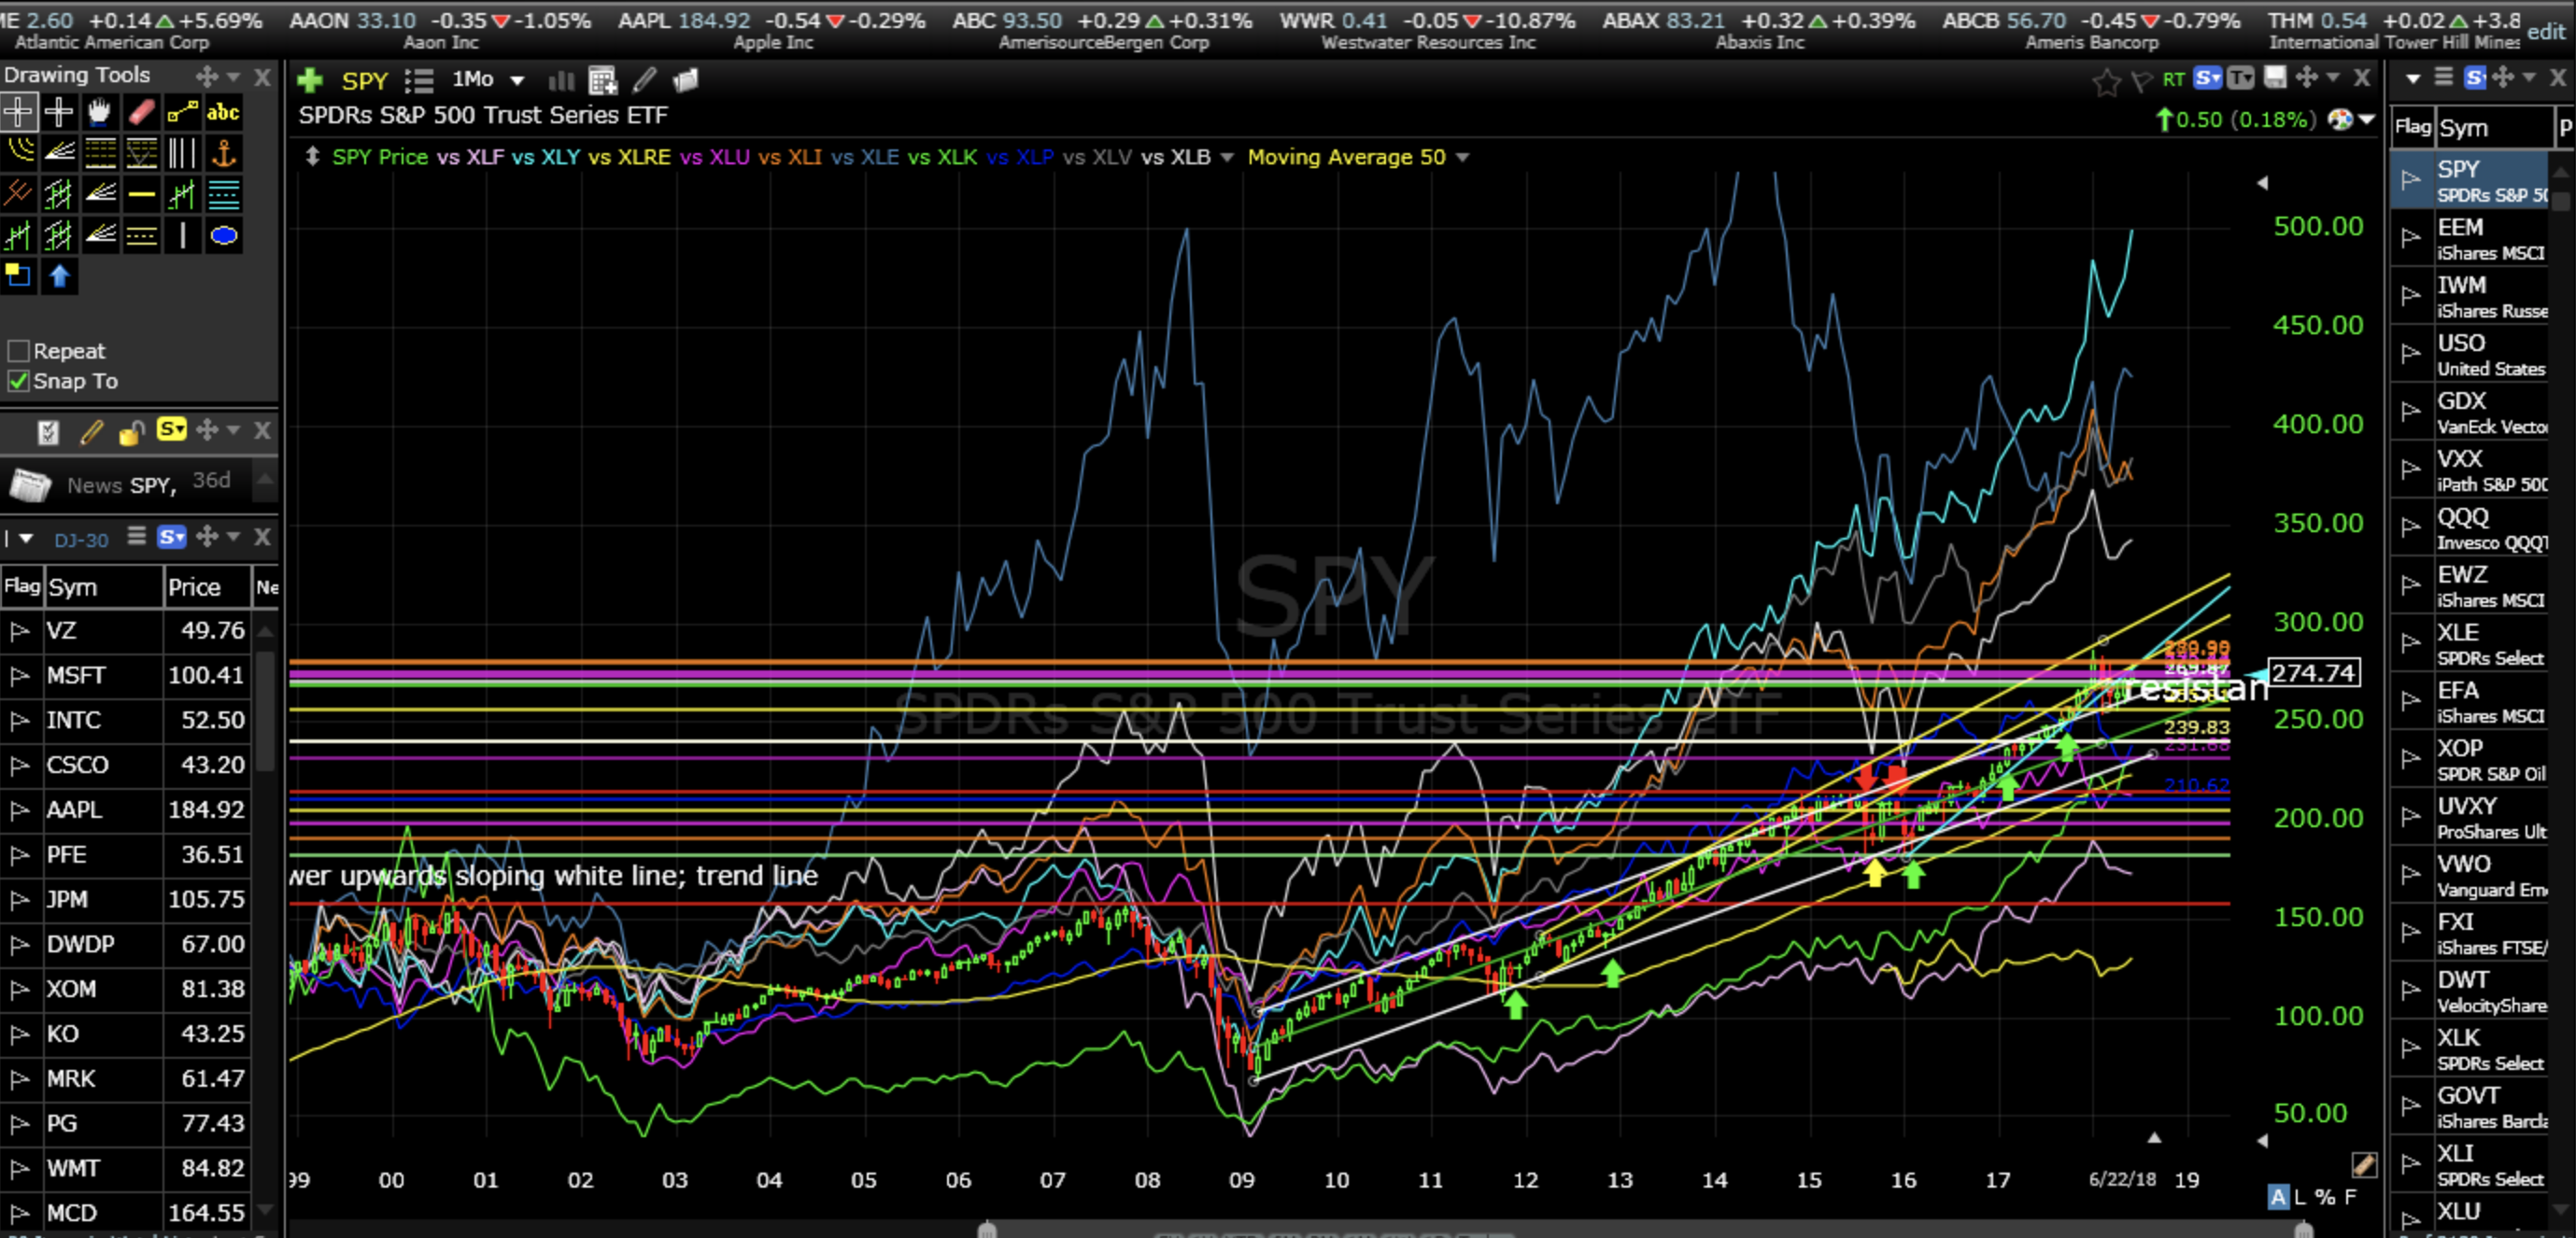
The best performing sector has been consumer discretionary (XLY) followed by energy (XLE) and health care (XLV). The worst performing sectors from 1999 have been financials (XLF) and technology (XLK).
2009 (the beginning of the current bull market) to now…
S&P500 Index ETF (SPY) monthly
2009 – Present
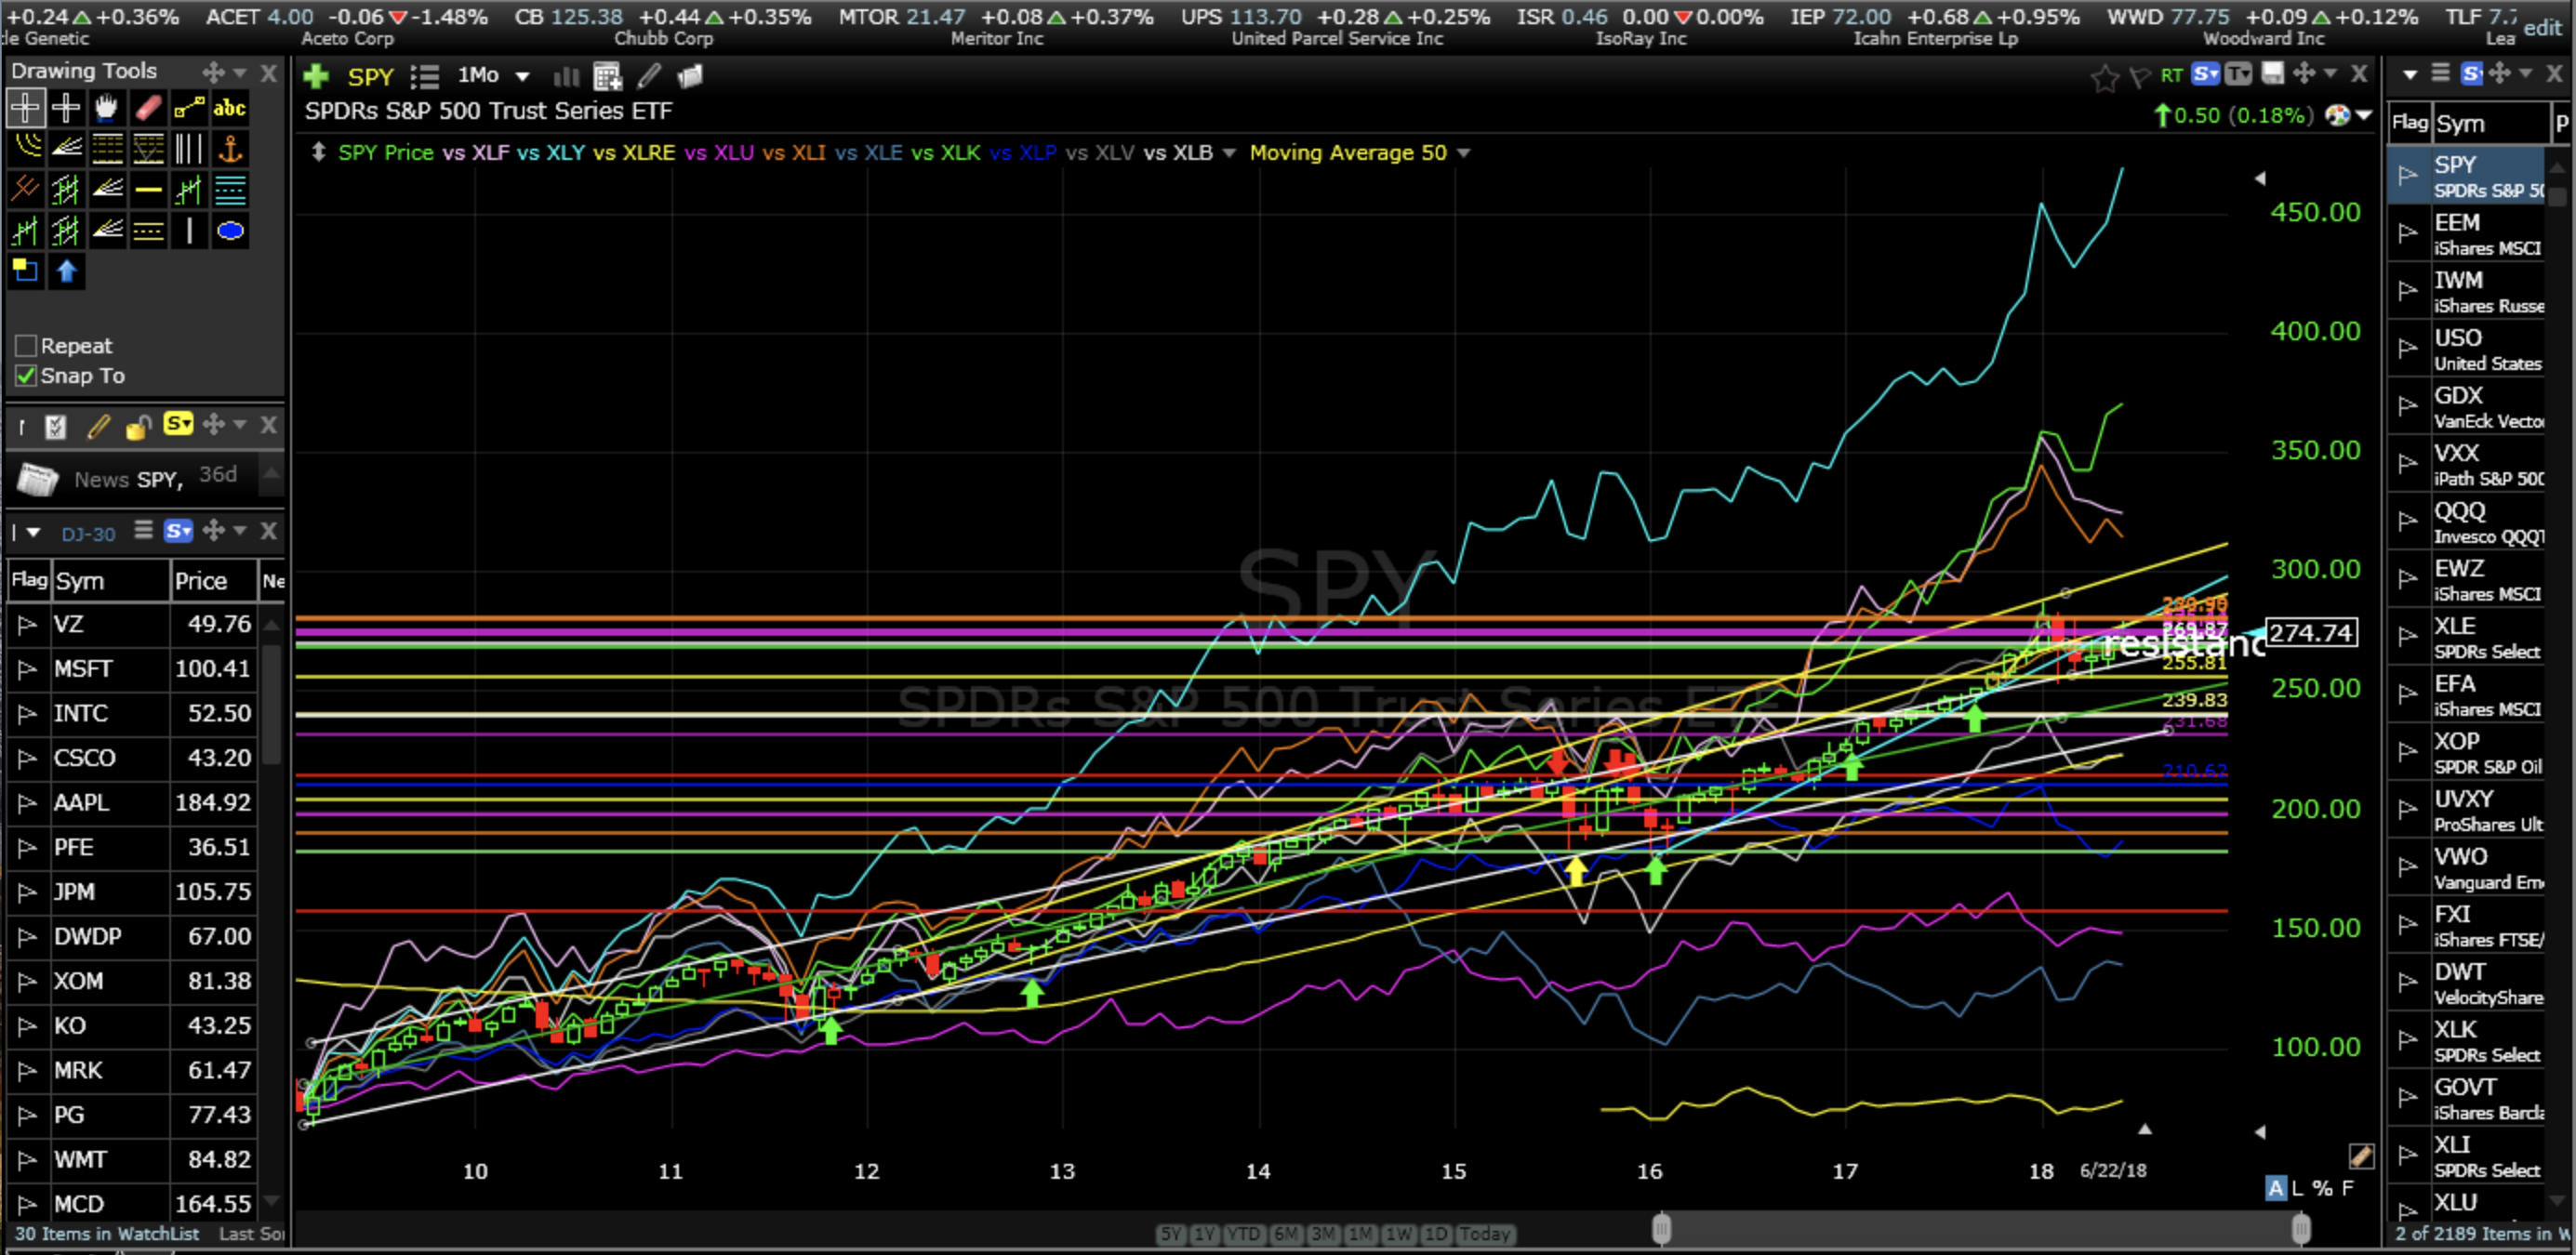
The best performing sector in this shorter period of time from the bottom of the “financial crisis” is still consumer discretionary (XLY) followed by technology (XLK) which was one of the worst performers from 1999. The worst performing sectors from 2009 are energy (XLE) and utilities (XLU).
January 2018 to now…
S&P500 Index ETF (SPY) weekly
January 2018 – Present
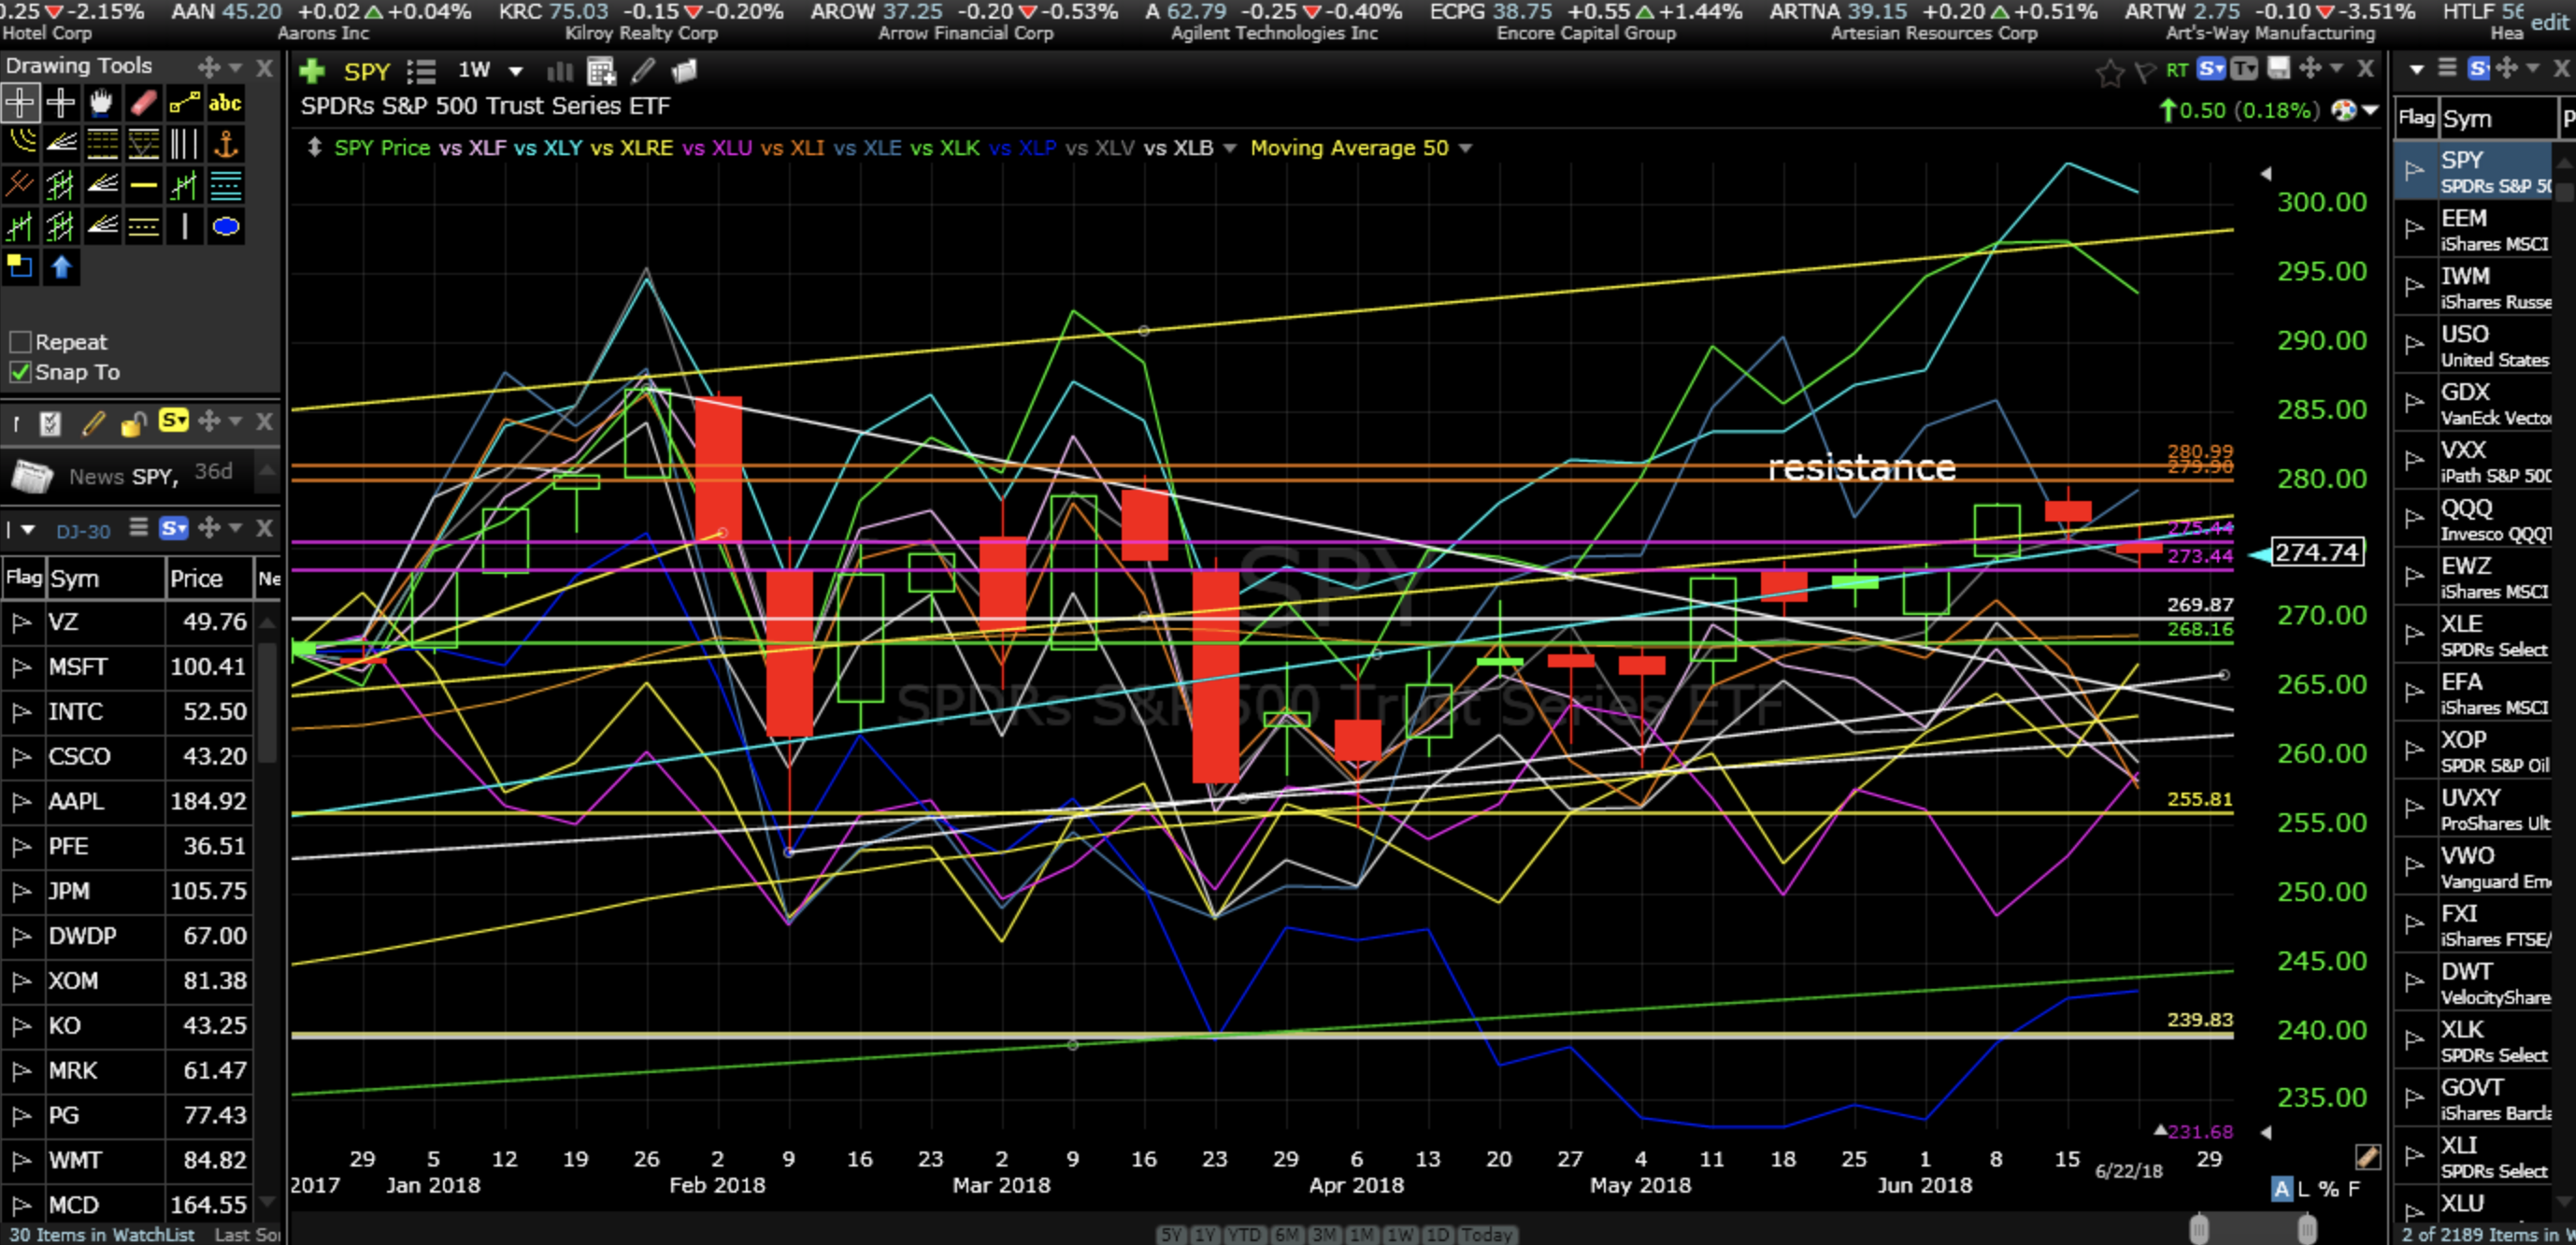
Consumer Discretionary is still the leader along with technology (XLK) for calendar year 2018 and consumer staples (XLP) is the under performer year to date.
Relative performance confirms that consumer staples (XLP) has led under performance since breaking primary support in February of this year. Please note this underperformance correlation since breaking primary support. Expect relative under performance if and when other sectors break primary support.
20+ year Treasury Bonds (TLT) weekly
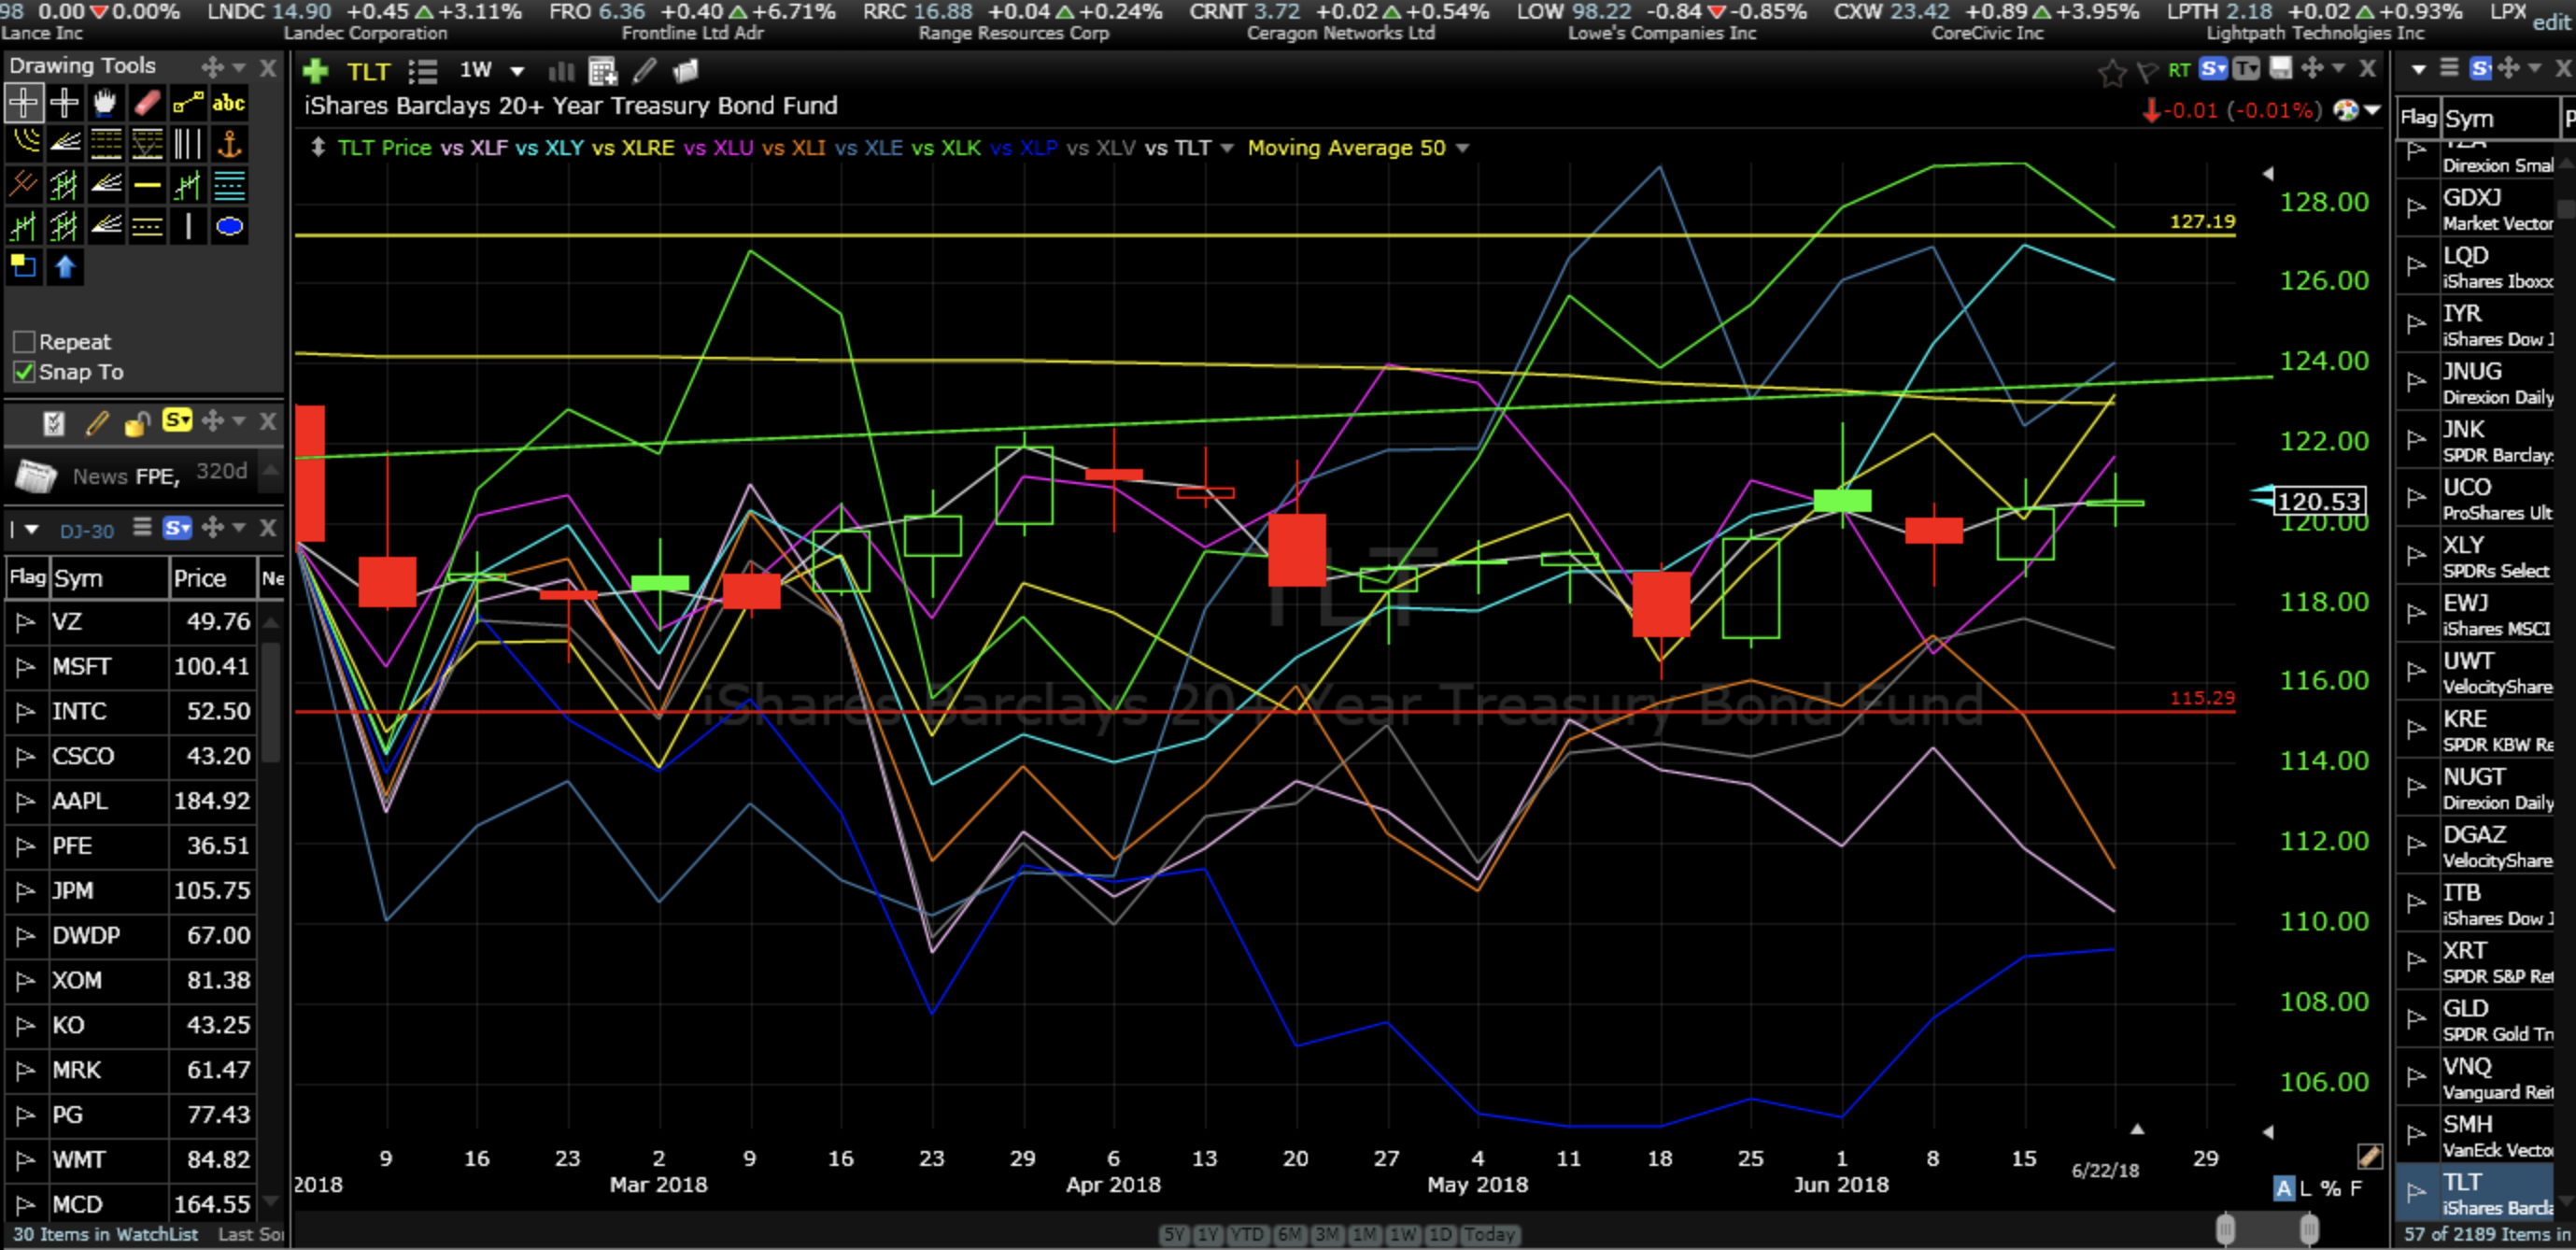
Also the weekly chart of 20+ year Treasury Bonds (TLT) with performance measured from exactly when (February this year) TLT violated a rising support area from 2011 shows the initial selloff of all equities then strangely the chart shows significant under performance of financials (XLF) as interest rates rose. And, of course, technology (XLK) and consumer discretionary (XLY) continue to rip.
Trend Characteristics Lead to Performance Characteristics
So, the Dow looks pretty healthy based on the math. The S&P 500 index has only one sector that has broken trend, consumer staples (XLP), and a few others are having shorter term trend breaks. Relative performance confirms these trend breaks. Bonds (TLT) are under pressure since violating support and further declines will get the full attention of buyers and sellers ramping up volatility again. Consumer discretionary (XLY) and technology (XLK) continue to rock and lead the index while trading well above support.
Although it is impossible to predict what will happen in the future, The Dow and S&P 500 index appear healthy with minor ailments. I would continue to hold open recommendations for now and be open to taking advantage of new opportunities as they arise. With multiple intermediate support breaks it wouldn’t be unusual to see a 2%-3% correction prior to exceeding the March highs but will look for the opportunity to buy the dip again.
Carry on mates.
I will be sharing a review of the following open recommendations later in the week…
XRT, XLU, SMH, ILF, SPY, DIA, QQQ, XLK, KBR, MS, SQ, INTC, XLF, XLV, FEZ, IEMG, MCHI, SCHF, SOCL, FB and XLE.
Have a great week!
Trade Smart,
Don