I wish you a wonderful week with your loved ones.
Before I begin, let me get this out of the way…Are the pundits on CNBC actually getting paid real money for talking nonsensical doublespeak gobblygook that has zero value in the real world of buying and selling stocks. I can name only one who has been even slightly bullish for 2020. They have taken the art of neutral, smart sounding, unaccountable, echo speak to a new extreme. How can I say, NOT HELPFUL IN THE REAL WORLD PEOPLE.
OK, I got that out of my system. sorry.
Broader Market Review
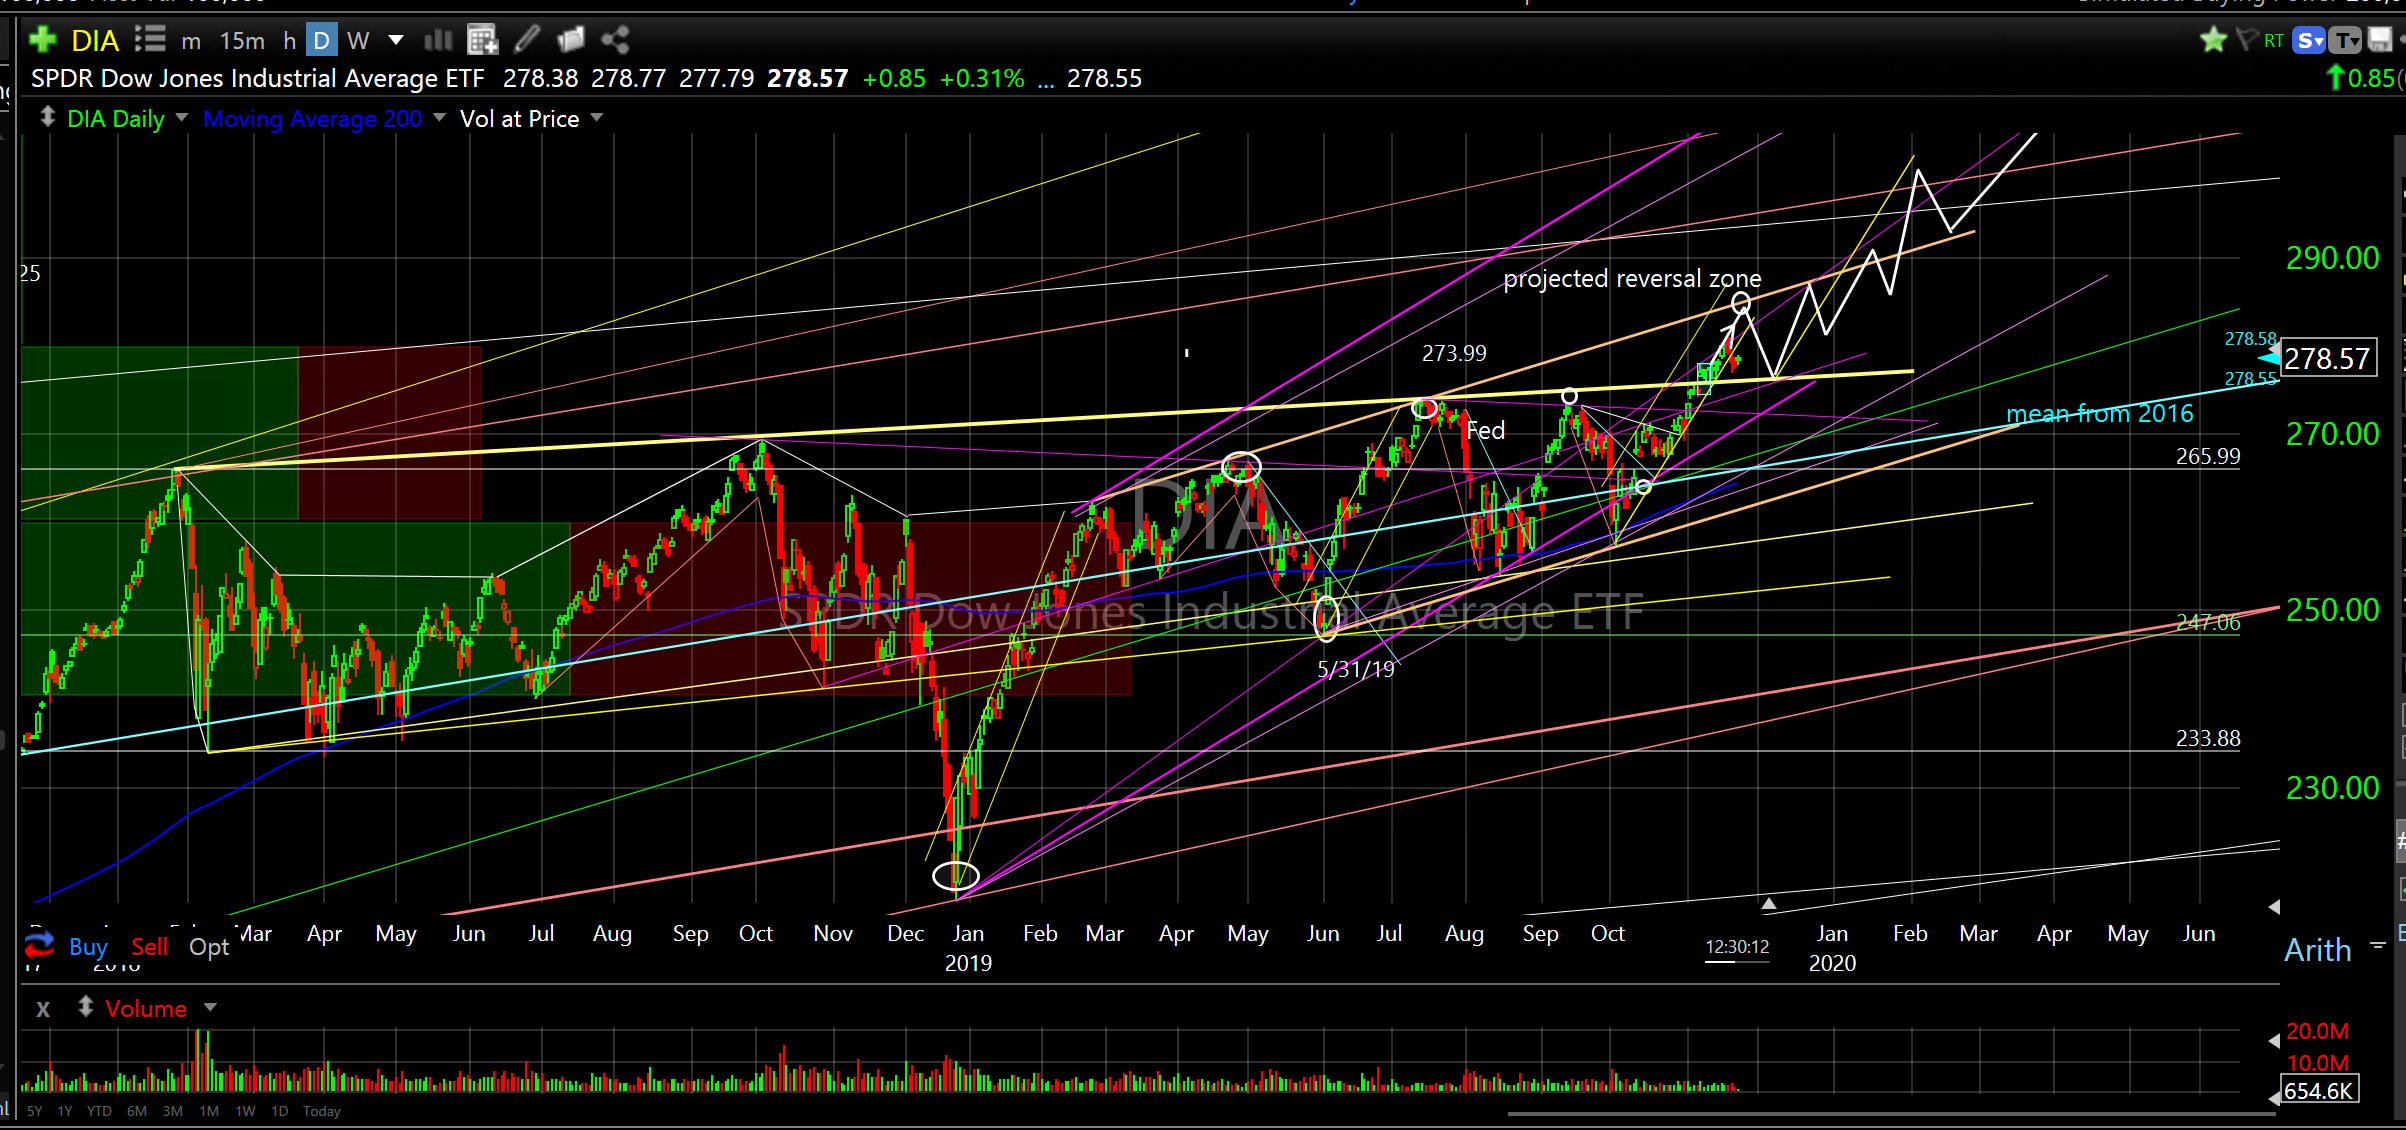
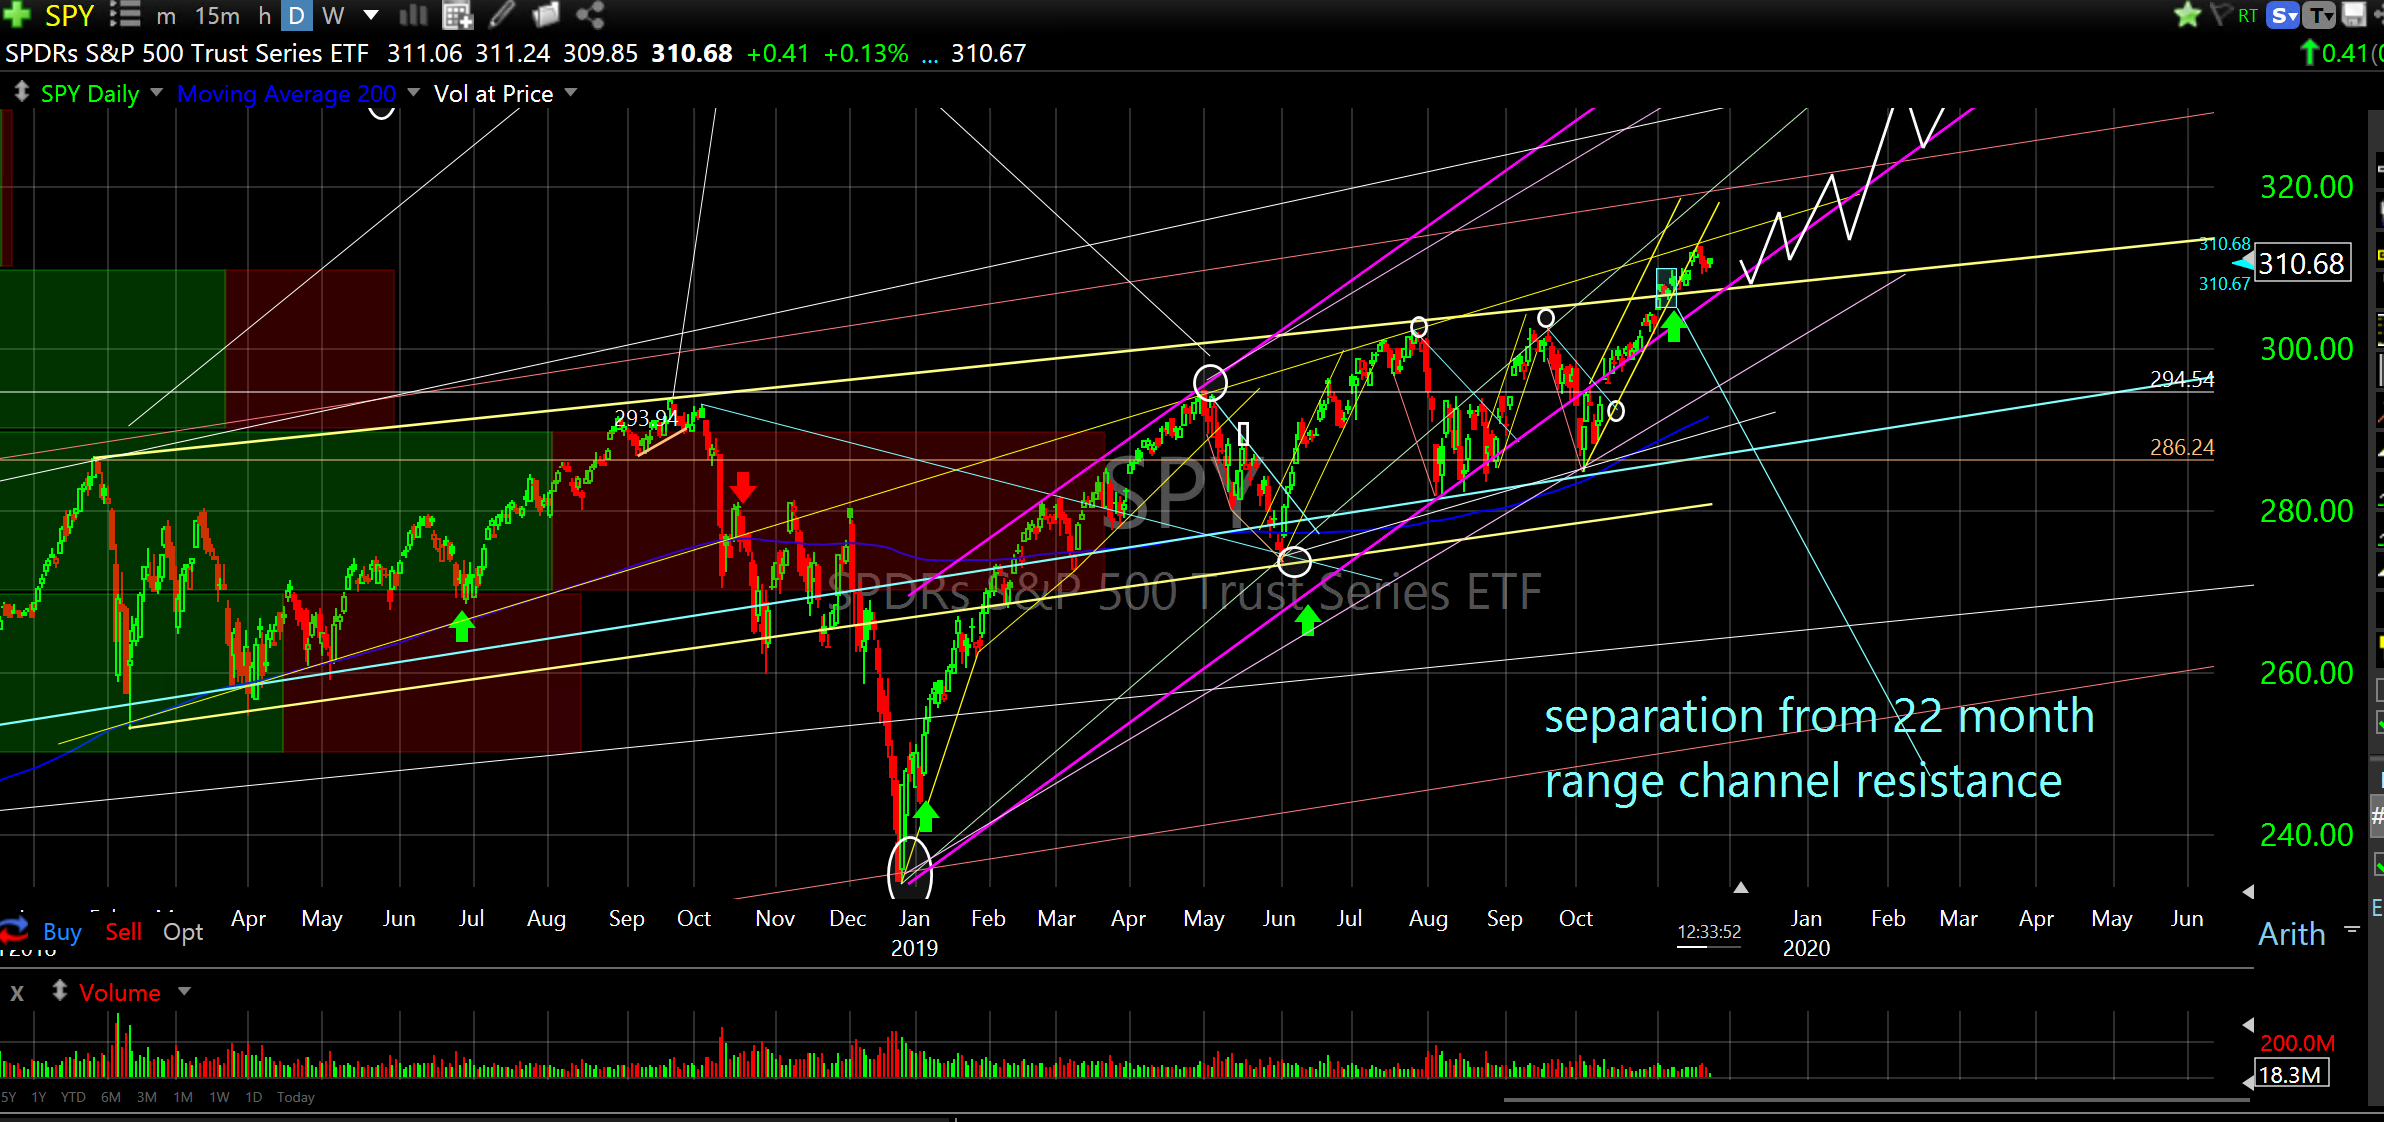
The broader market is behaving exactly as expected; ramping higher. It’s the beginning of the flight ladies and gentlemen so sit back, take your shoes off and enjoy the ride. While we expect a few bumps along the way it doesn’t appear we will experience anything too deep. We might encounter some dipsy doodles as we pass over the north end of November into December then a slight course adjustment vectoring to a higher ceiling late December and into early January. This new ceiling could fade us back into late January before a steeper climb higher in February and March setting up a gradual smooth ascent into summer.
As we go forward and collect more data I will continue to update the predictive modelling price projections (our flight plan), however, the bottom line is, after crossing up through its eleven year ascending mean six weeks ago and then releasing and separating from 22 months of consolidation which included a 19% collapse combined with all of the evidence I have published over the past many months (archived and available here) how could one argue anything but a robust expansion during 2020. Mean reversion occurs through time or price. We have just done both during the past 22 months. Ladies and gentlemen, prepare for takeoff.
The broader market ETF index charts below offer a visual analysis of what has transpired from early 2018 and what is likely to occur going into 2020.
DIA
SPY
QQQ

Review of the Bottom Dwellers and a Little Profit Taking
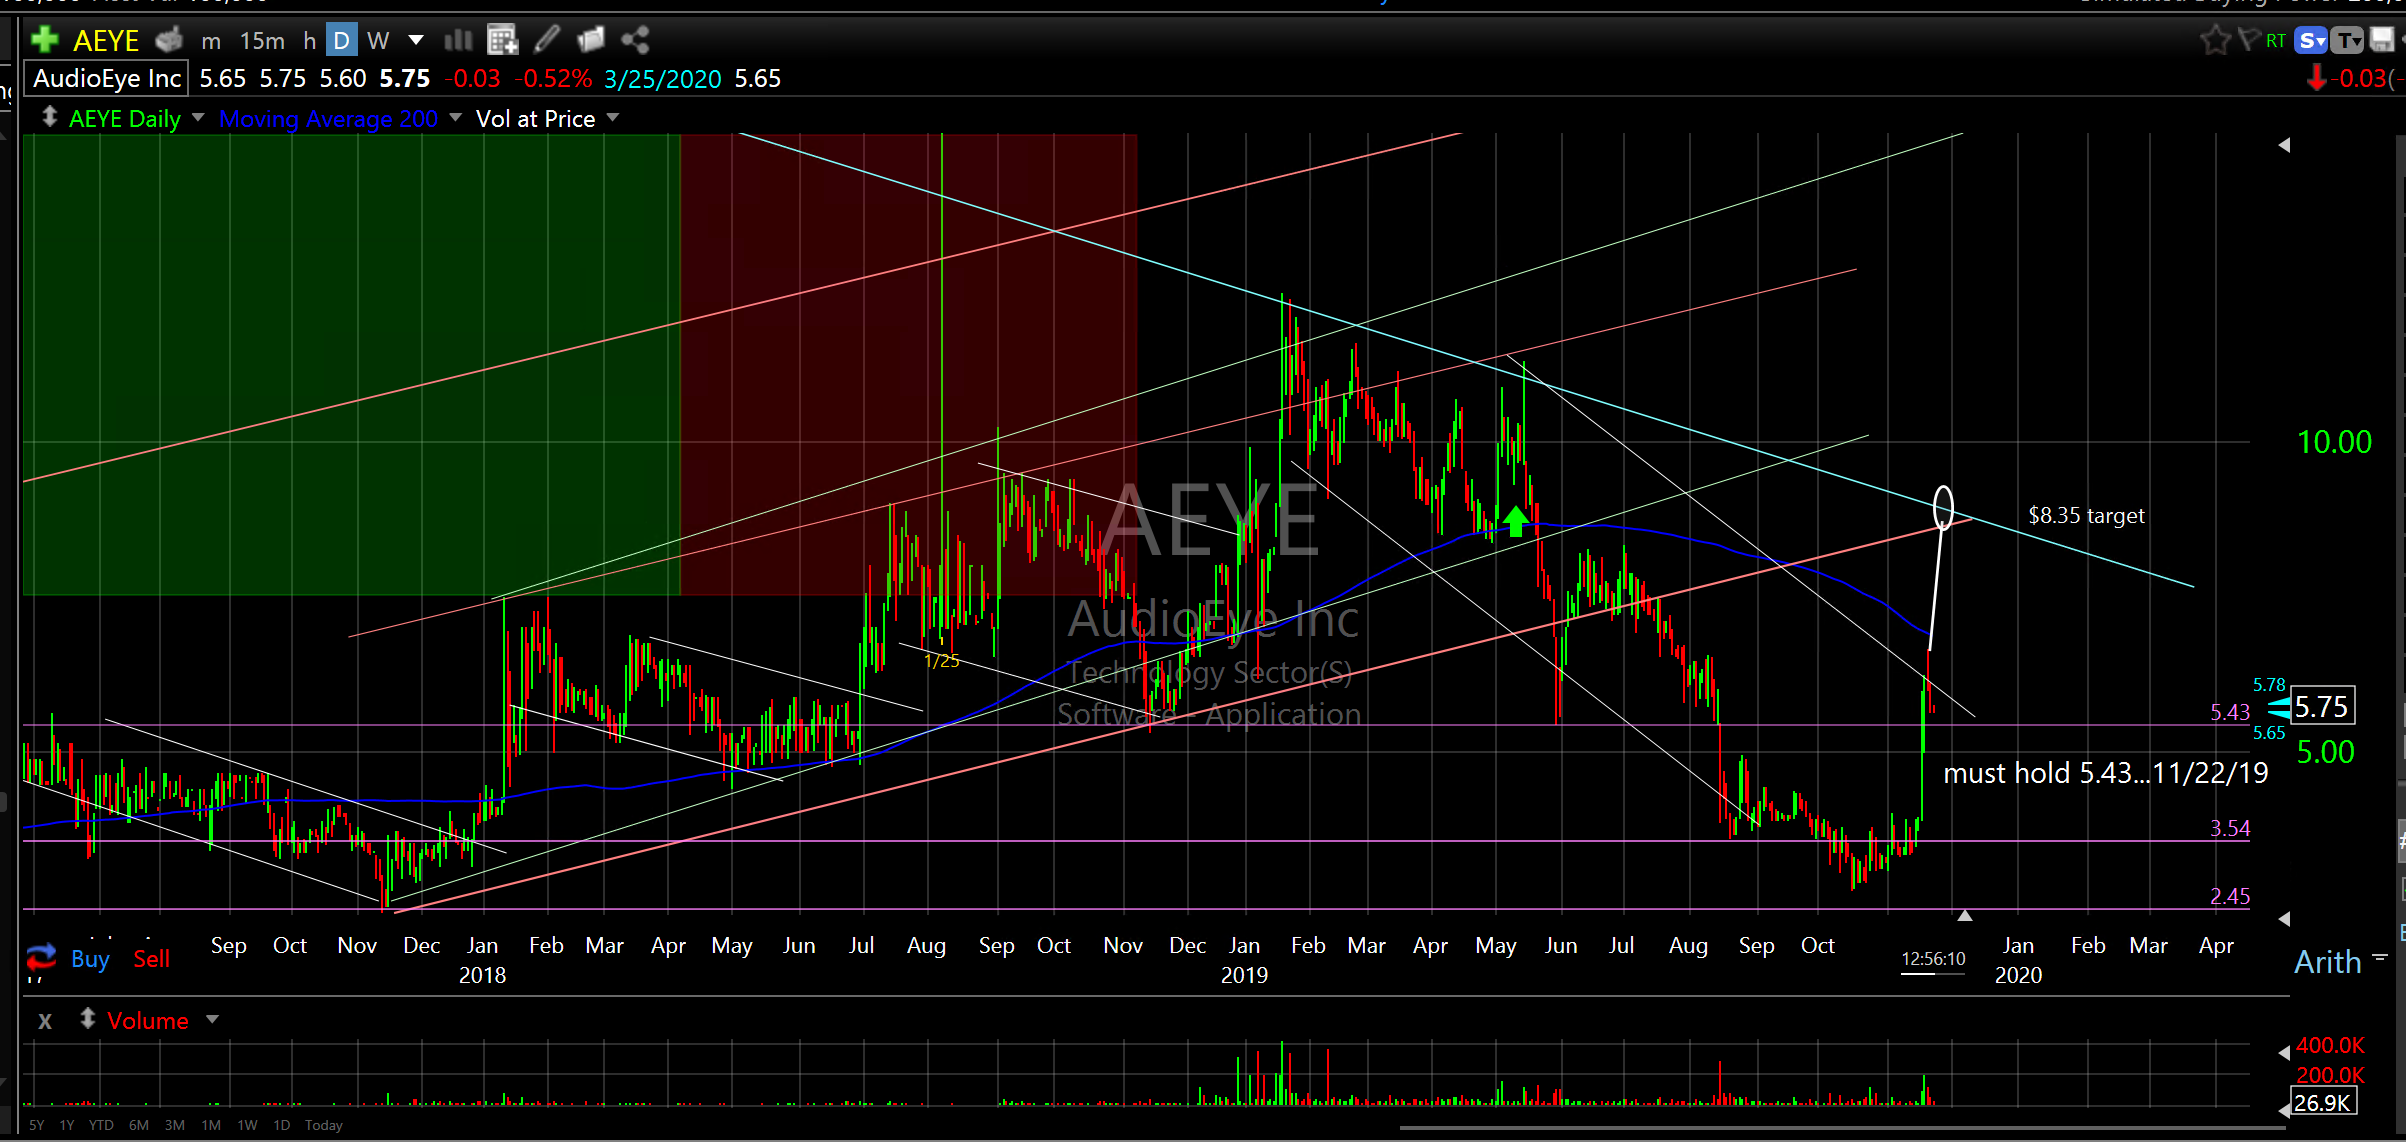
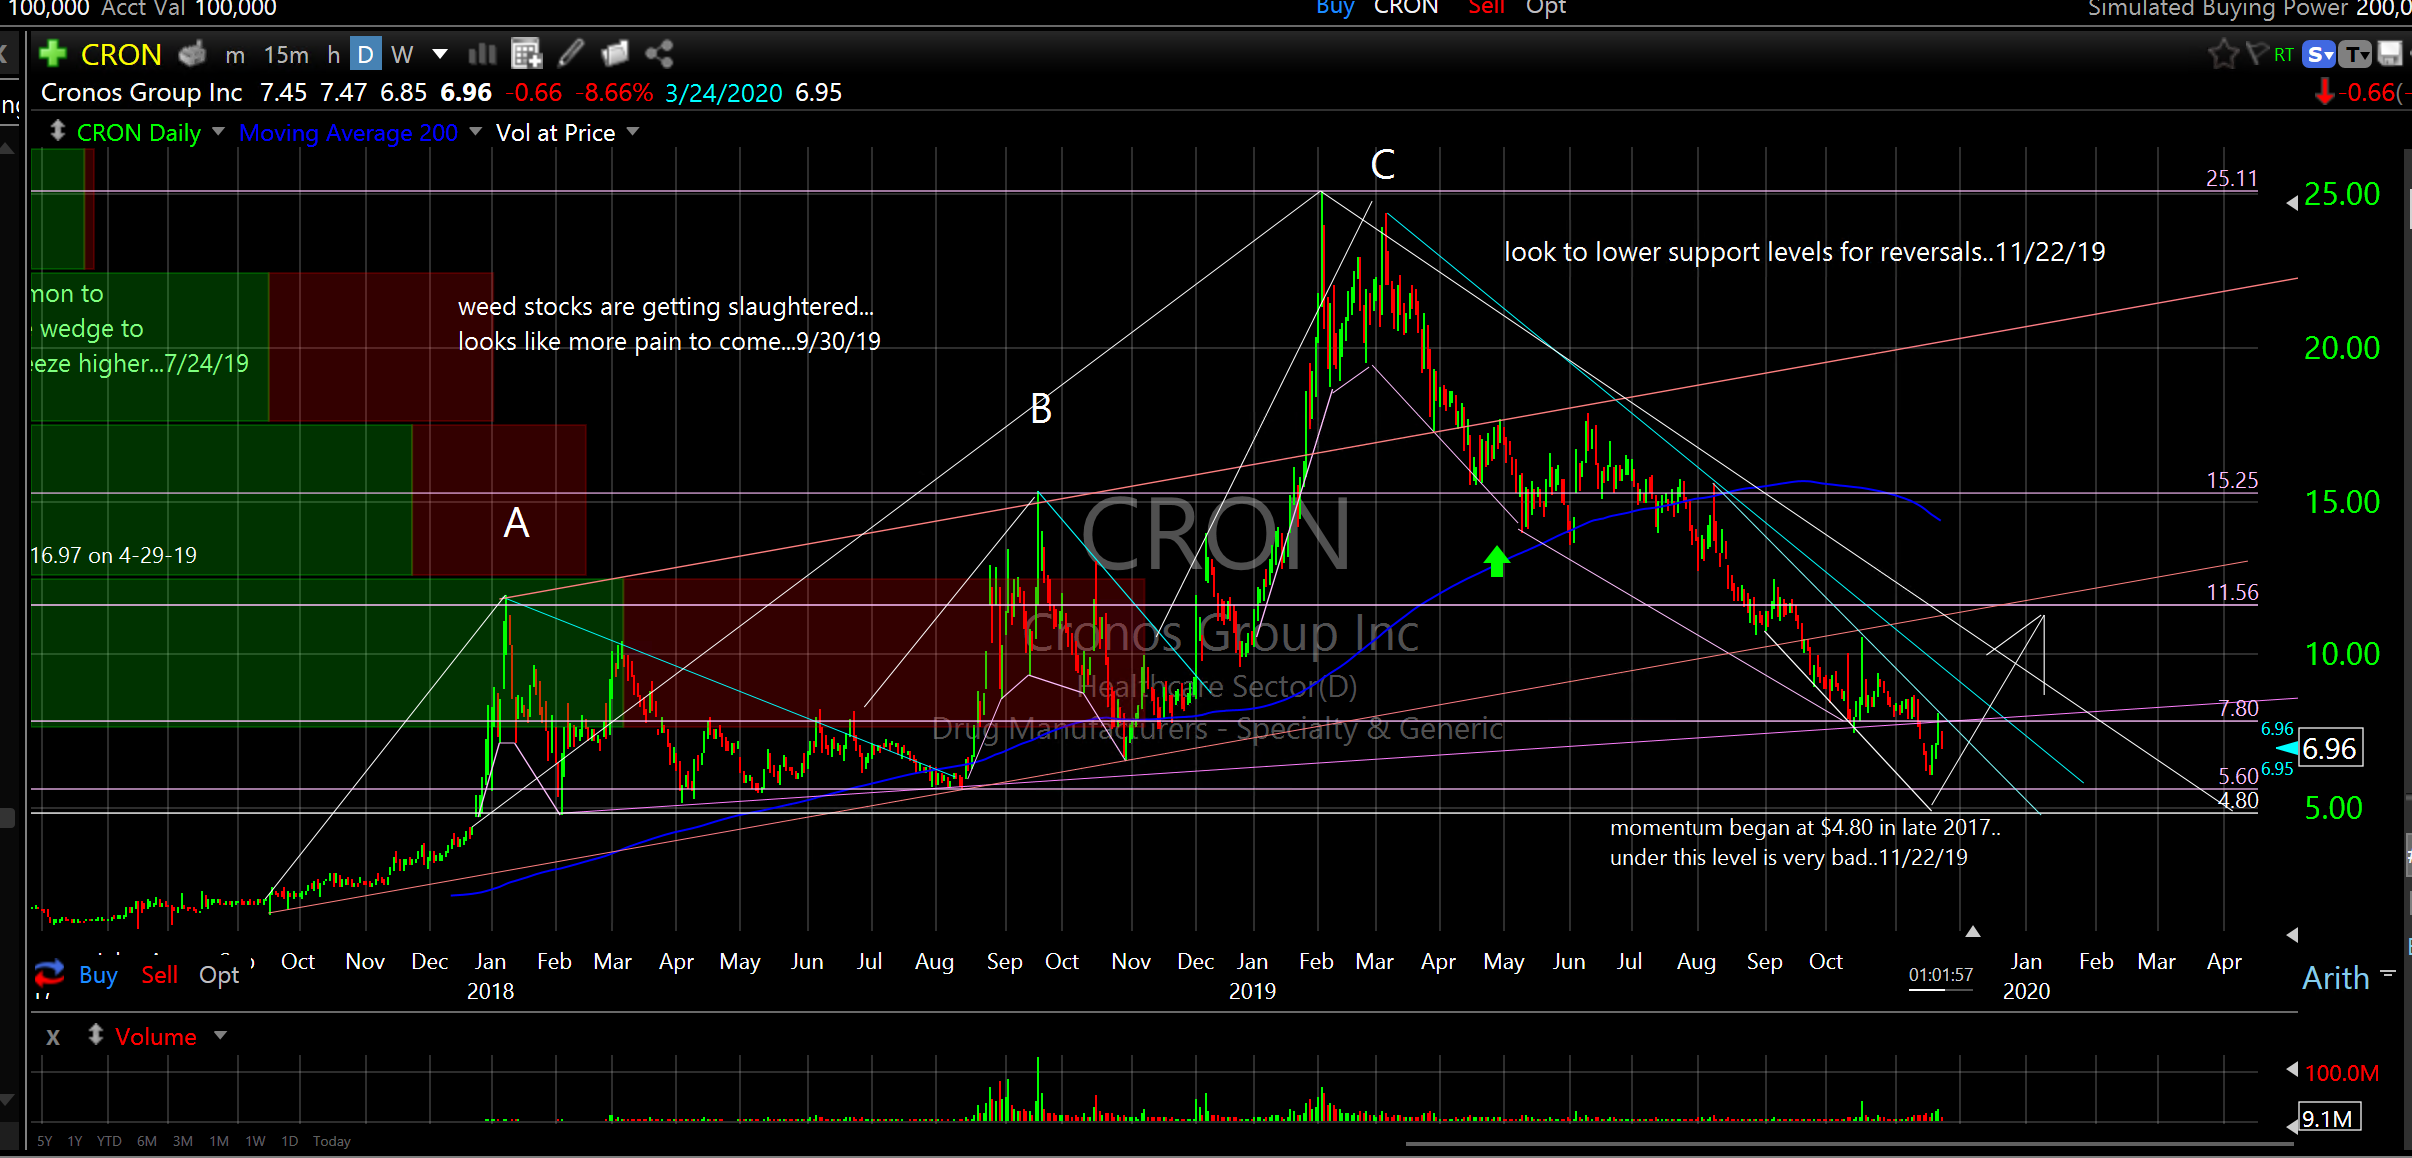
While the vast majority of entry ideas are performing as I have projected, there are a few that are either delayed or at risk of further deterioration. In addition, there are three full or partial exit ideas for profit taking. All notes, annotations and trade ideas on charts.
DDD

AEYE
CRON
EDIT
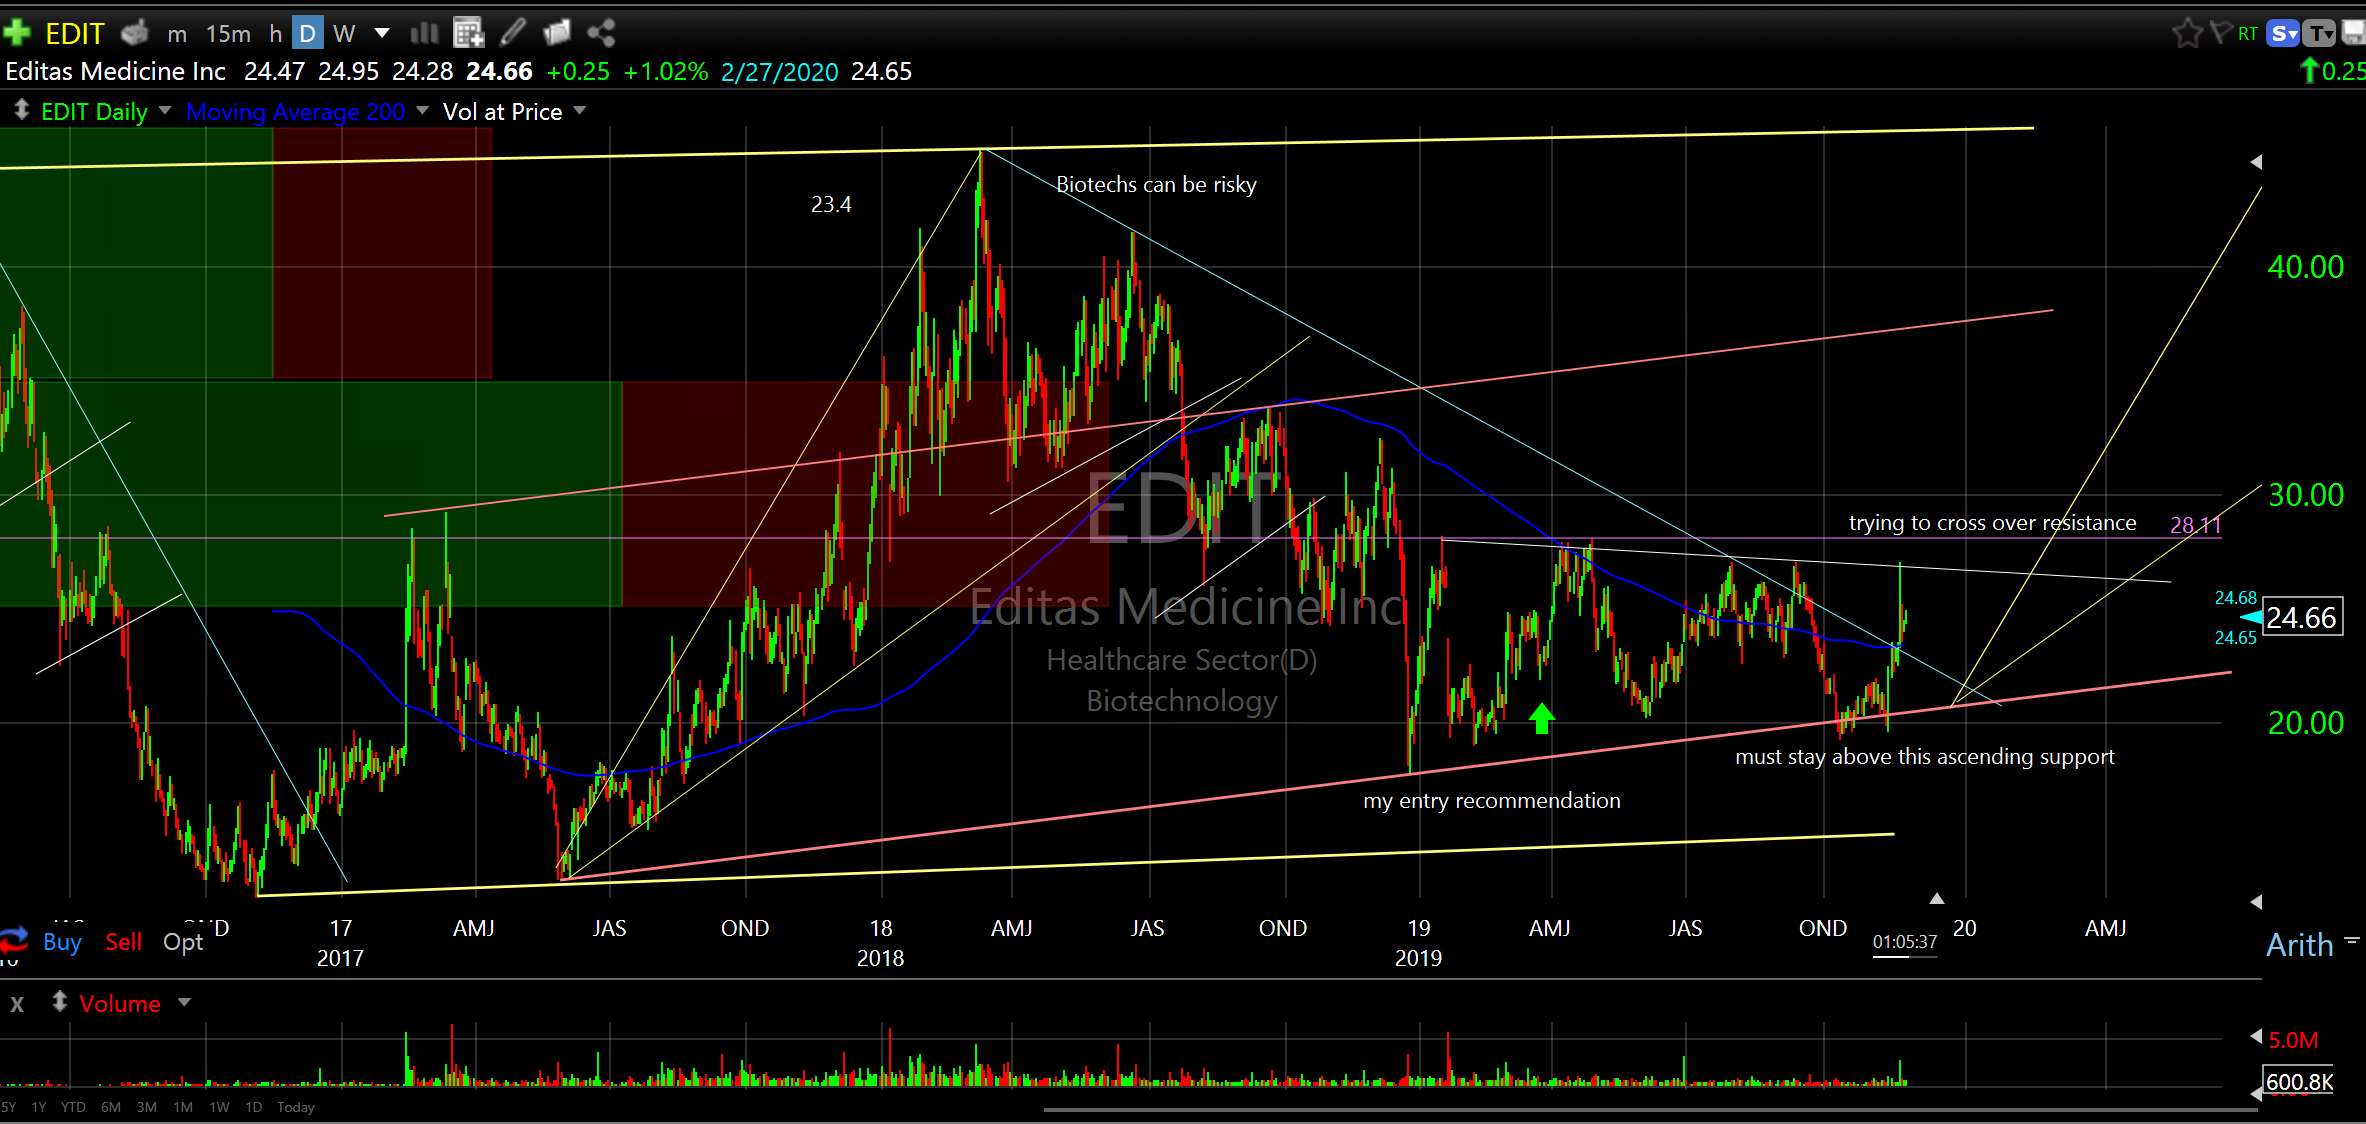
GBTC

NBEV

CRC

WDC
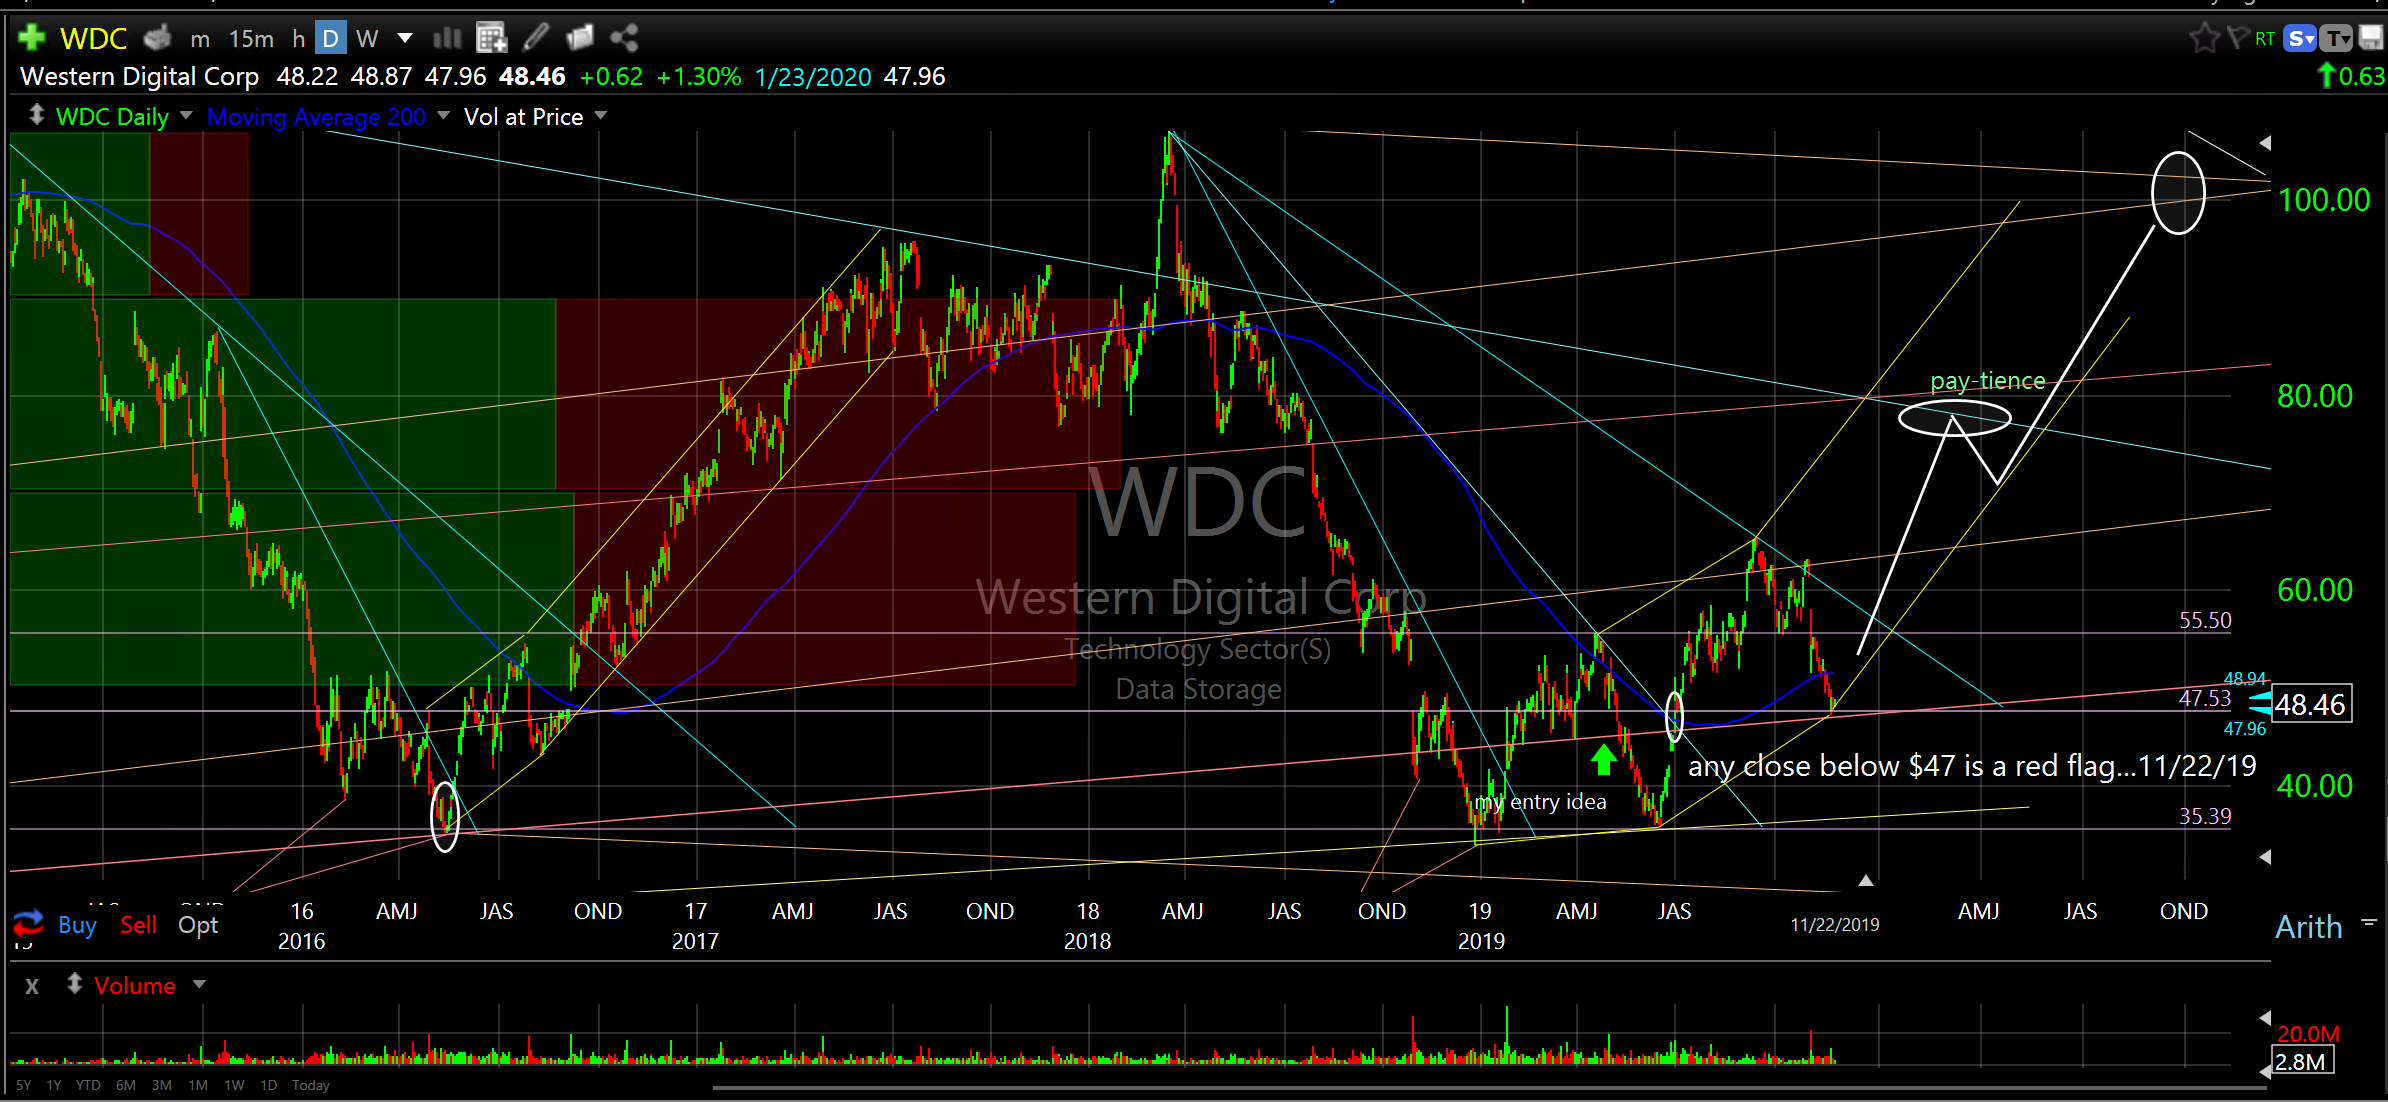
STML
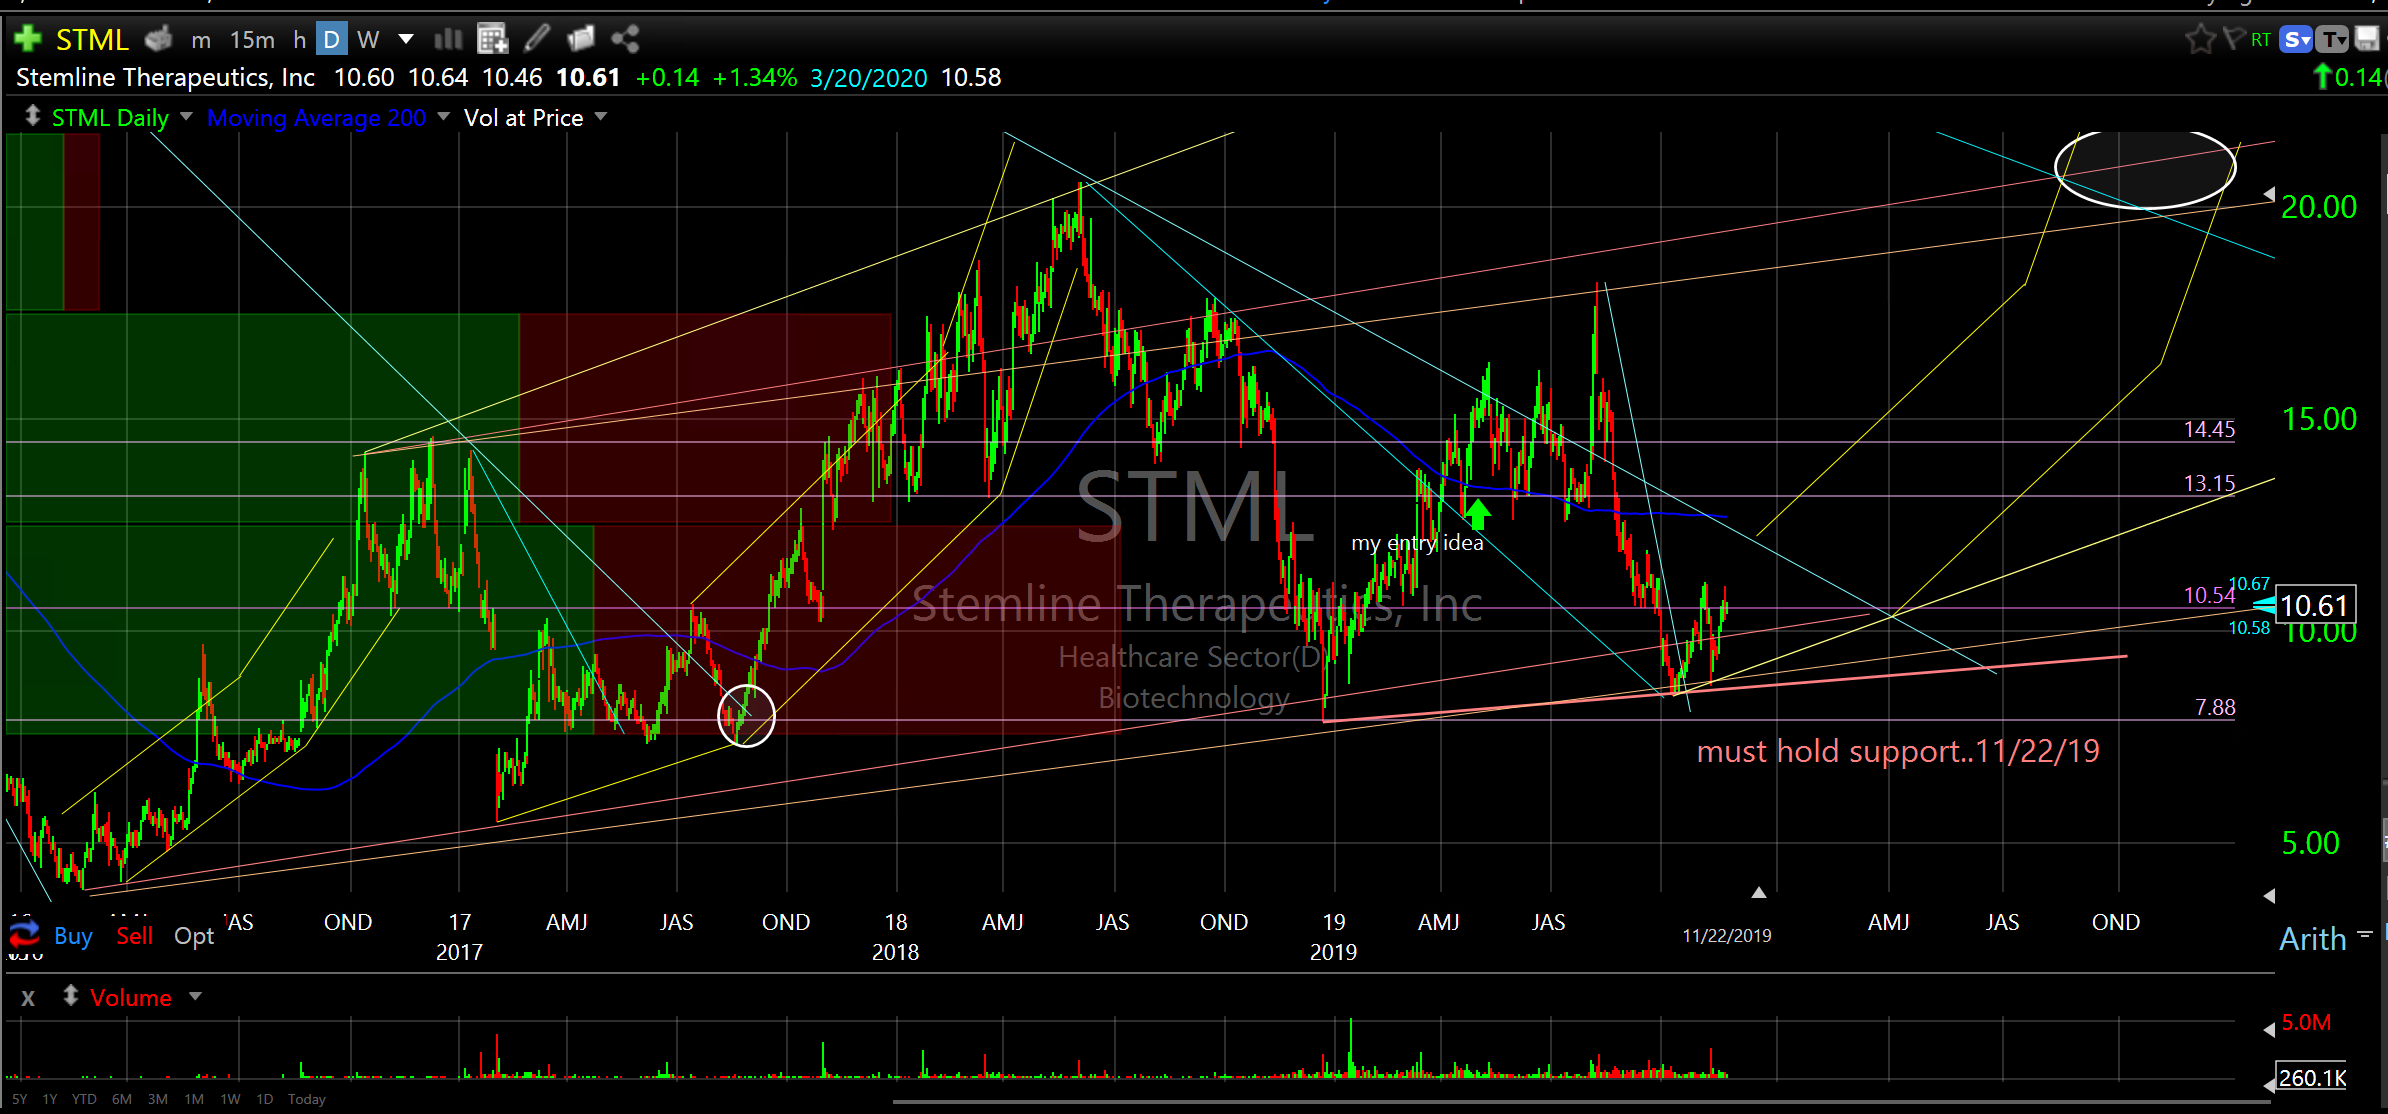
AAL
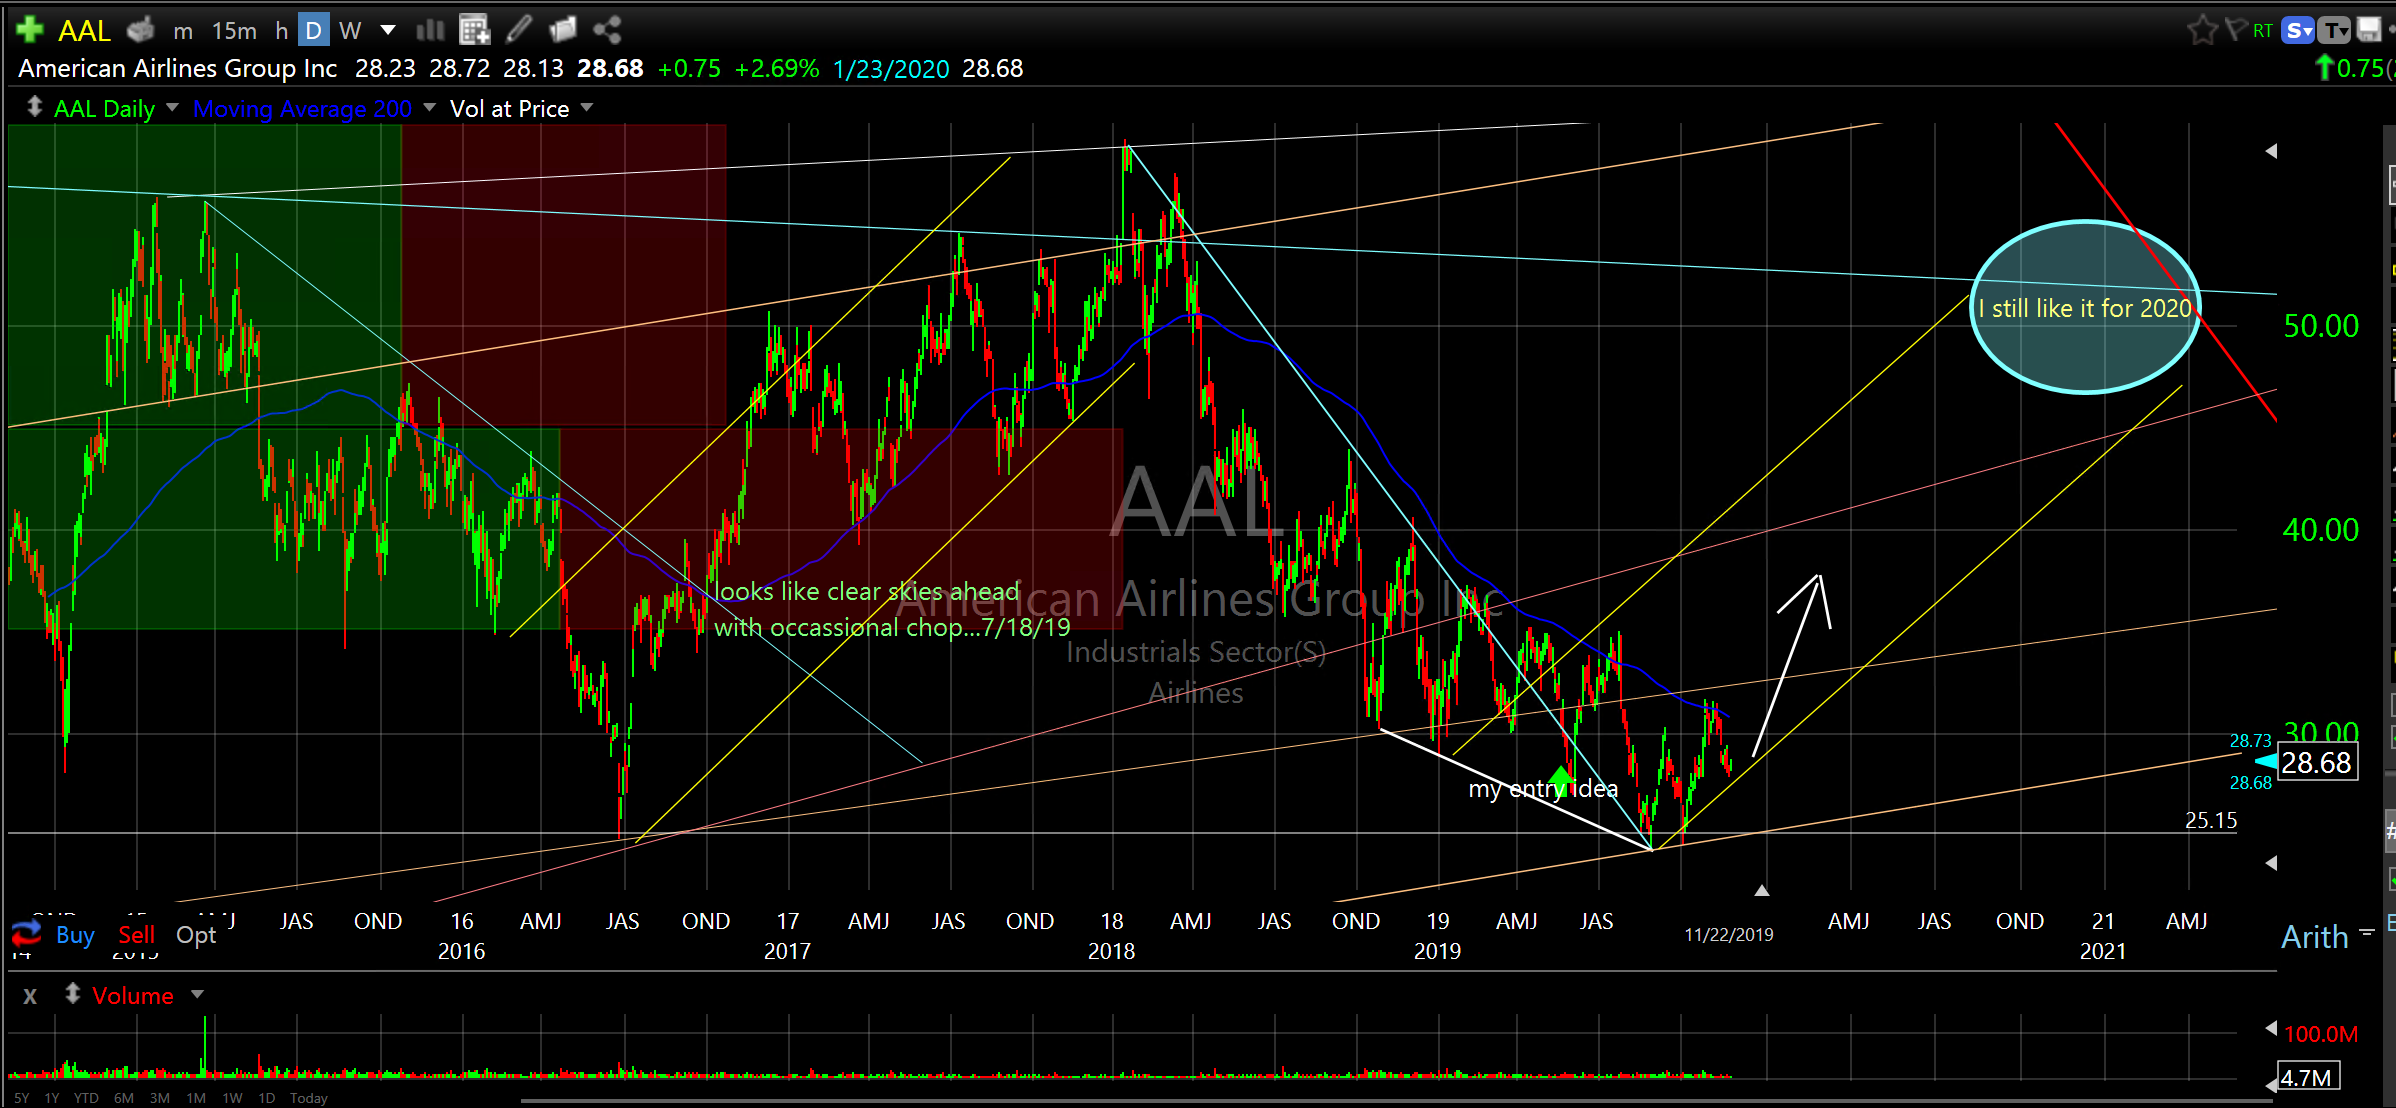
WYNN

Profit Taking Ideas (Exits/Partial Exits)
GRC
..this chart is amazing…another teepee forming..hahaha

BREW
..proposed buyout by BUD

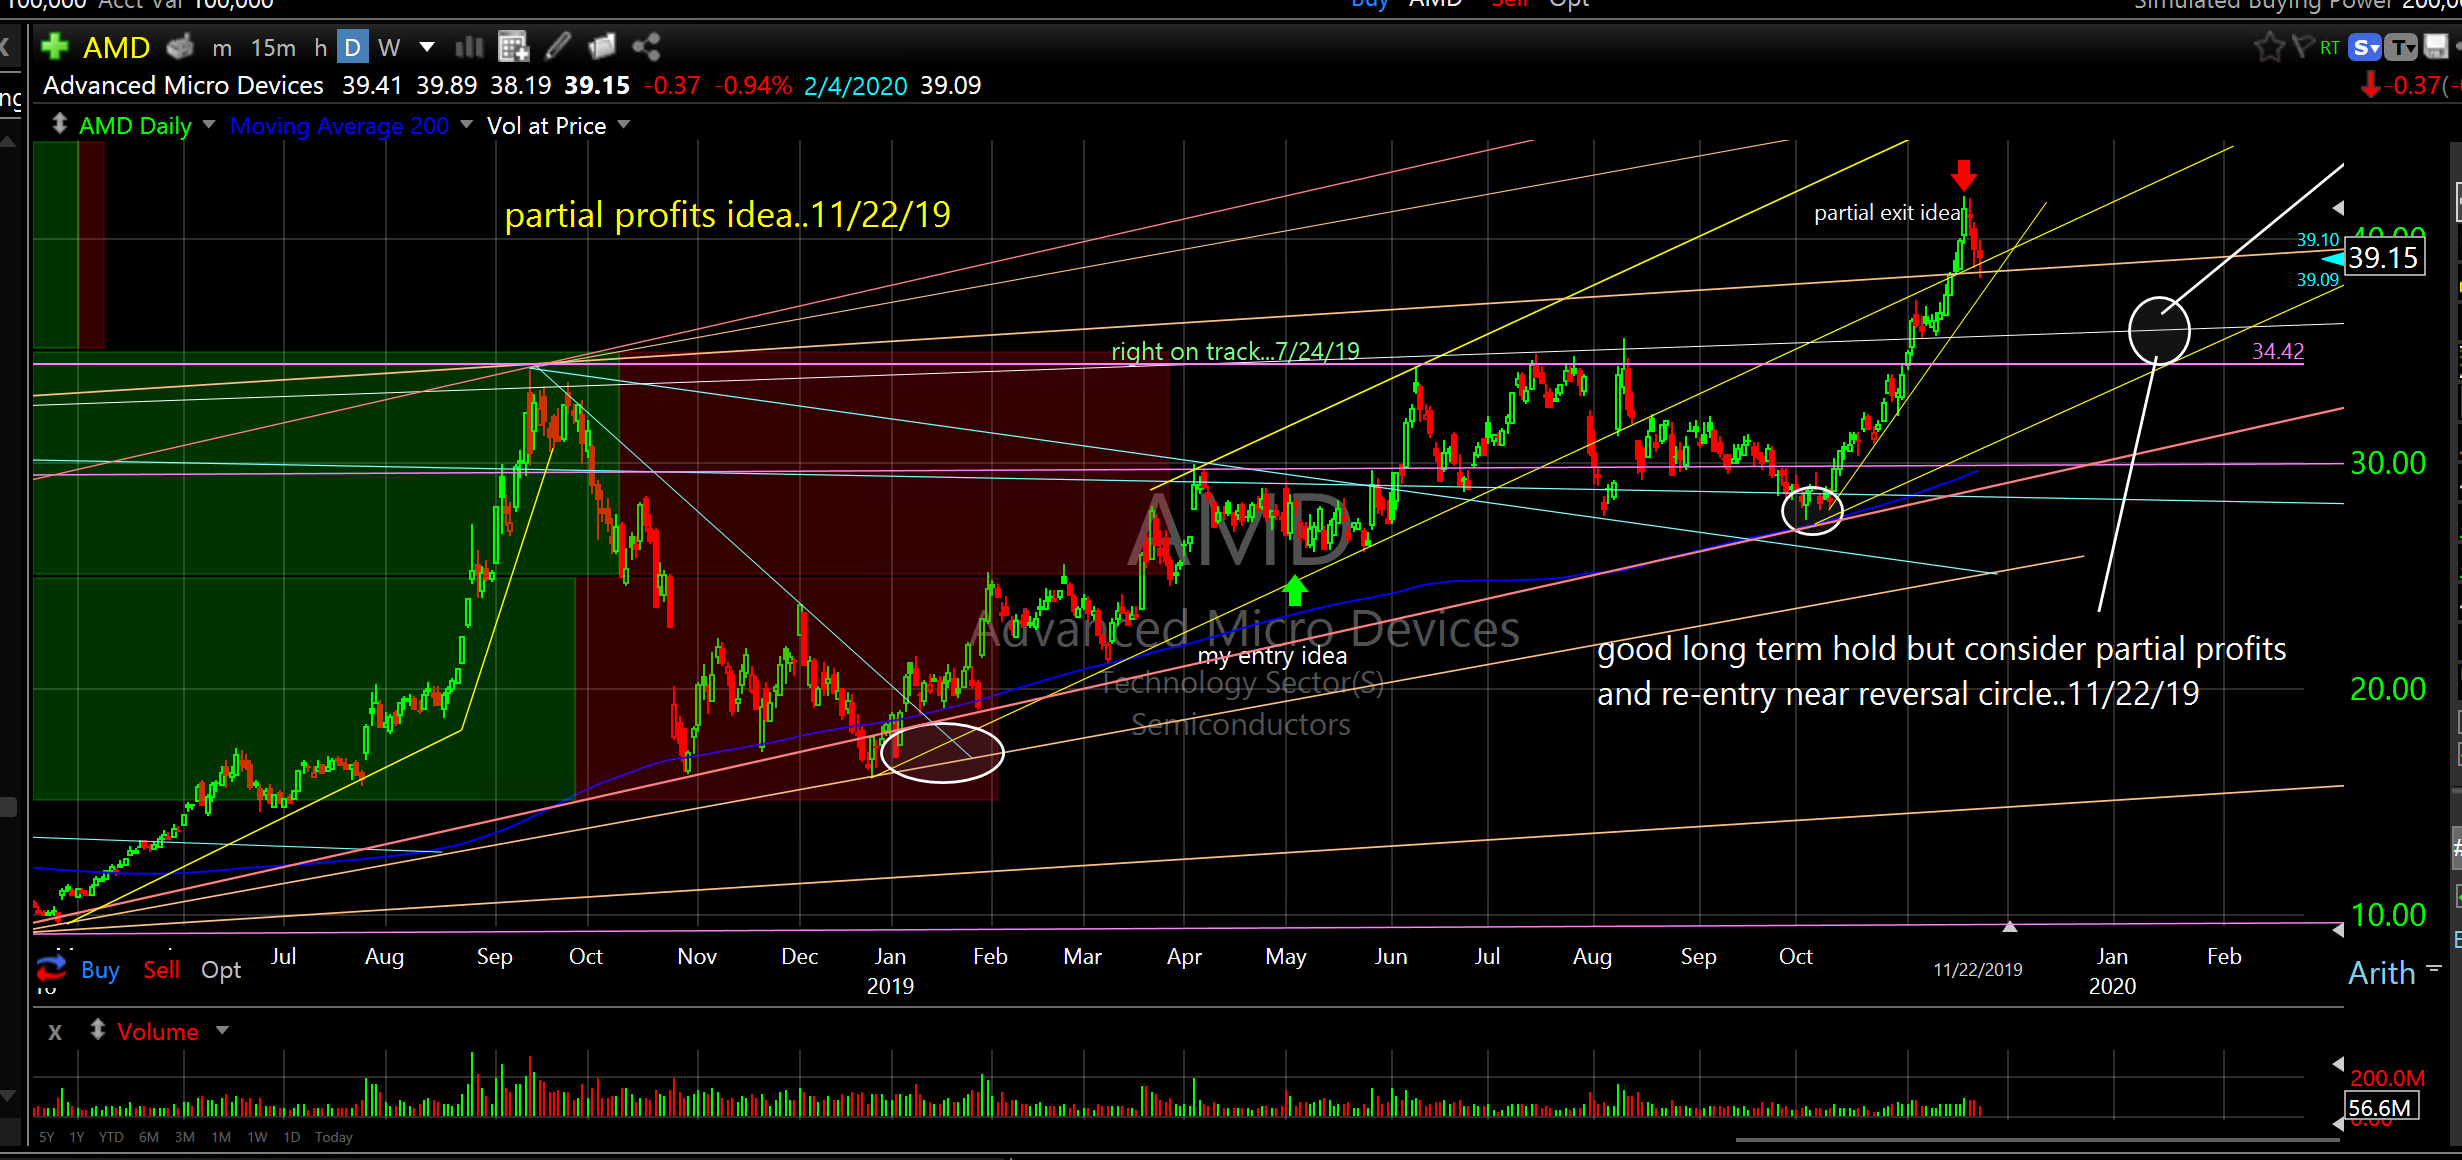
AMD
..another beauty
As we move into the end of 2019 I just want to take a moment and thank you for reading my work. About ten years ago I set out to expose people to the many benefits of charting. While the majority of investors (professionals included) either don’t care or don’t understand I couldn’t be more pleased. In fact, my world has been forever altered.
The many years of research which led me to writing has, in turn, led me to a world beyond my wildest dreams where I can see the market more clearly than I ever thought imaginable. I see reversals, expansions, collapses, consolidations, peaks, troughs, channels, angles, compression wedges, reflective characteristics, intermarket relationships, hard consistent price/time symmetry/correlations, cycle repetition and fractal patterns that allow what I will call probability forecasting or predictive modeling. Whatever it’s called, all I know is that without it I would be swimming in a sea of sharks, at night with absolutely nothing to hold on to and no idea which way to go…like most everyone else. No thank you.
As the market expands, as I expect, I will likely concentrate more on the broader market ETF’s and less on individual stocks. There are just so many that look good for 2020 I can’t possibly cover them all. I will, however, continue to cover companies that really catch my eye. Of course, if you have any favorites I will be happy to chart them for you. All you need to do is ask.
Two More Charts
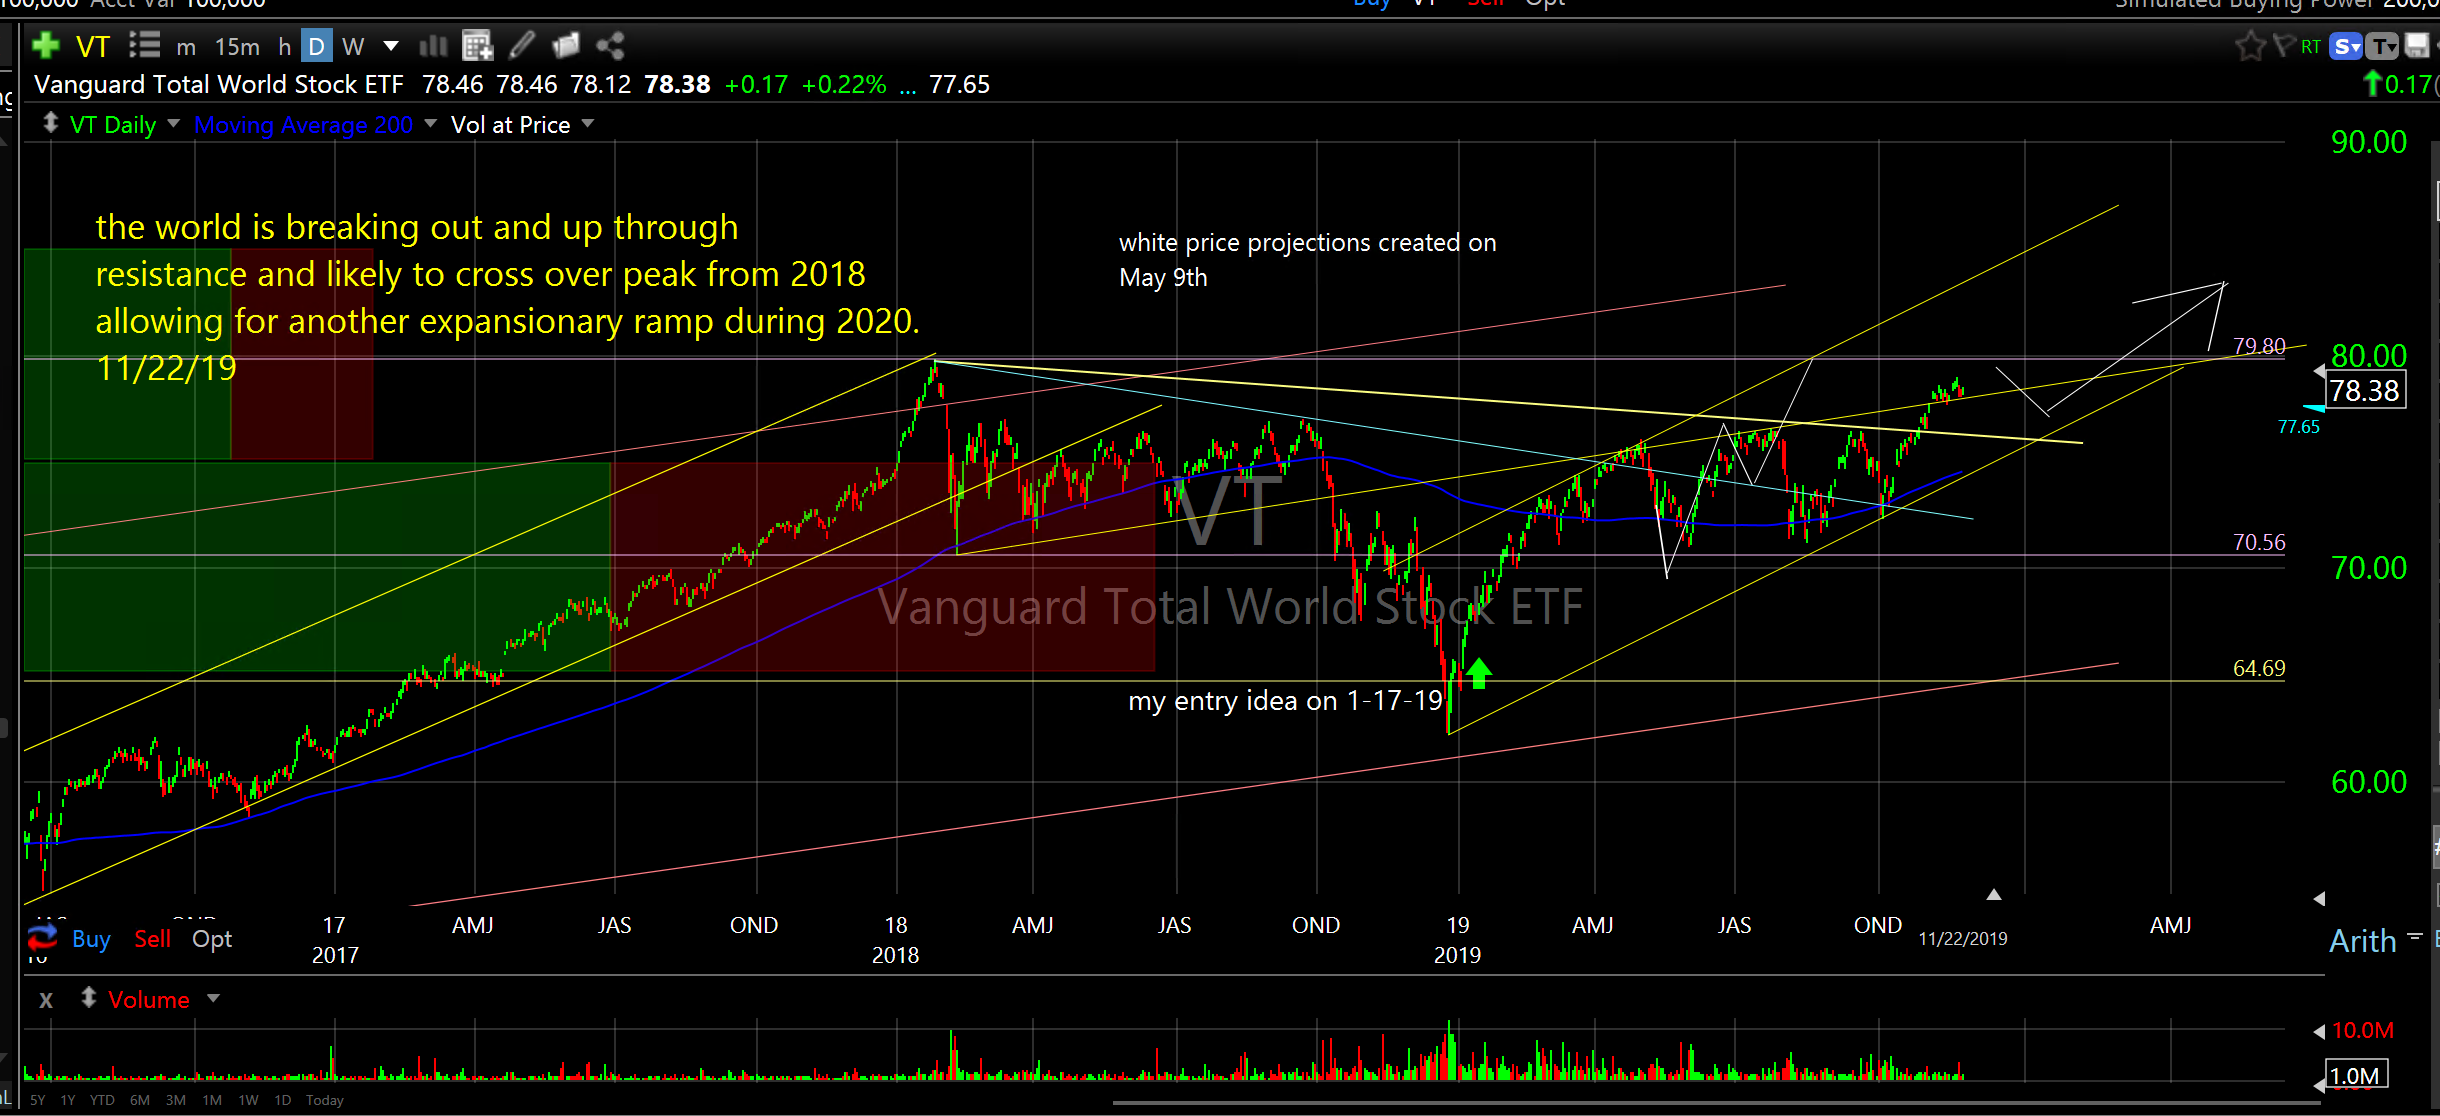
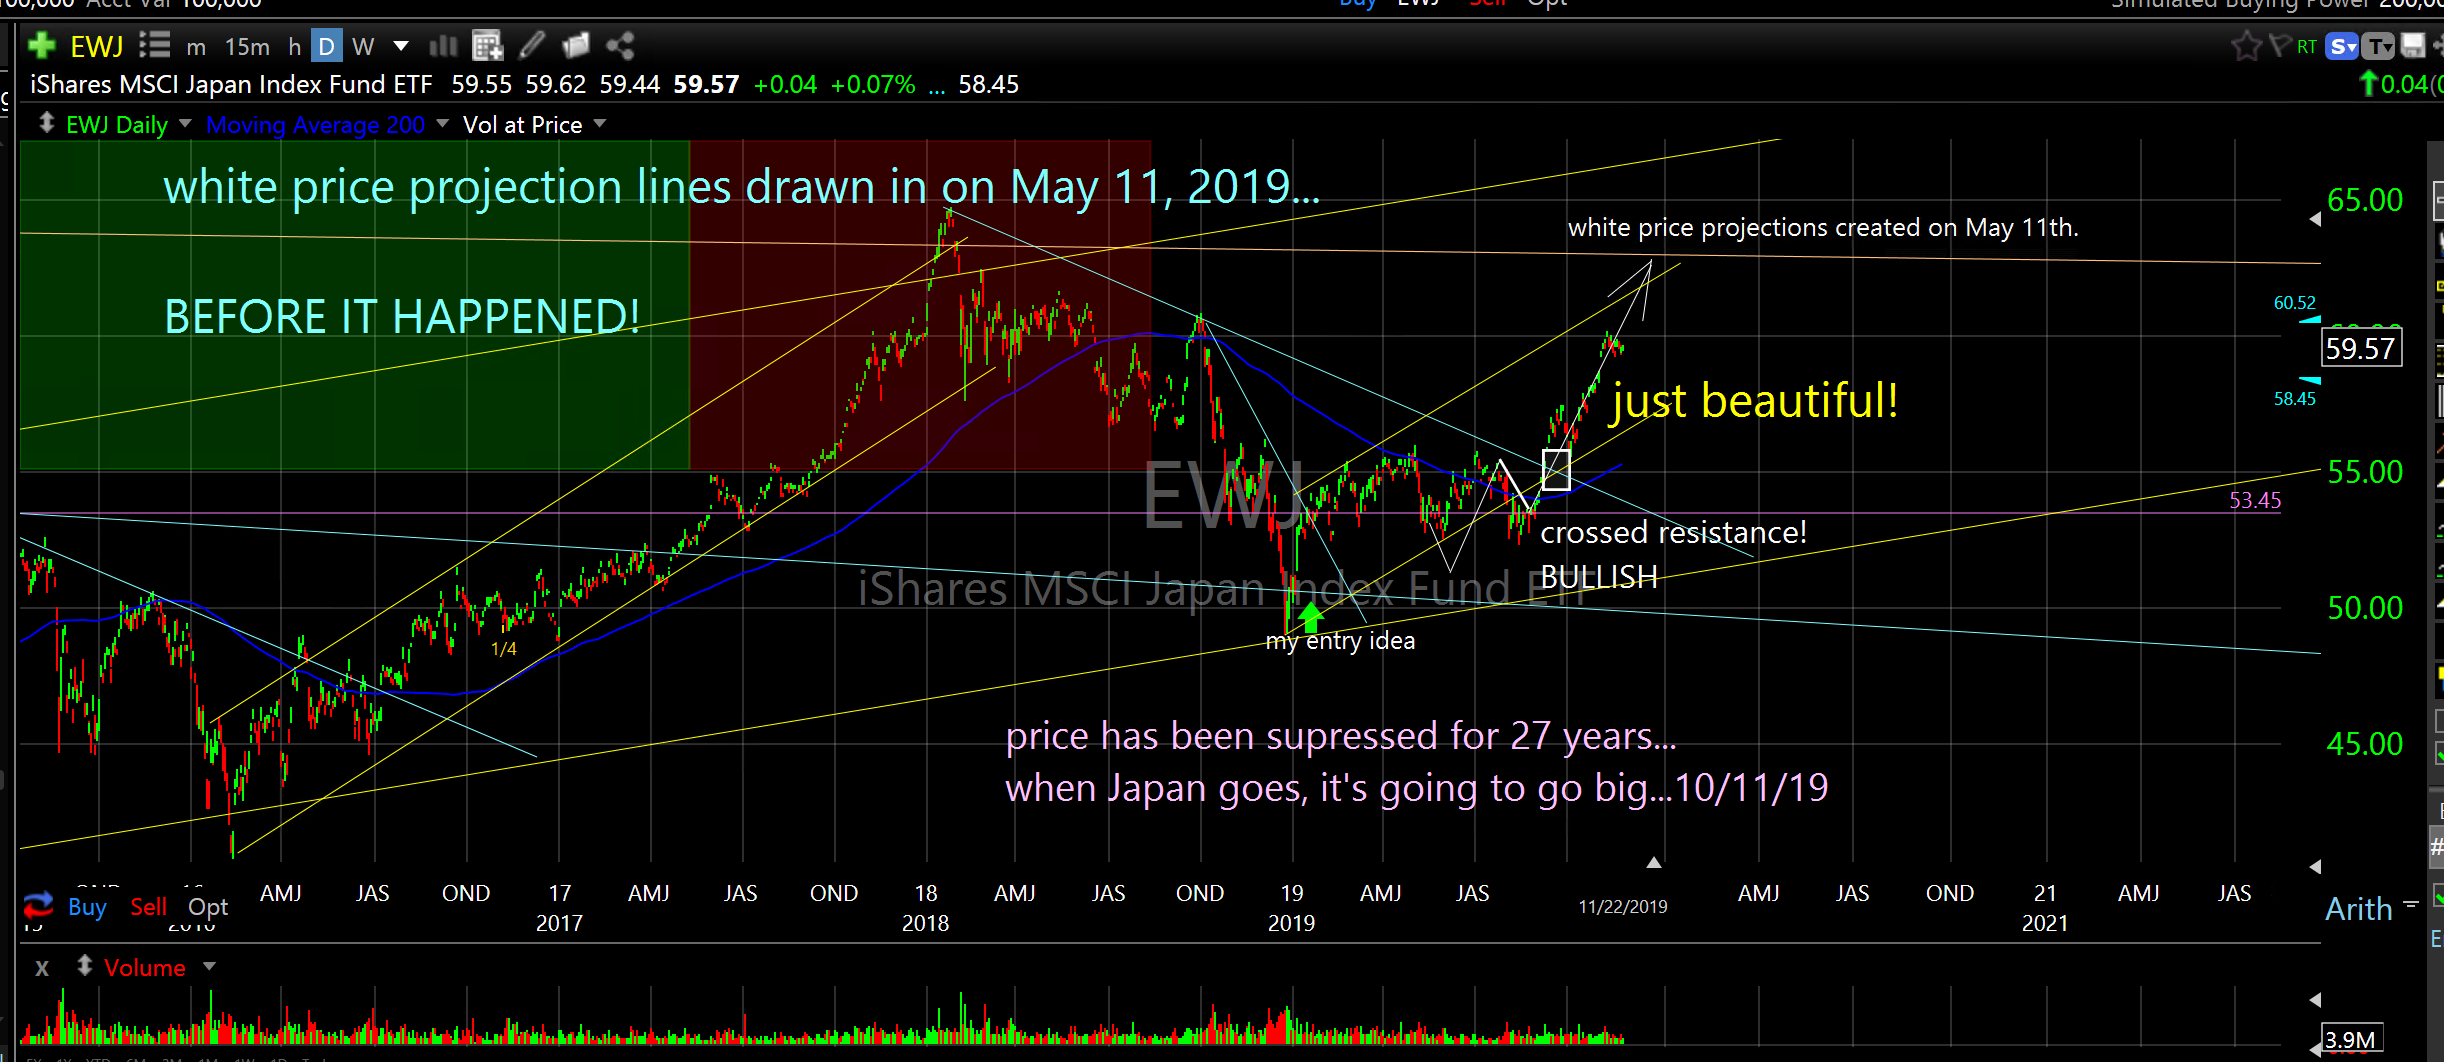
Did I mention the world is breaking out? Check out Vanguard’s Total World Stock ETF (VT). I highlighted this as an entry idea in January and it proceeded to ramp higher then after consolidating all summer it is now crossing over resistance and likely beginning another expansionary period which should continue well into 2020. I also highlighted the iShares MSCI Japan Index Fund ETF (EWJ) last January. Looks similar doesn’t it. It has followed my price projections perfectly and should rocket higher in 2020 after almost thirty years of price suppression.
VT
EWJ
One Final Awesome Looking Chart
Take a look at this one. Allow your eyes to see the repeating cycle nuances. Is that beautiful or what!
GRVY

Going into Thanksgiving I am feeling grateful and thankful.
I am grateful for the passion I have for my work and I am thankful you spend the time to read my blabbering and “see” my charting. I hope it is helpful to you.
Happy Thanksgiving,
Don
PS. As usual this will be posted on my website in a day or two for easier reading and archiving. Please do your own due diligence. This is not individual investment advice.