Happy Summer!
The expansion I have been writing about for many months appears to have begun. The broader market (SPY) just made a new daily closing high (weekly close was 3 cents lower than the all time weekly close from last September), breadth is good with all sectors participating, yields are low and likely headed a little lower with Fed stimulus, the $US is just under resistance and is likely to reverse lower and the expansion is from a long and deep (18 months) foundation of consolidation; volatile consolidation but still consolidation. I believe the technical term for the part of the cycle we are likely on the verge of entering is Full Tilt Boogie Baby.
To be sure we would like to see The Dow, Nasdaq, Small Caps, and more Sectors and Sub Sectors make new highs but the fact that some are lagging is totally normal, in fact it’s consistent with previous expansions. So what’s not to like?
Not much really. I will note that stock market rallies are often accompanied by weaker bond prices but that is not what’s going on now with yields steadily falling and likely Fed pumping funny money in to the system, however, the correlation isn’t high enough to be worried about. The bond market is probably signaling weaker growth but the equity market is signaling “bring it on baby”. The only other thing that really concerns me is my receding hair line and lack of follicle participation.
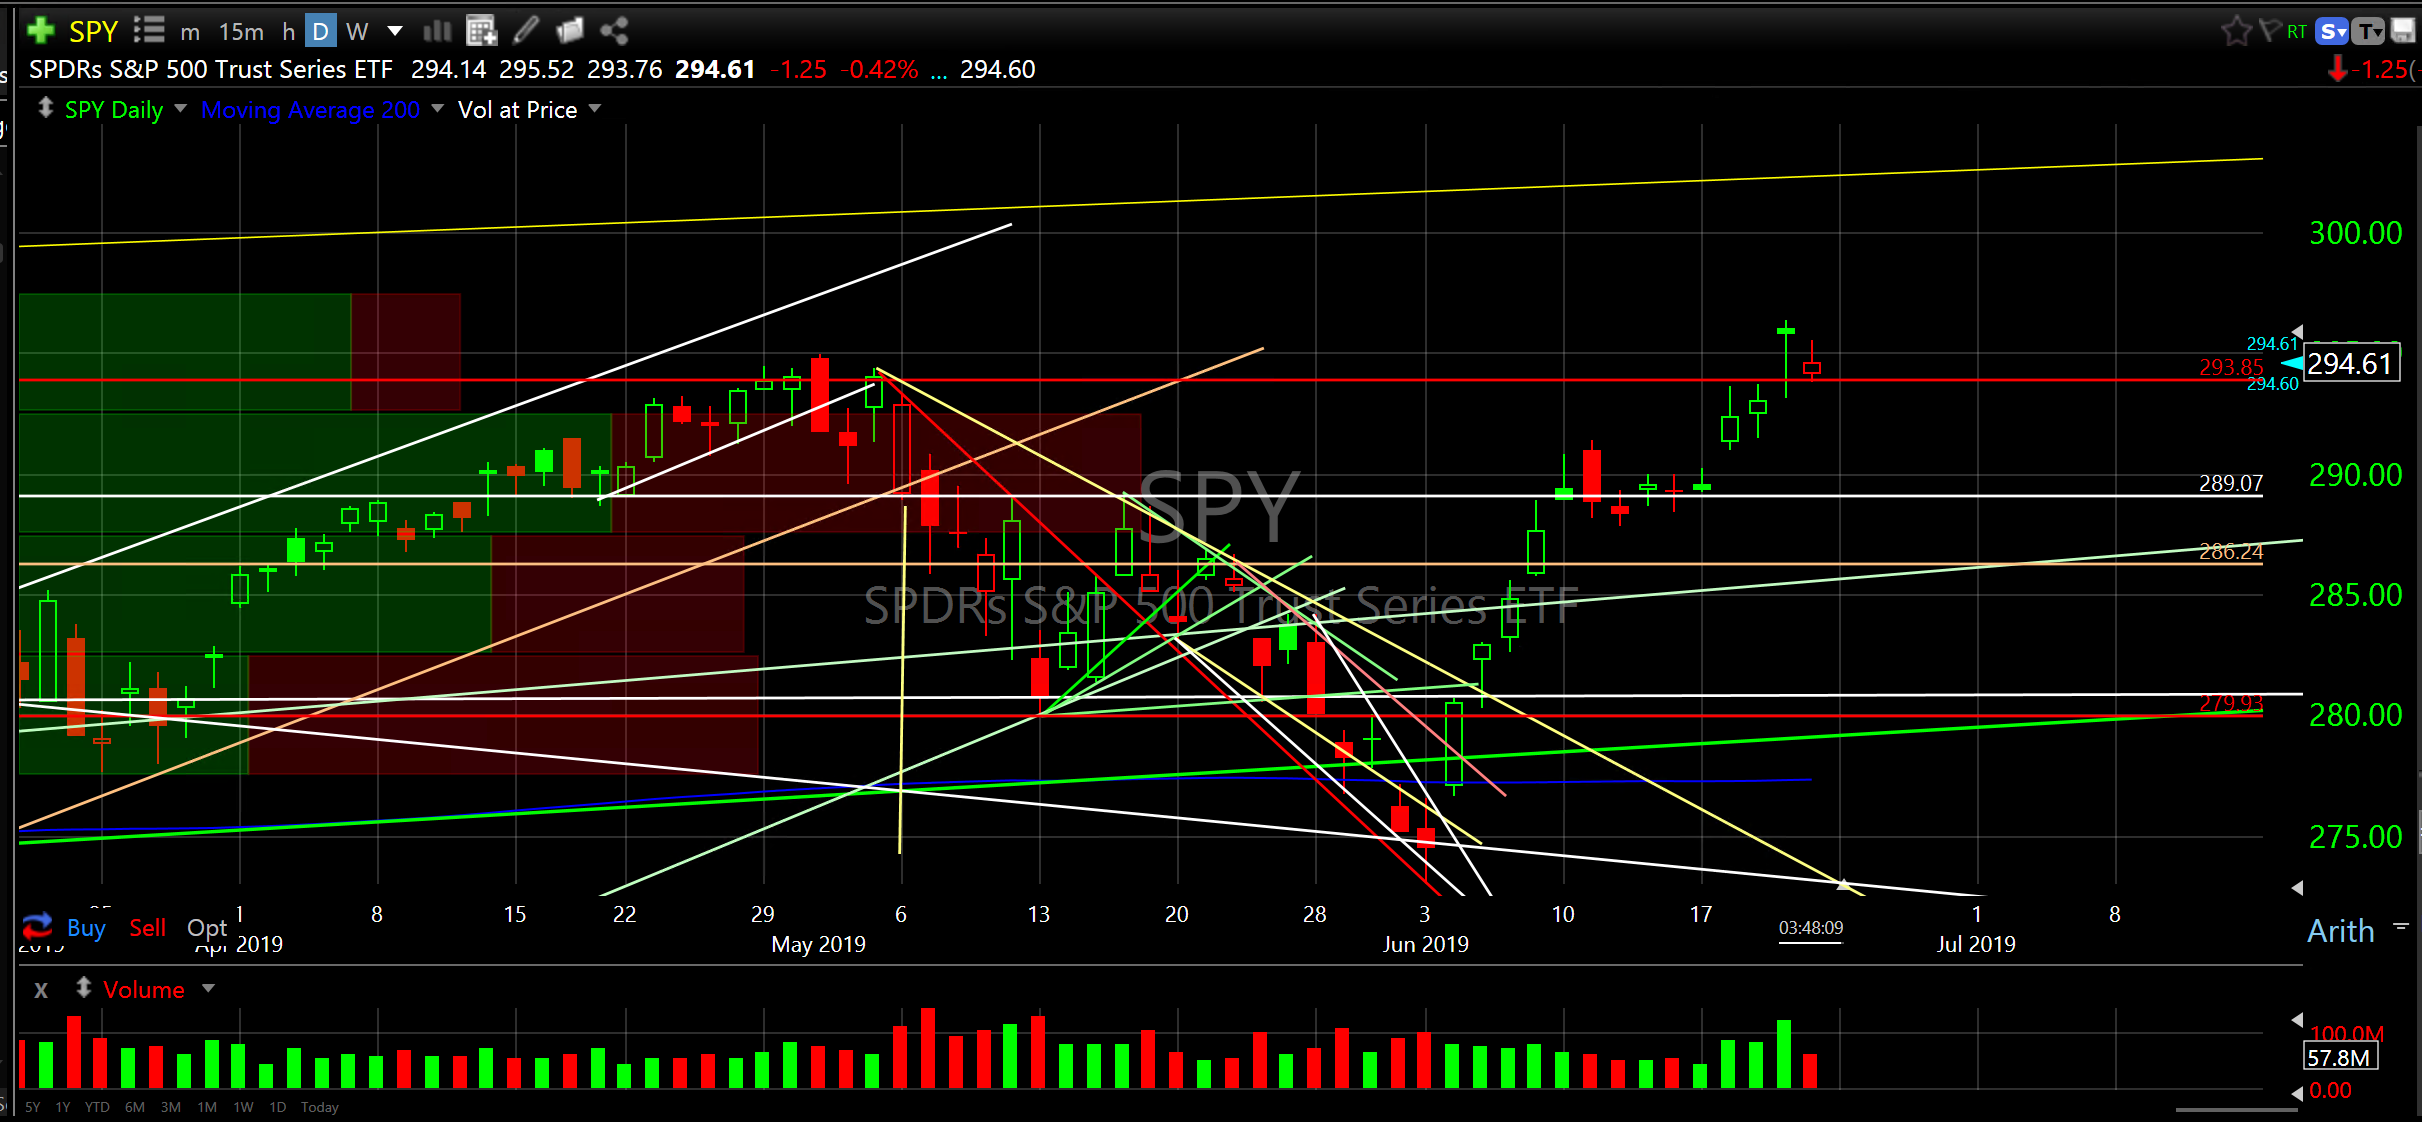
So, party on my friends. My expectation is that SPY will seek the highest ascending yellow line shown on the daily SPY chart below. As summer is seasonably weak I wouldn’t be surprised to see price chop around SPY 295/310 until Octoberish when we might get another dip then start ripping again into the end of the year. Remember, these are my opinions only based on historical evidence. Although I have been highly accurate with my price expectations/projections (even surprising myself) please take my opinions addito salis grano (after having added a grain of salt) and accompany with full dose of risk management.
SPDR’s S&P 500 Trust Series ETF (SPY) daily
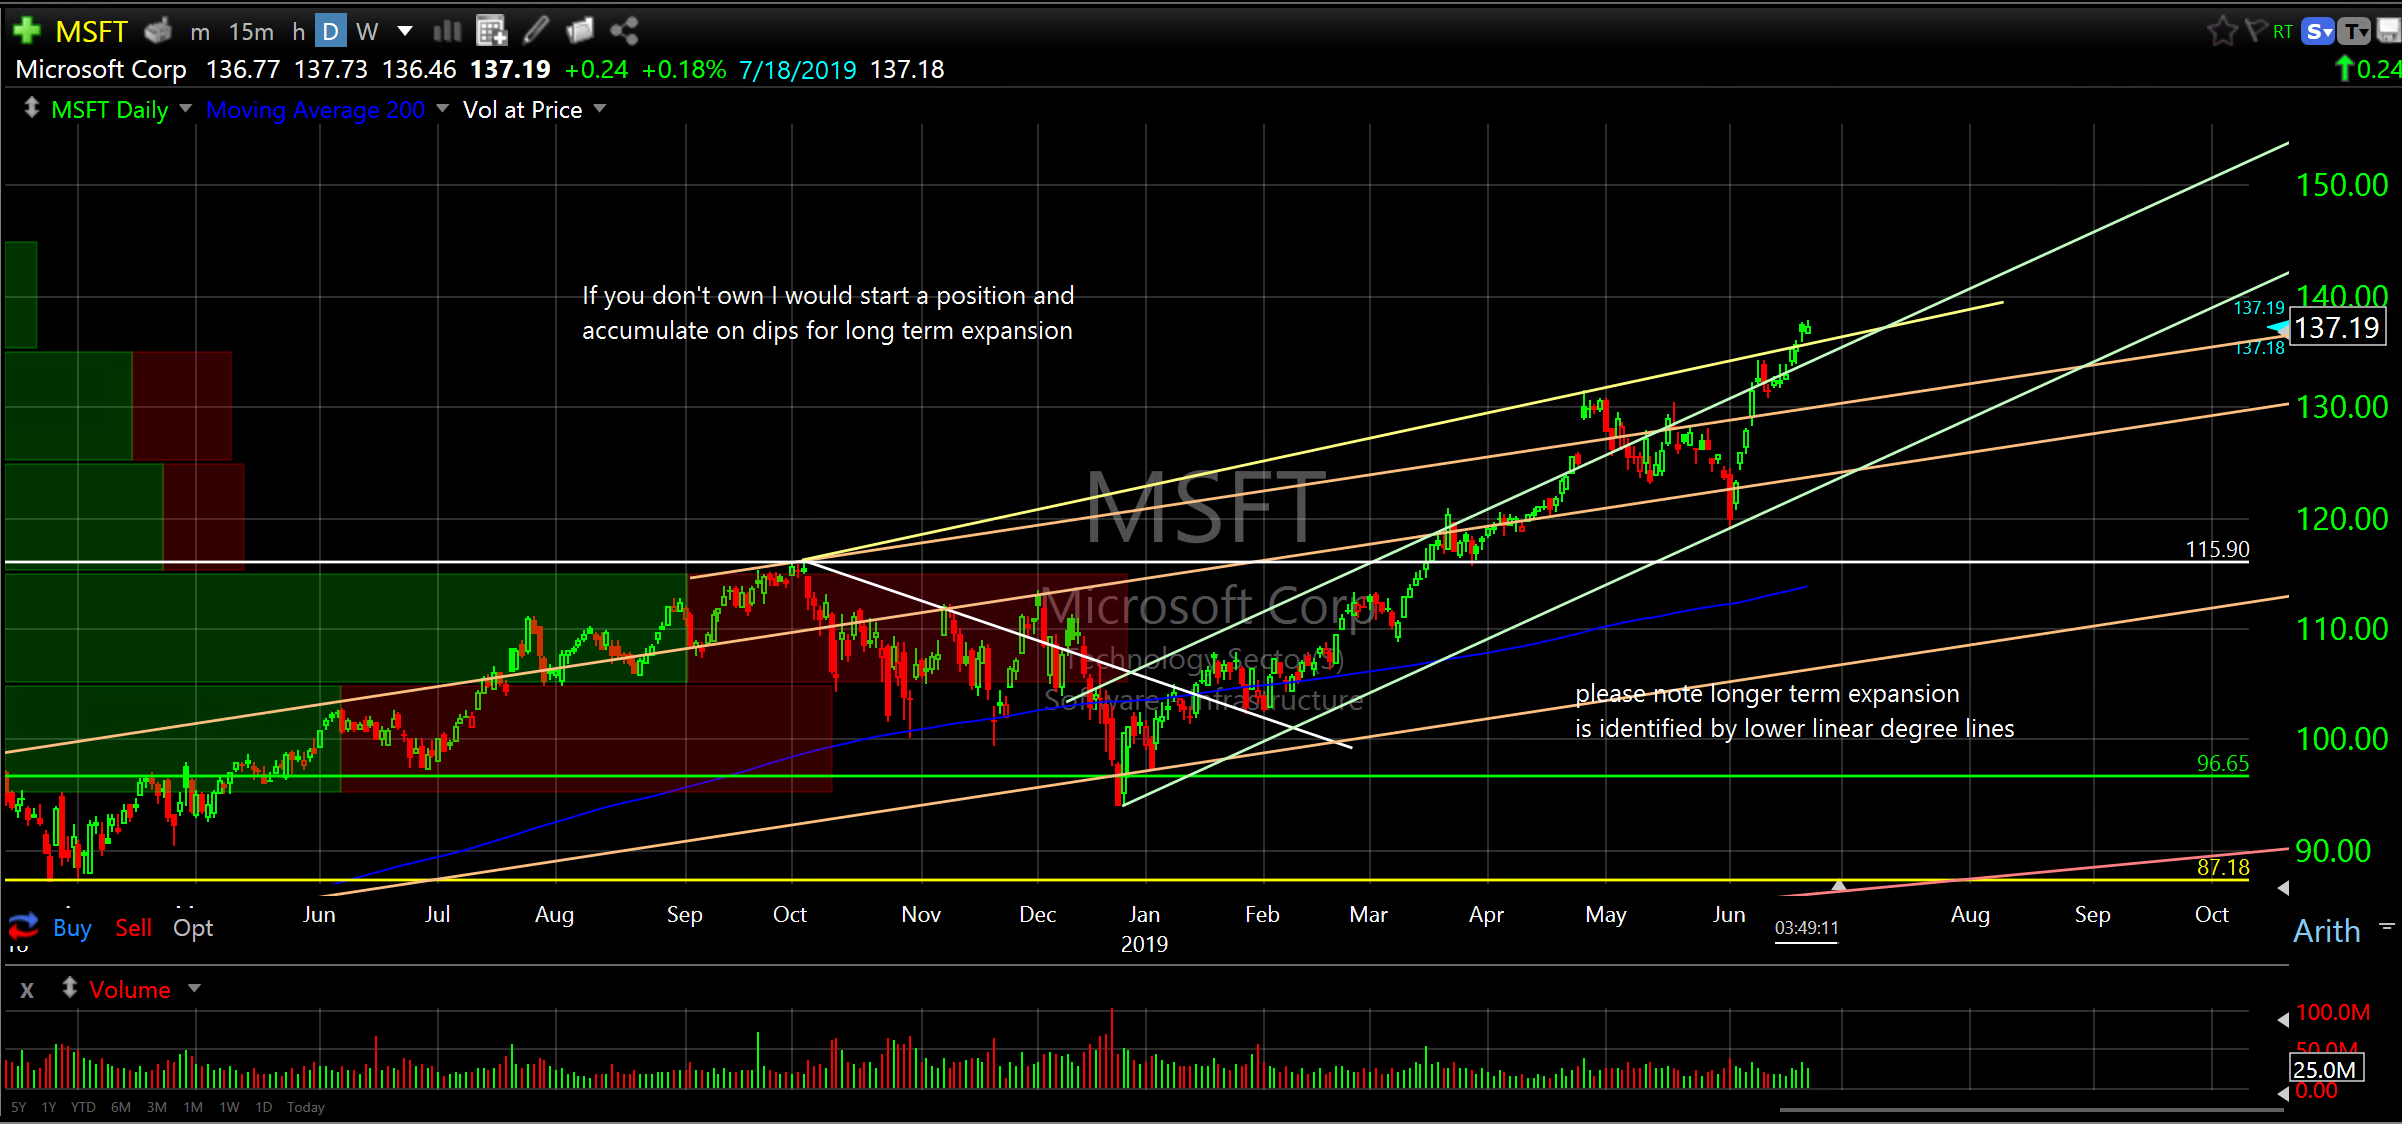
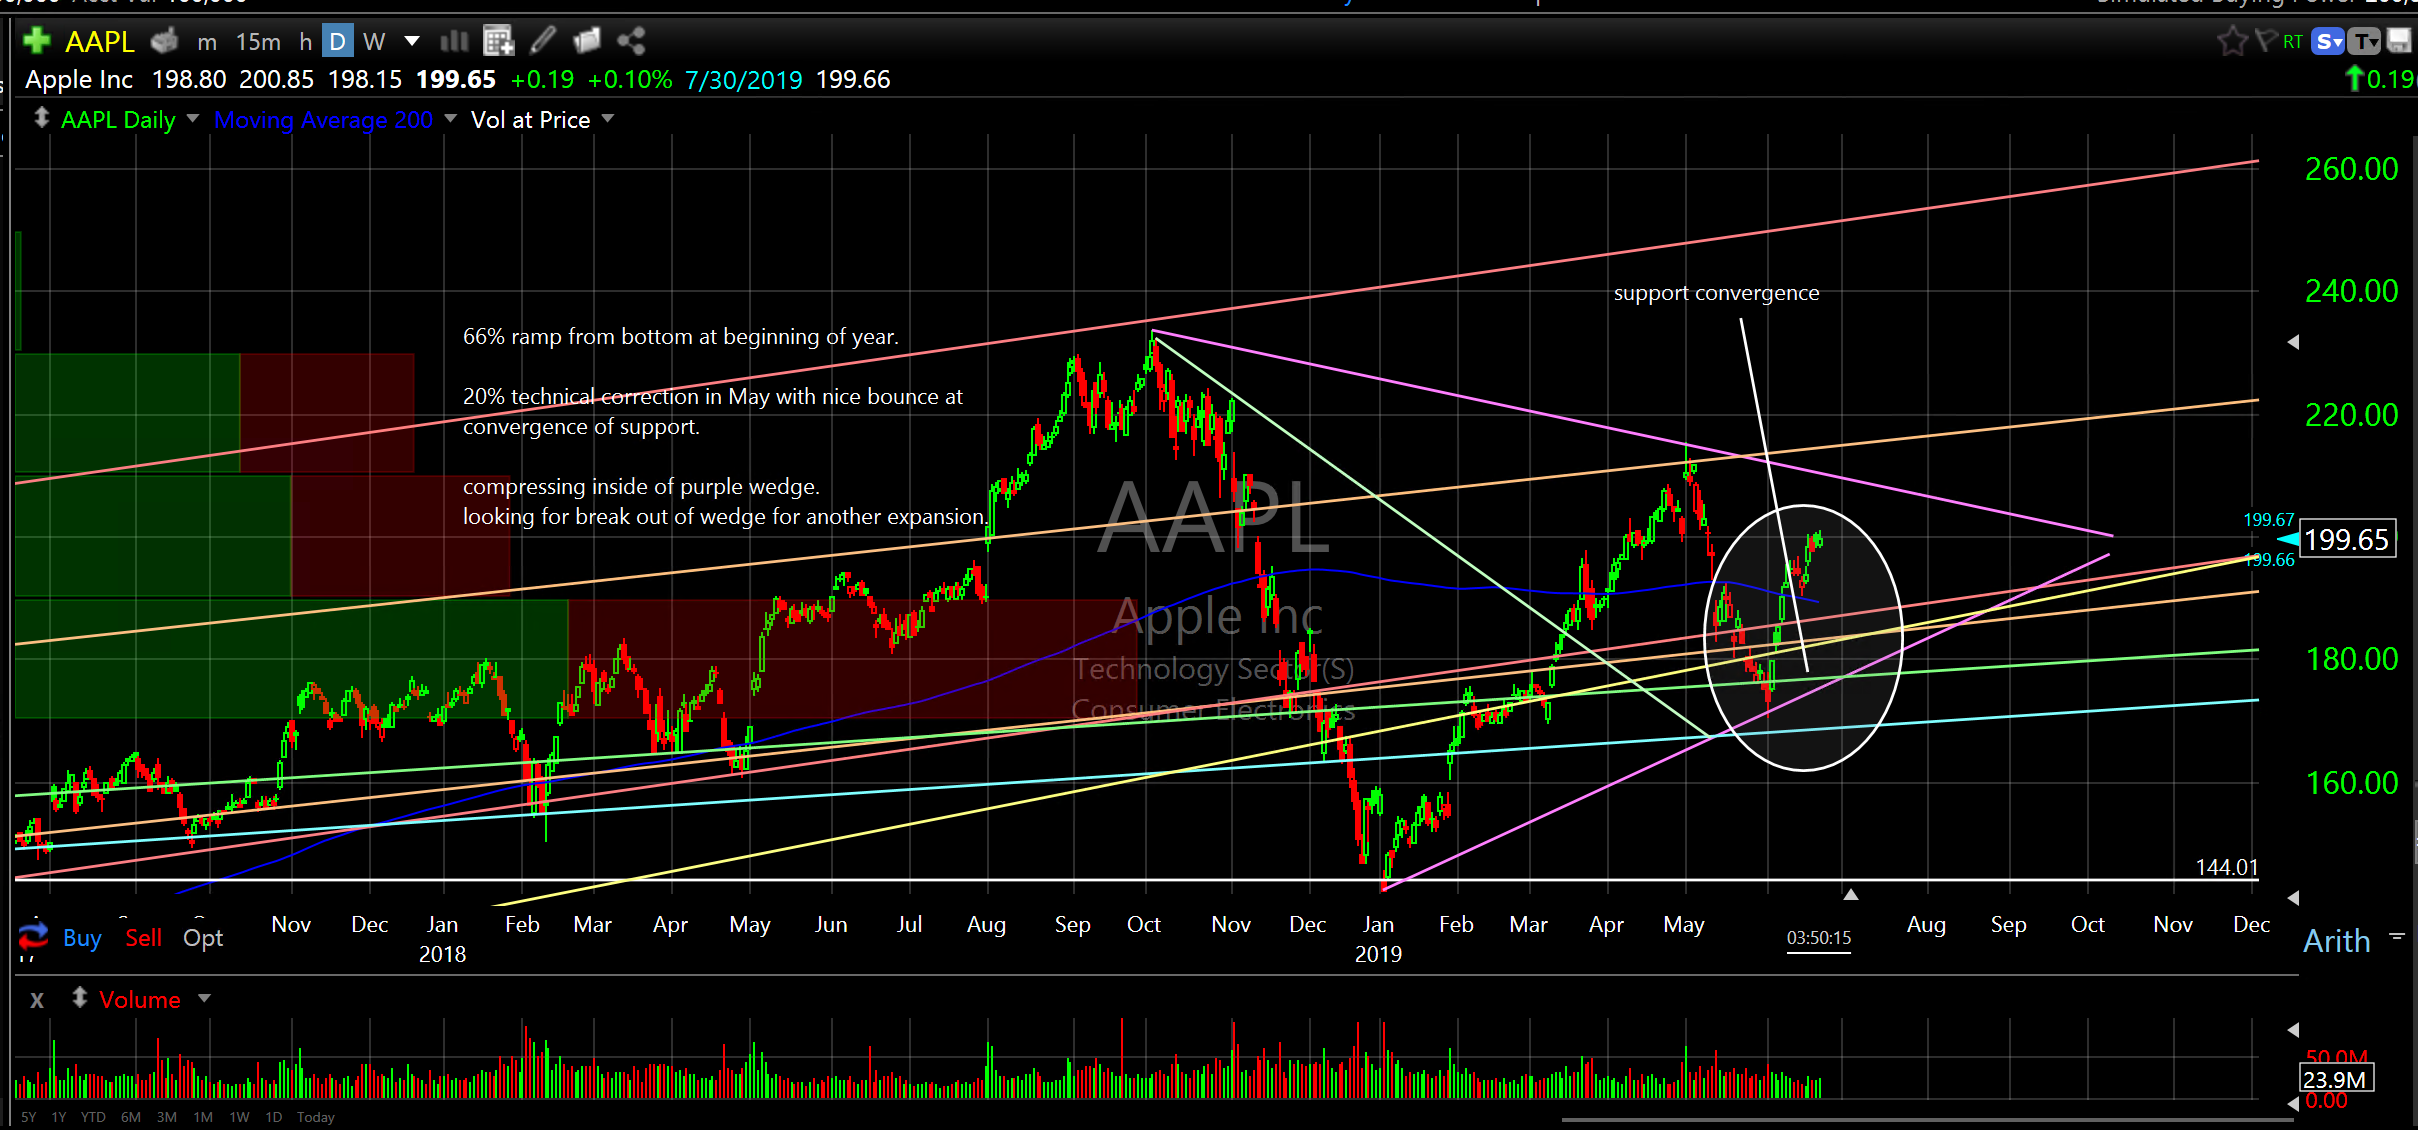
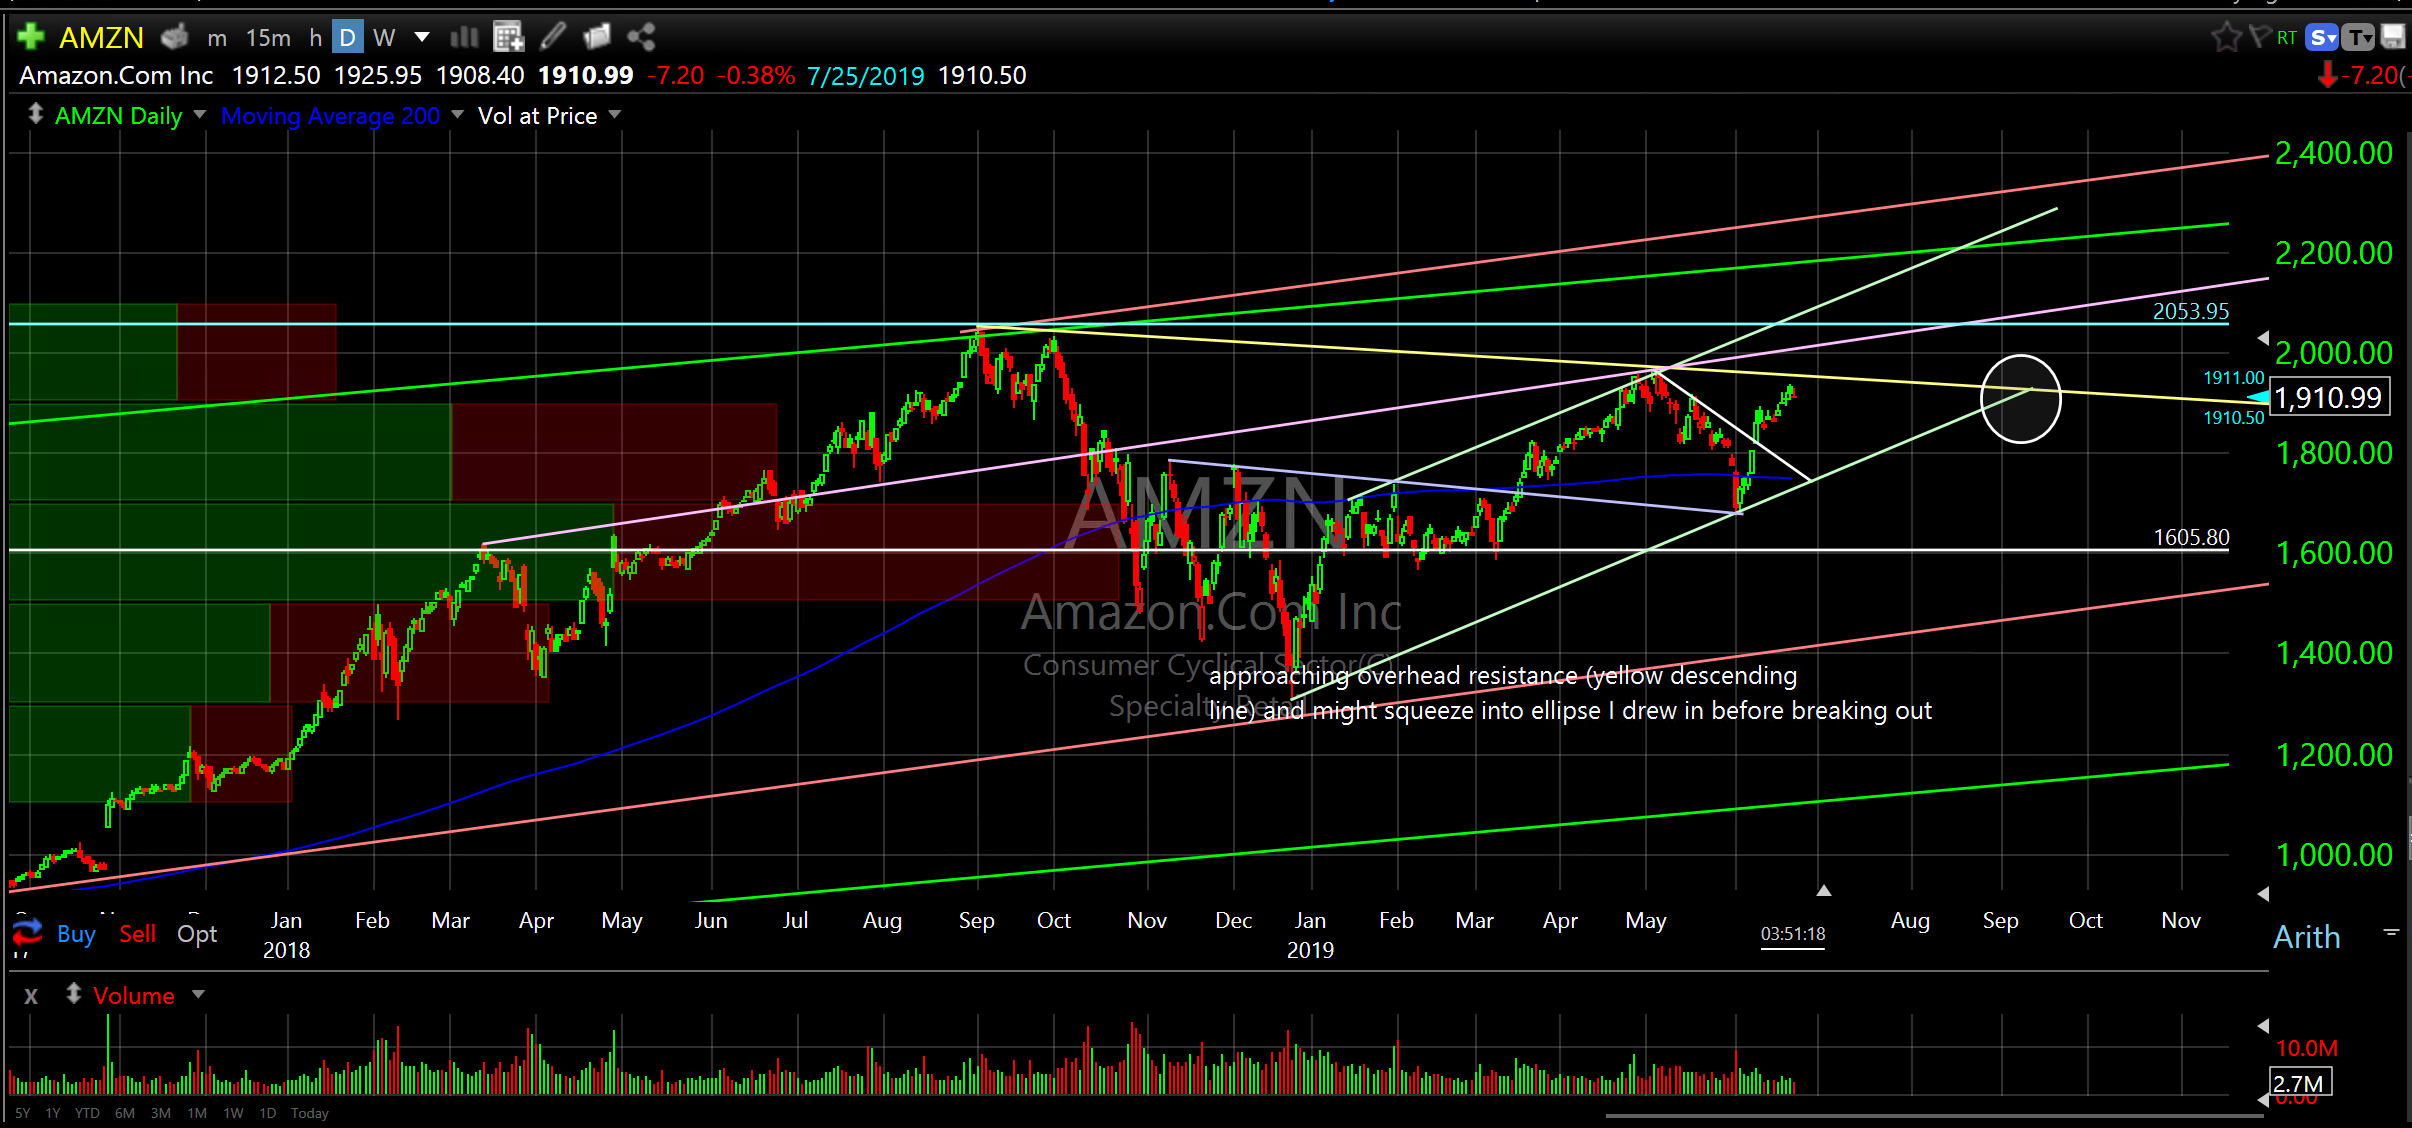
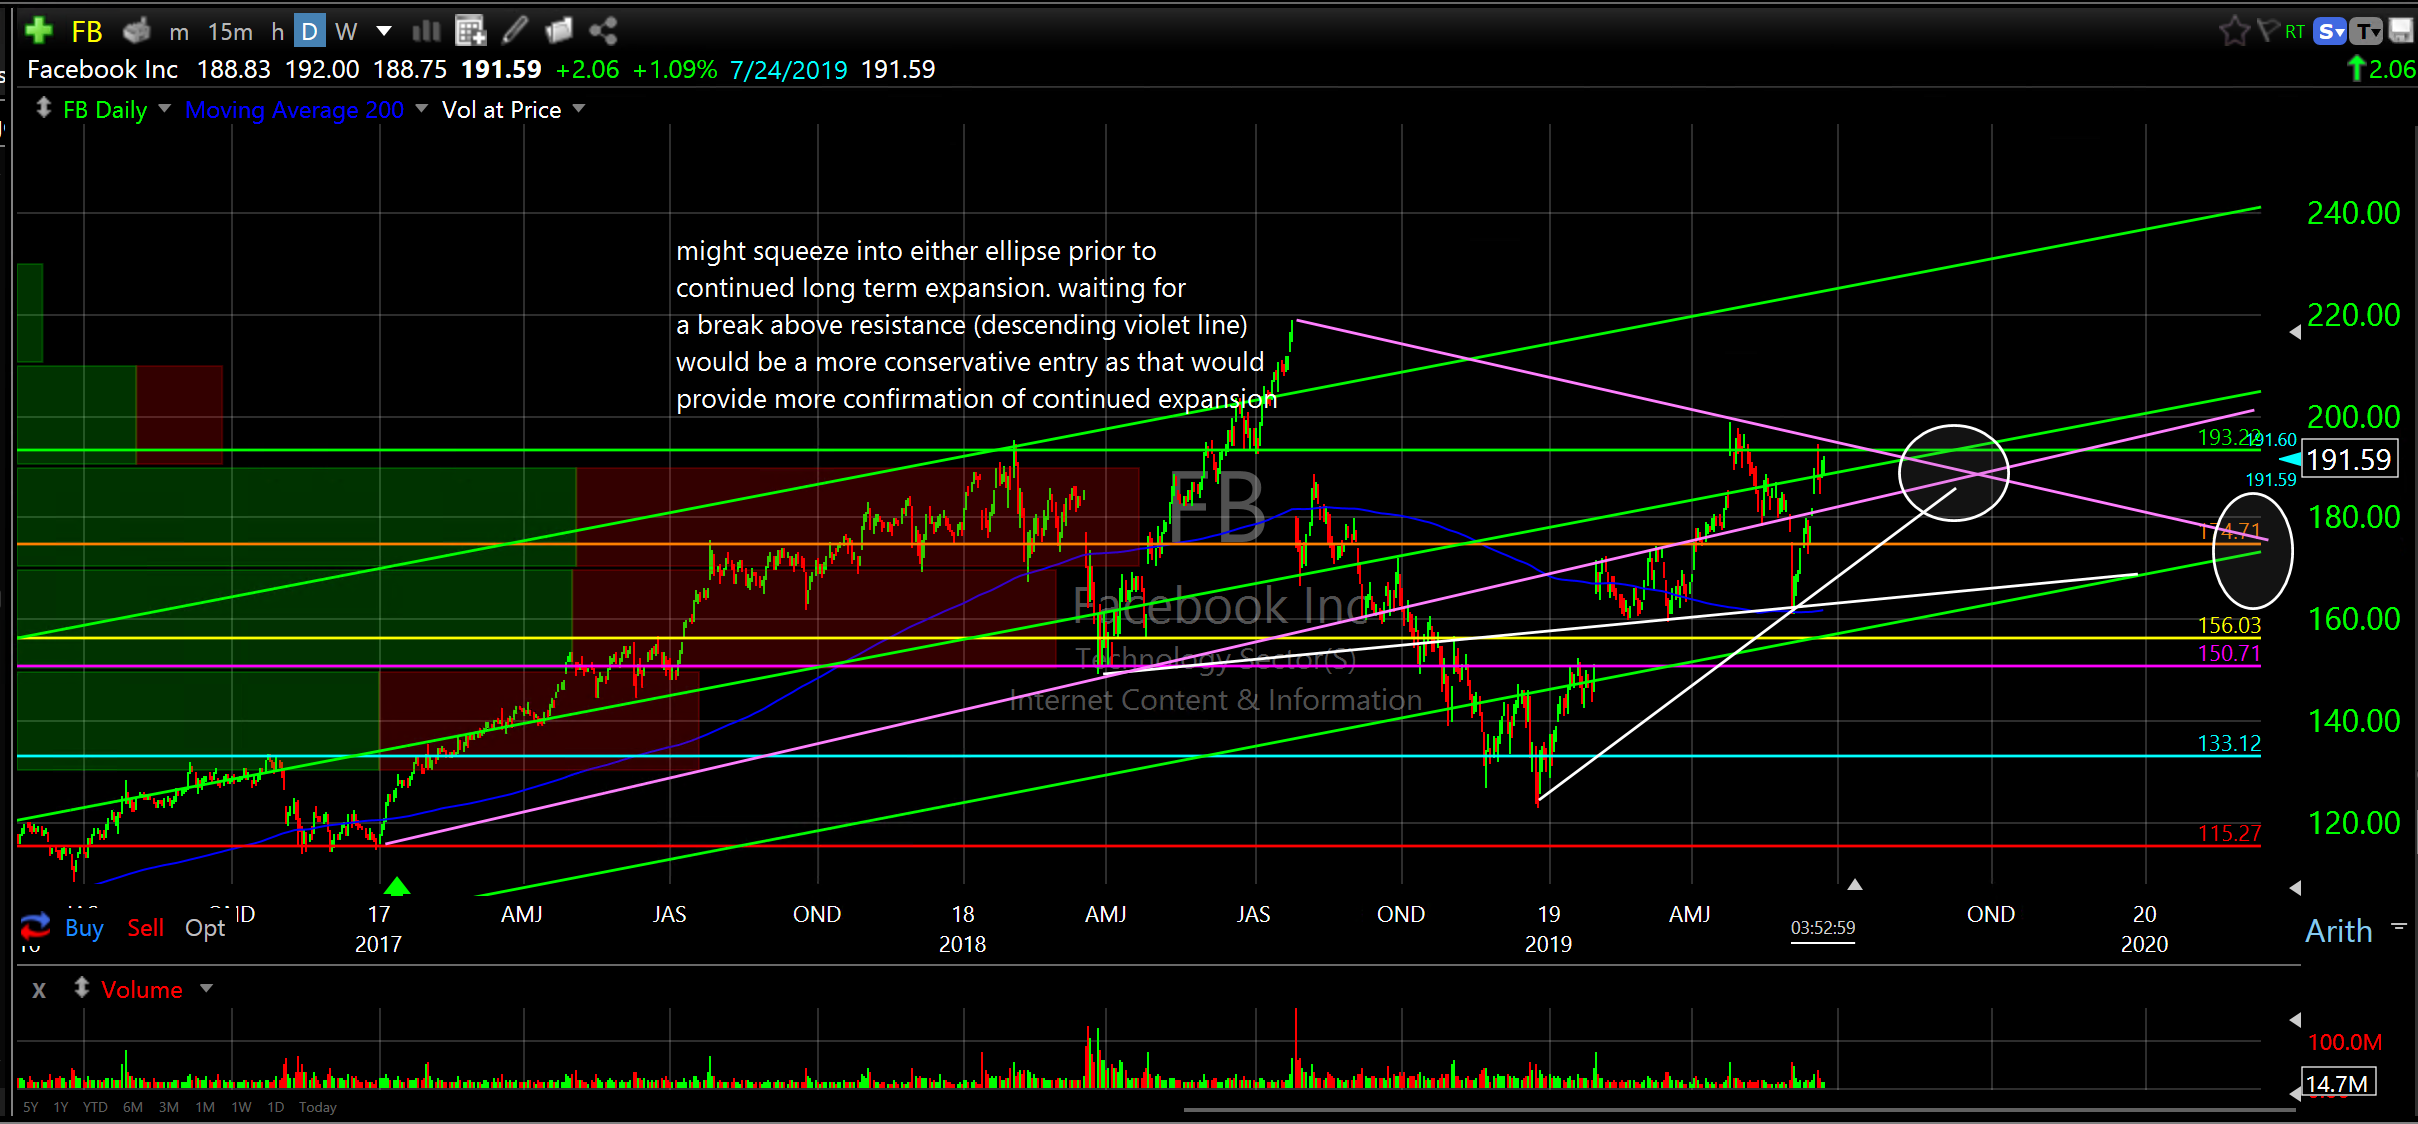
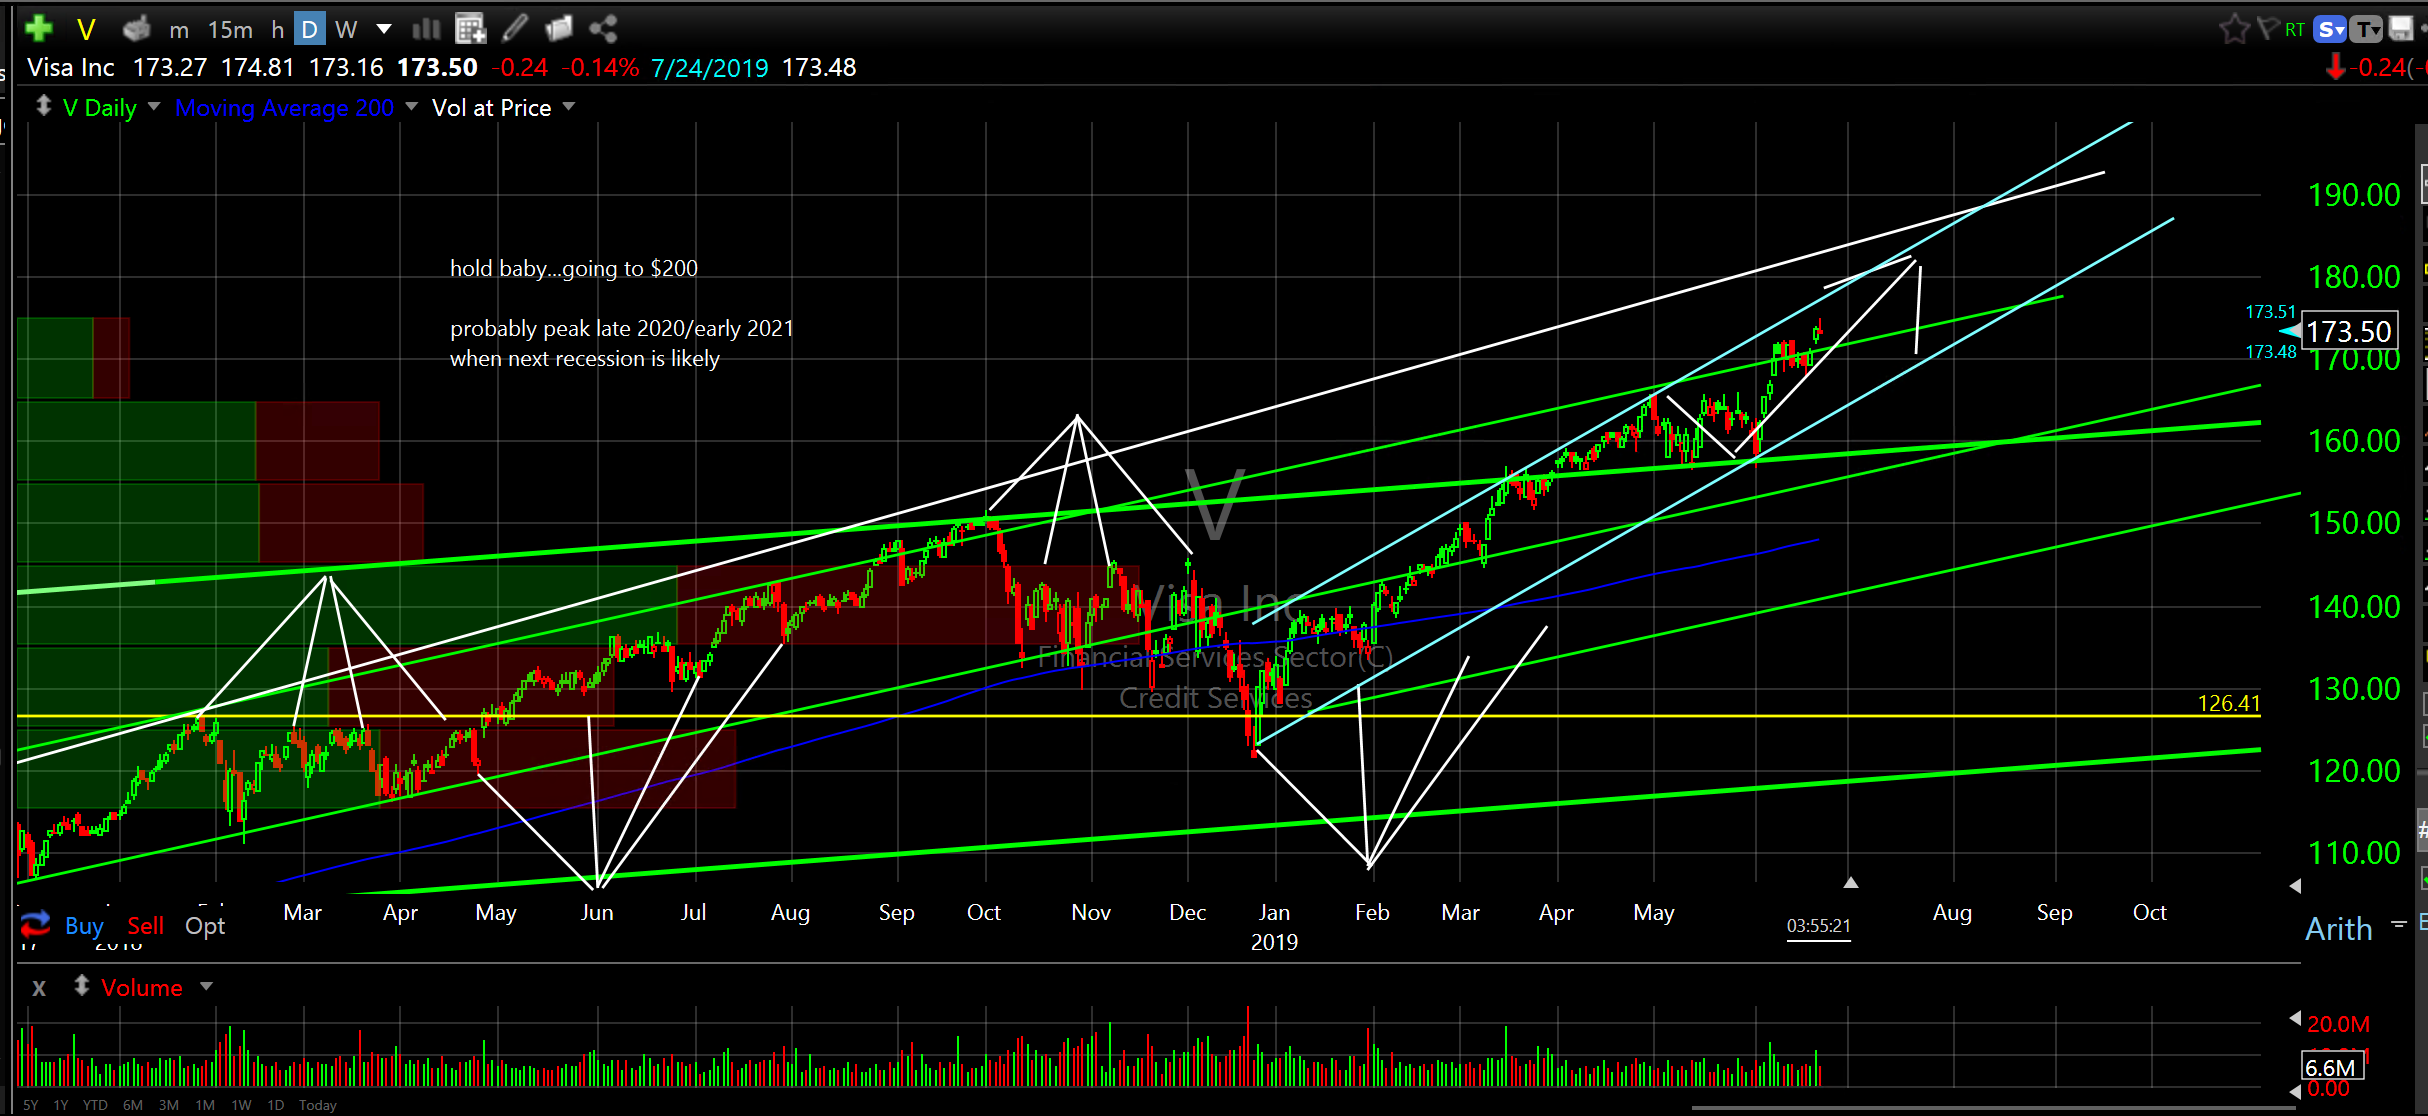
So, if you are on board with the idea of expansion into 2020 and are looking for additional exposure I would consider companies in the upper band of the quality spectrum that have contributed to past expansions; namely, Microsoft Corp (MSFT), Apple Inc (AAPL), Amazon.Com Inc (AMZN), Facebook Inc (FB) and Visa Inc (V). Notes on charts below. Remember, you can accumulate on dips in addition to establishing a starting position if you don’t already own as the entries on these might not be perfect at the moment.
Microsoft Corp (MSFT) daily
Apple Inc (AAPL) daily
Amazon.Com Inc (AMZN) daily
Facebook Inc (FB) daily
Visa Inc (V) daily
Now, as is my usual practice, here are a few charts I have been looking at and working on this week…
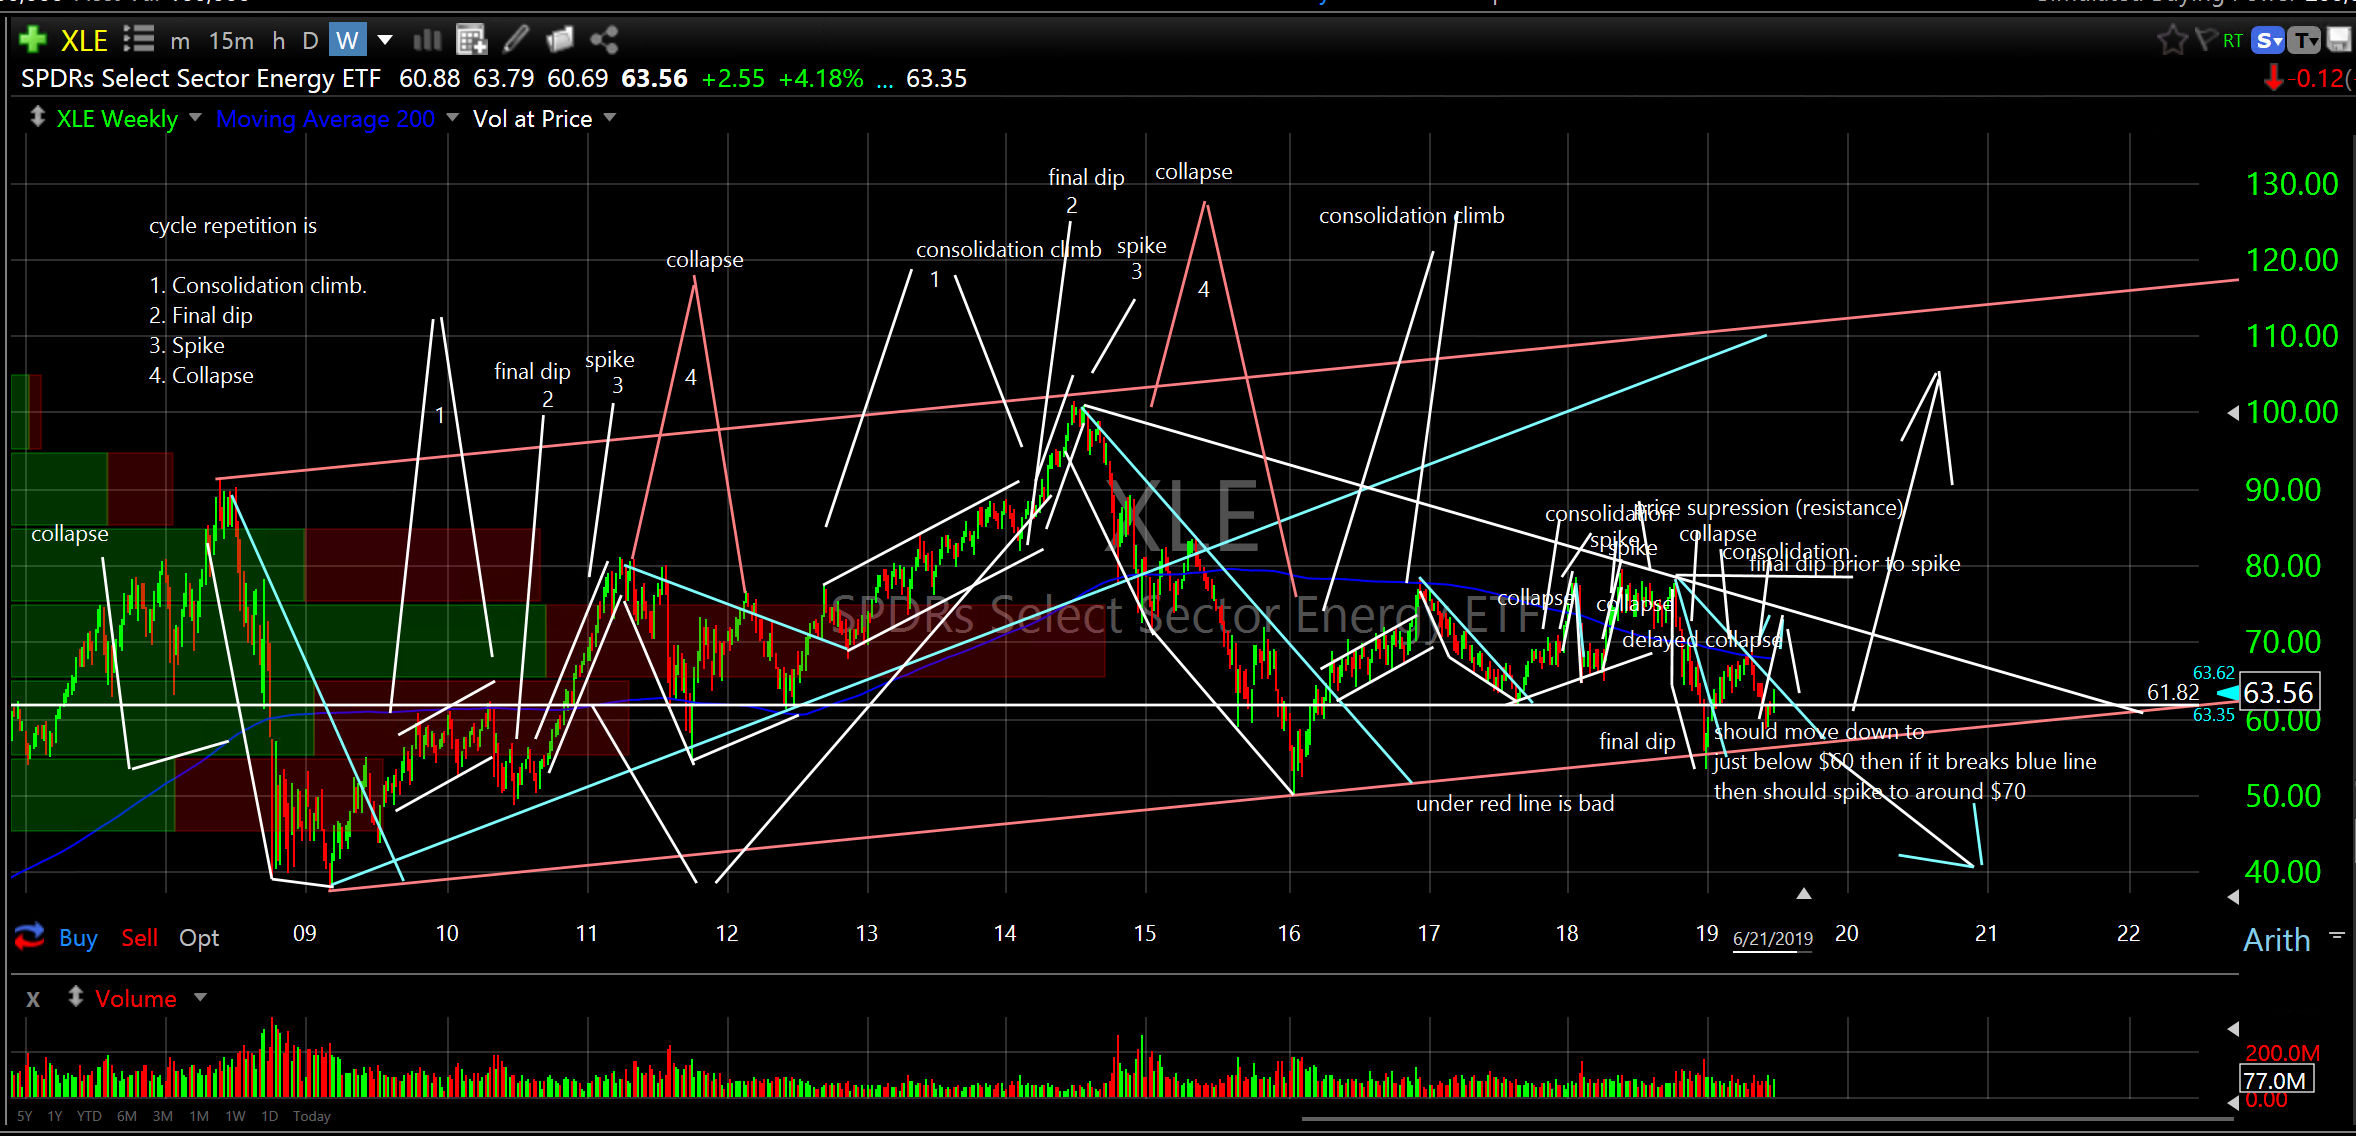
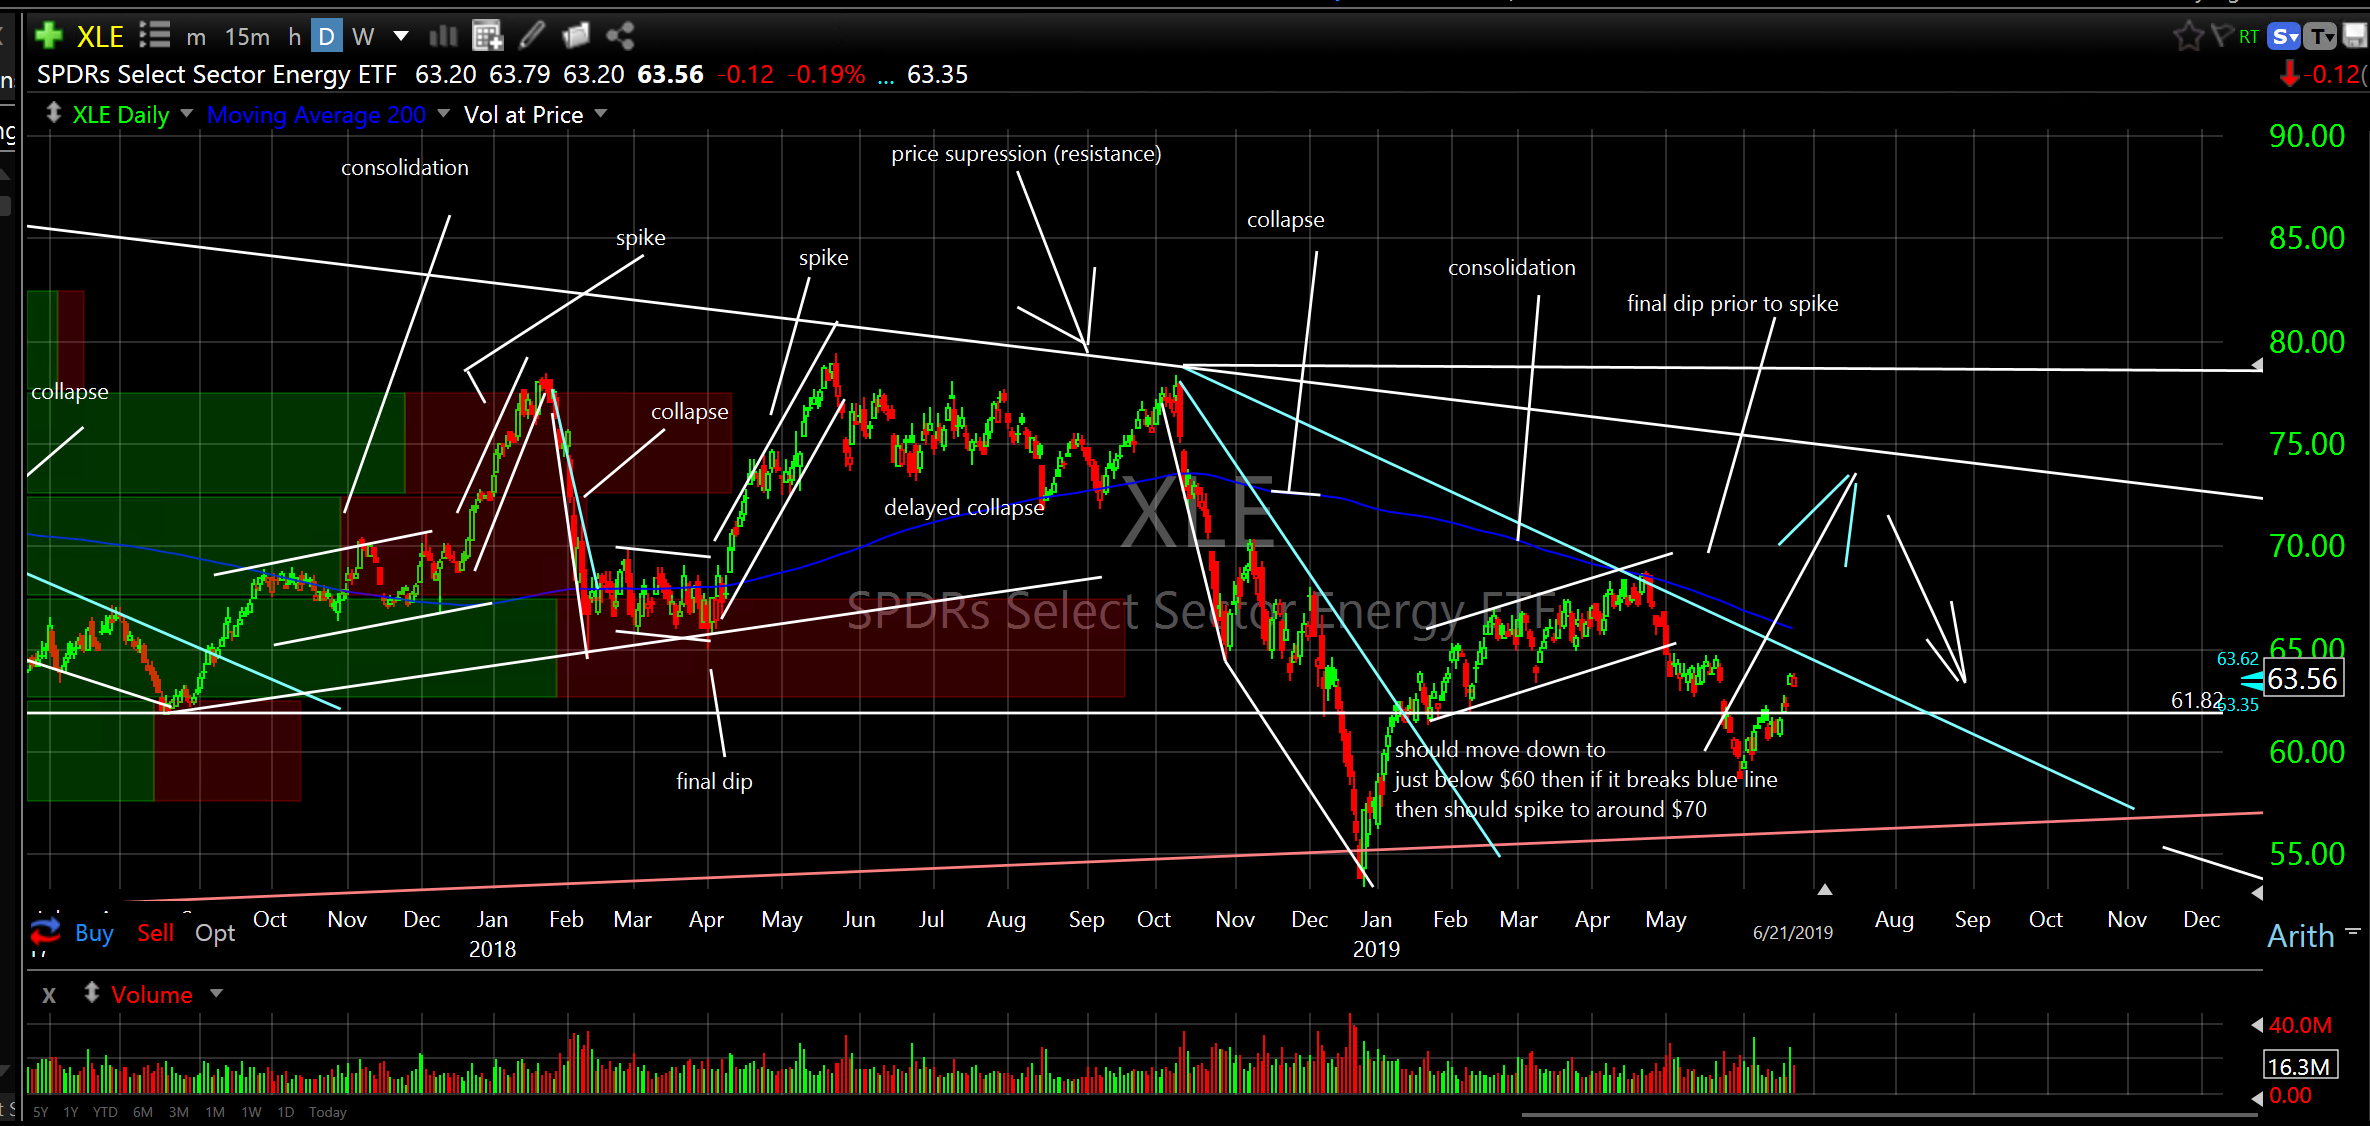
Let’s start by looking at a weekly chart of XLE, the Energy Sector ETF. I shared this chart with you about 6 weeks ago. I charted this on May 4th so all of the notes and annotations on the chart are from then. I have not added a thing since. Please review the cycle repetition characteristics I have identified on the weekly chart. Please note where we might be in the cycle. Also, on the daily chart, please note how price has followed my price projections to down just below $60 and the subsequent reversal. Now, if it can get above the descending blue line resistance line it has a good chance of going into spike mode and running towards $70 initially. This is where you are supposed to remind me not to trade this ETF anymore…haha. This is the backdrop for you to consider for the chart below of California Resources Corporation (CRC).
SPDR’s Select Sector Energy ETF (XLE) weekly
SPDR’s Select Sector Energy ETF (XLE) daily
CRC is high risk/high reward. This might provide (on steroids), as would XLE, a hedge against looming inflationary pressure that can be caused by the Fed pumping $ into the system. As you can see, price has literally crashed from $50 last October to under $14 late last year. It then spiked 100% to $30 then collapsed back down to $15 for a robust re-test and closed Friday at $19.41. If you are risk averse stay away. If you are willing to take the risk on then both XLE and CRC are setting up for potential spikes and may provide a hedge to potential inflationary pressure. The more conservative entry is waiting for resistance (descending green line) to be crossed.
California Resources Corporation (CRC) daily

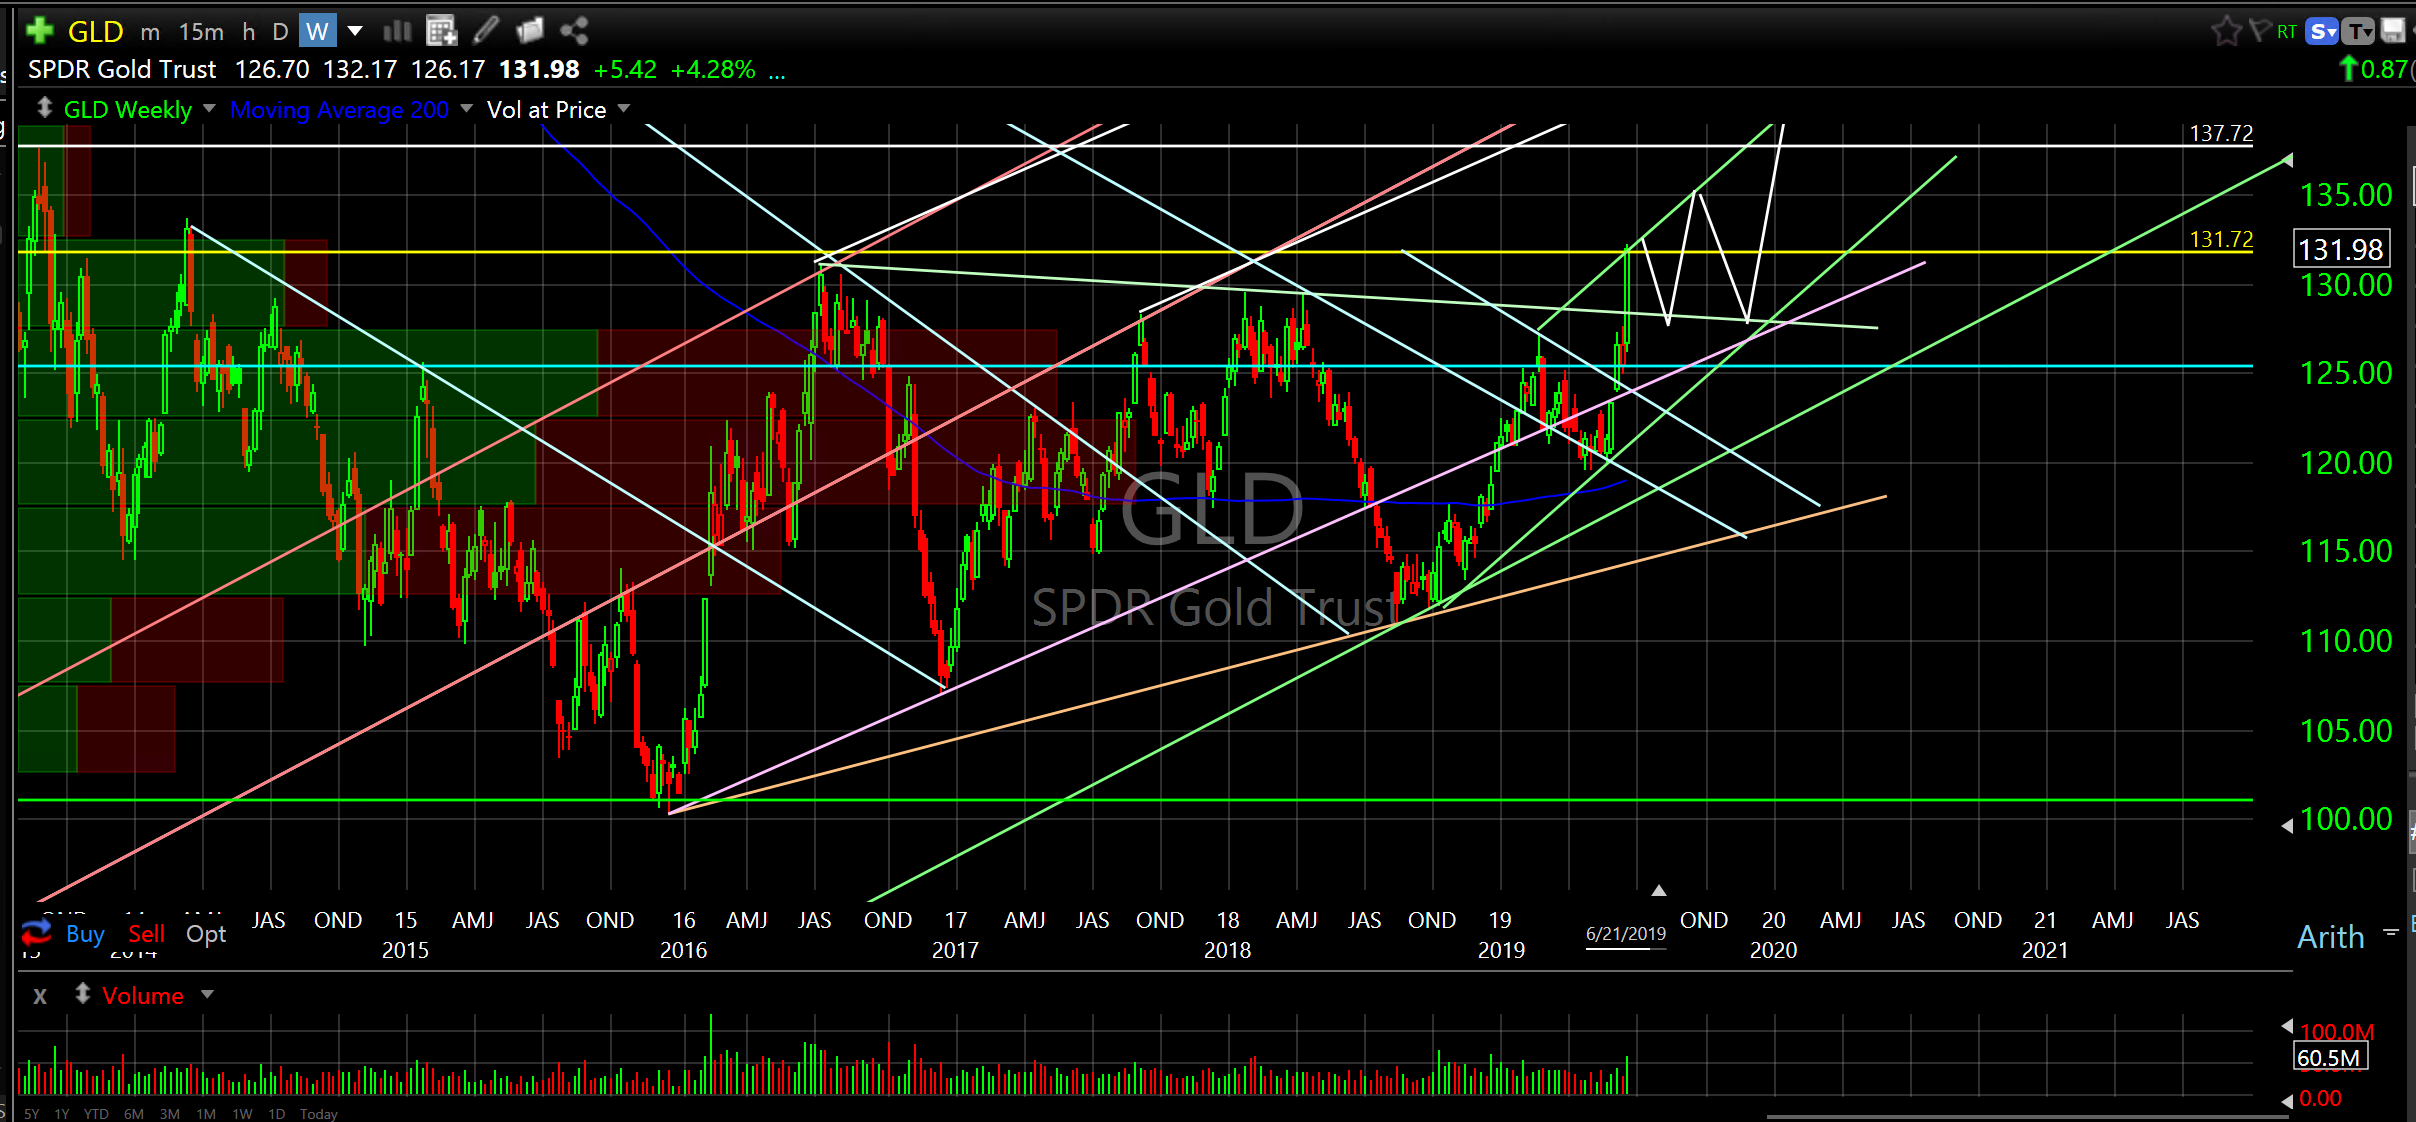
On this same theme, gold is breaking out of it’s six year range. The weekly chart of GLD shows a steady grind higher off the lows from last summer and now just sneaking by the high from 2016. Unless this is a gigantic head fake this metal should move higher. Please note historical choppy price action. There is no reason to expect this to go straight up but it sure looks like it’s on track for $137.
SPDR Gold Trust (GLD) weekly
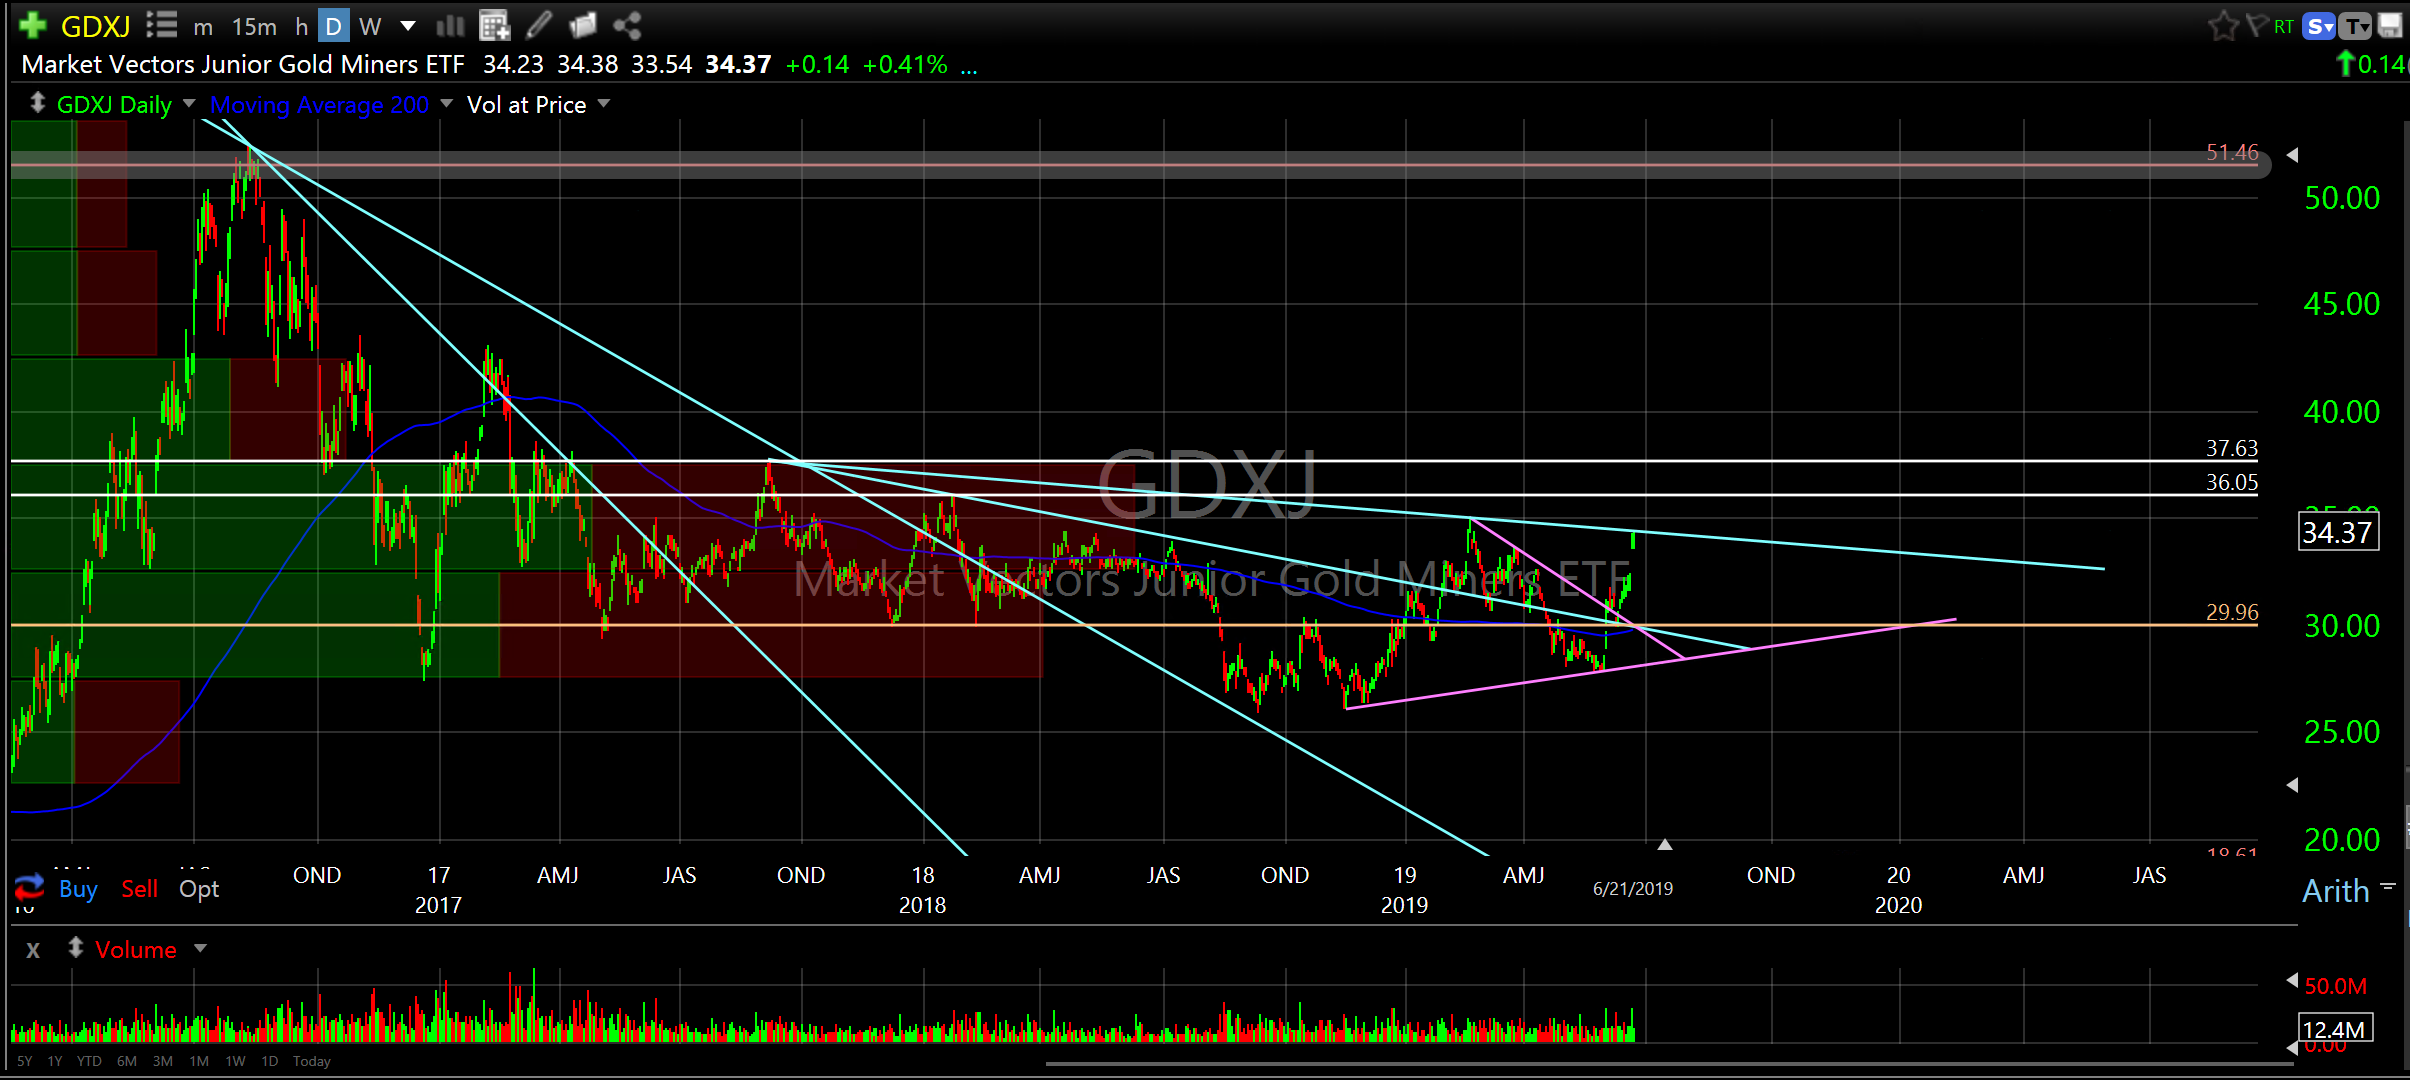
Look at the Gold Miners (GDX) and Junior Gold Miners (GDXJ) (small companies usually with large debt that can move much higher/lower relative to gold). There is likely to be lots of chop ahead but if you like gold you might want to have a teeny tiny position in either or both of these ETF’s. They are pretty low on the quality spectrum but can really, really move. High risk/high reward.
VanEck Vectors Gold Miners ETF (GDX) daily

Market Vectors Junior Gold Miners ETF (GDXJ) daily
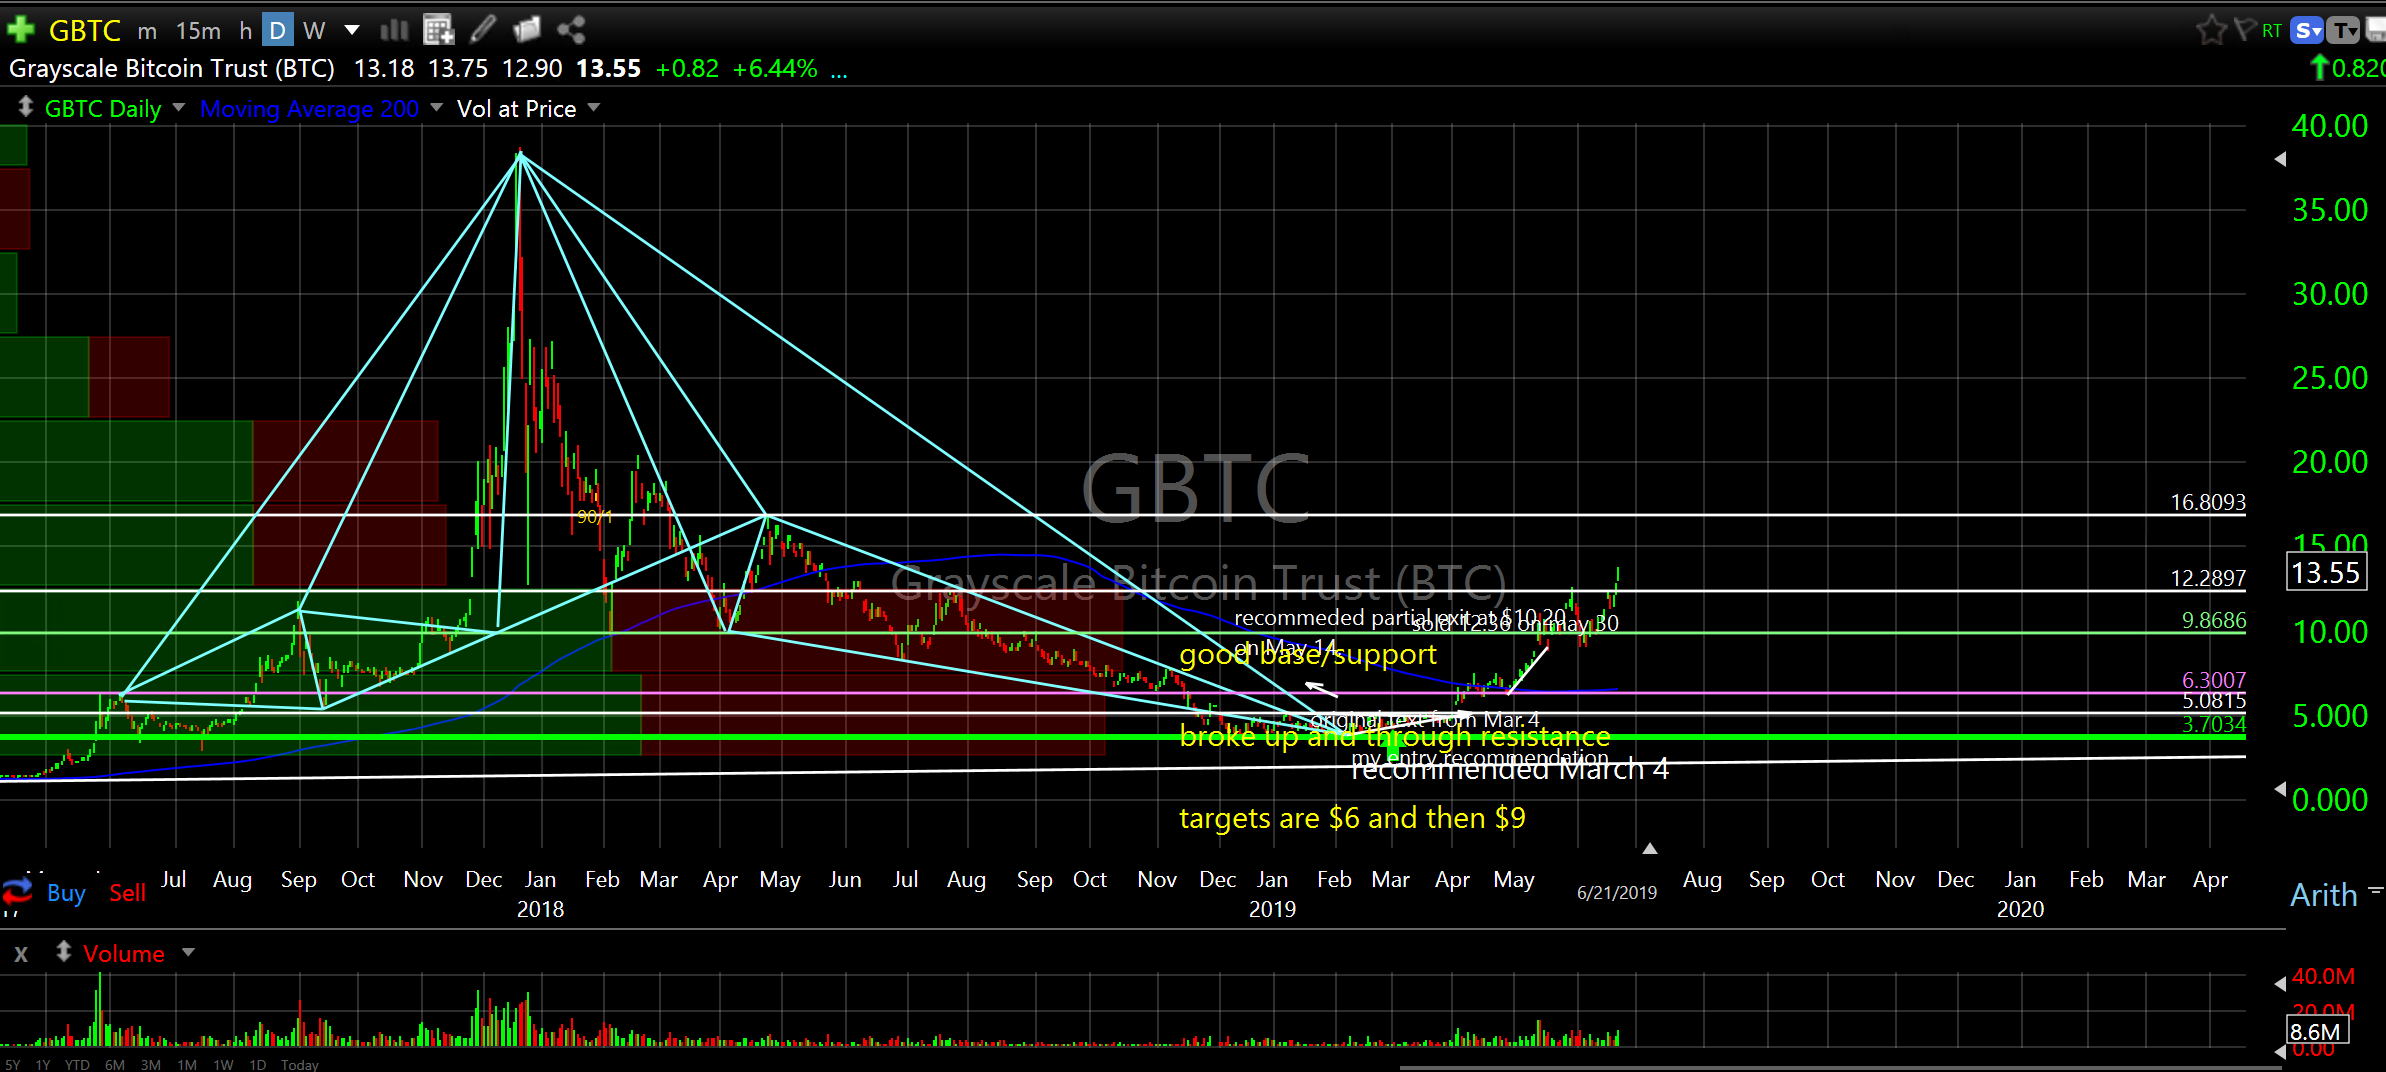
Speaking of giant head fakes, yields are drifting lower, bitcoin is ripping (up 207% from my entry (March 4th) highlight on 20% of original position), $US is at the upper end of its 12 year range (this is where reversals happen), energy is showing signs of bottoming, metals are moving (and everyone is noticing which makes me think everyone can’t be right) and stocks are on fire. The head fake just might be that sentiment is so bearish on stocks that it is, in fact, Full Tilt Boogie Baby time. This theme is consistent with the $US reversing lower soon, higher commodity prices and equity expansion.
How about that bitcoin trade? That was fun…and still is! Congrats if you played along.
Grayscale Bitcoin Trust (GBTC) daily

Grayscale Bitcoin Trust (GBTC) daily with wider perspective
Well, if we are looking at bitcoin we should probably look at Ethereum. Don’t ask me to explain this stuff because I don’t know anymore than you do. The only reason I would buy it is because I thought bitcoin was ramping. But, if you think bitcoin is speculative then Ethereum is very speculative. The charts below are the Grayscale Ethereum Classic Trust (ETCG) daily and hourly. Please note price coming in to support on the hourly chart…hmmm. Now you probably think I’m completely off my rocker.
Grayscale Ethereum Classic Trust (ETCG) daily
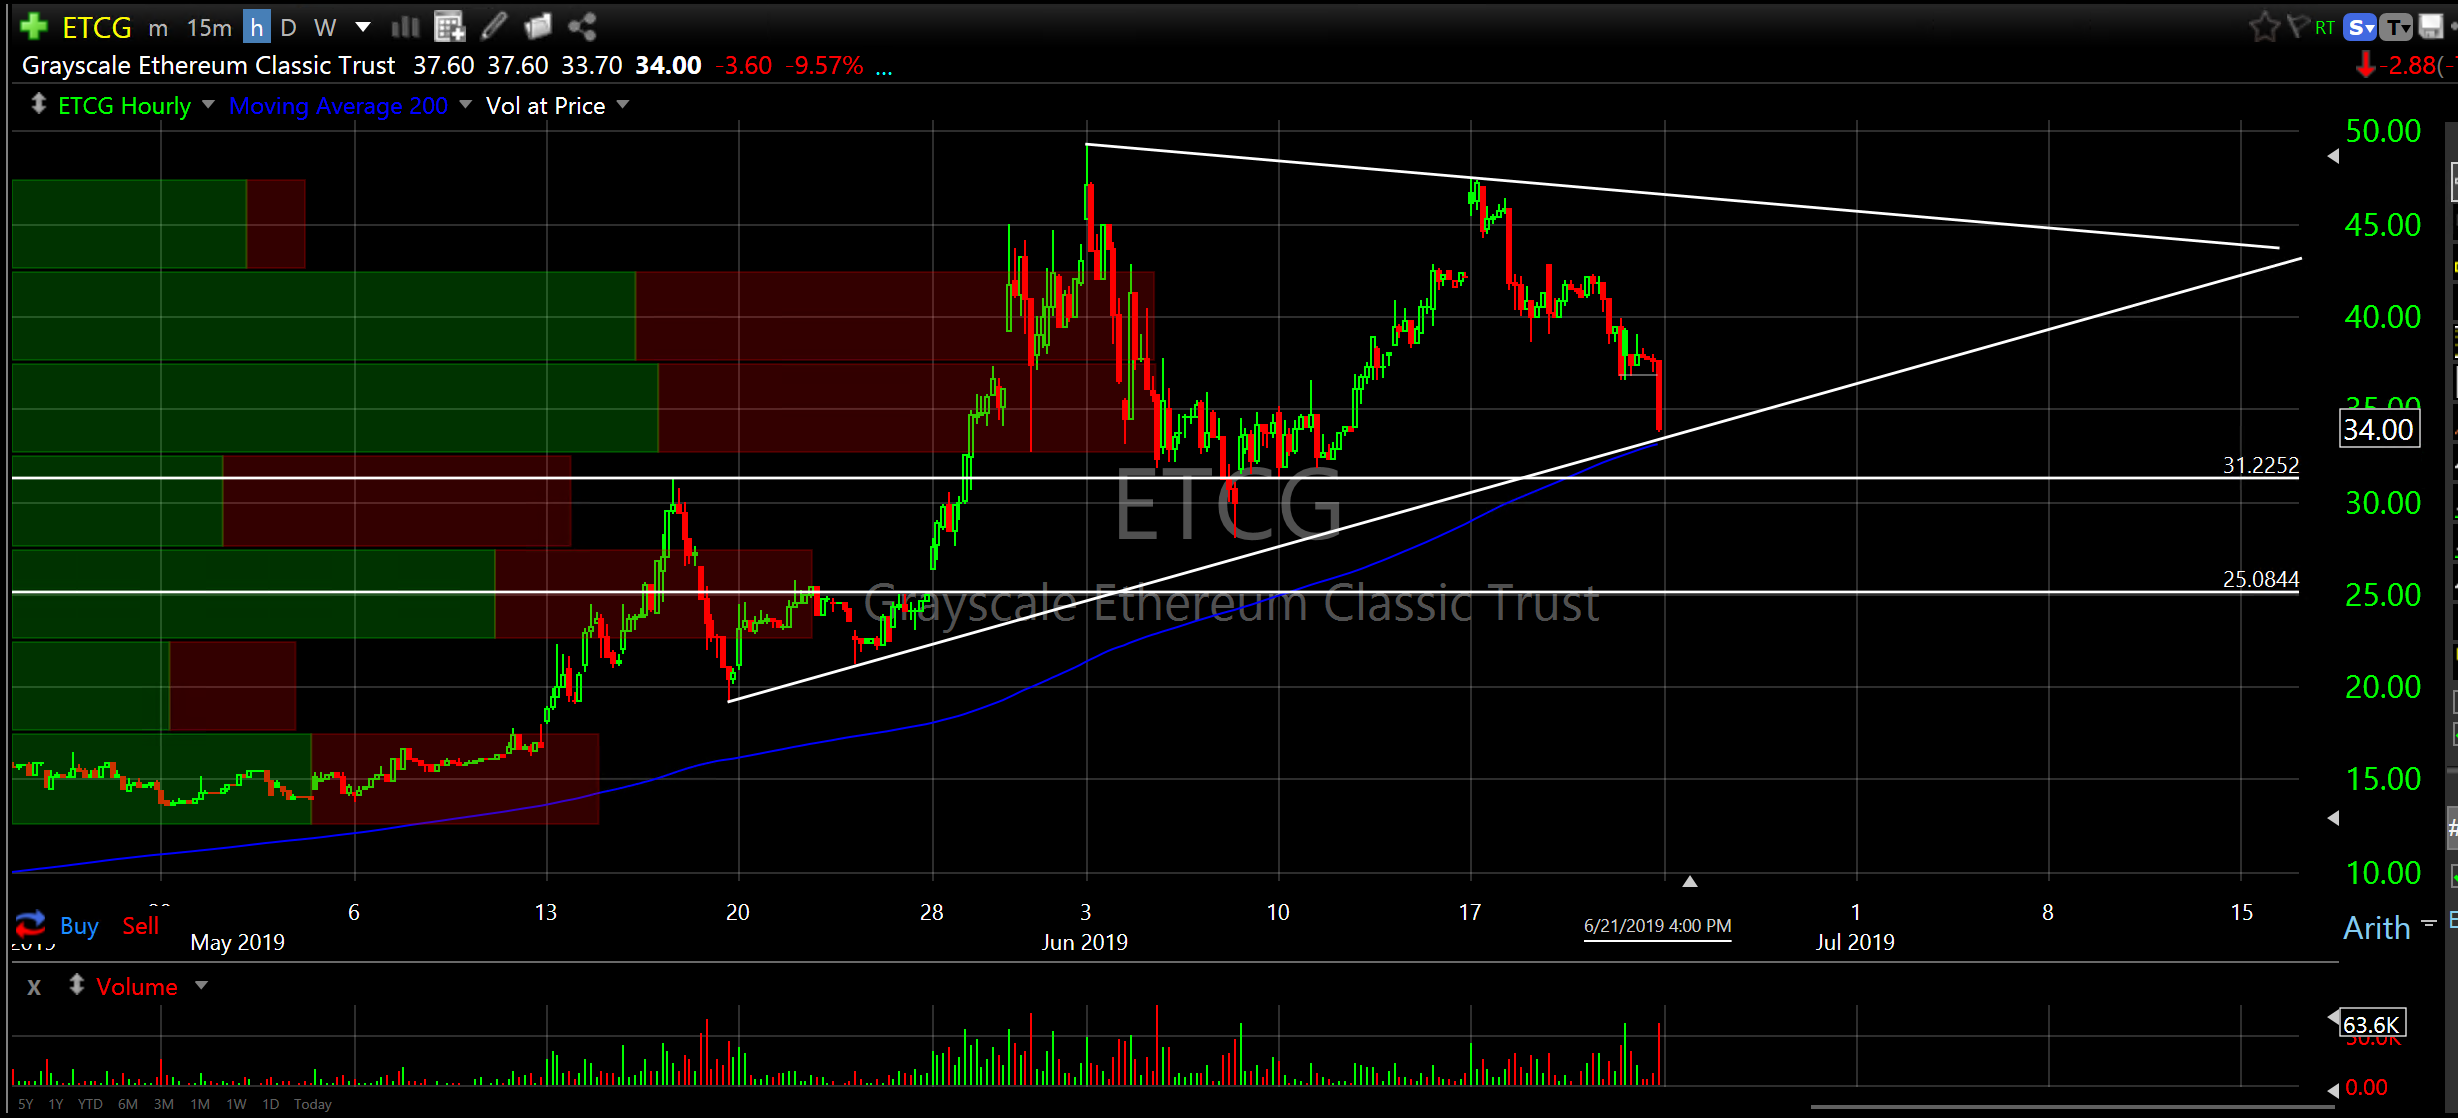
Grayscale Ethereum Classic Trust (ETCG) hourly
note lack of segue going from Ethereum to Lowe’s…
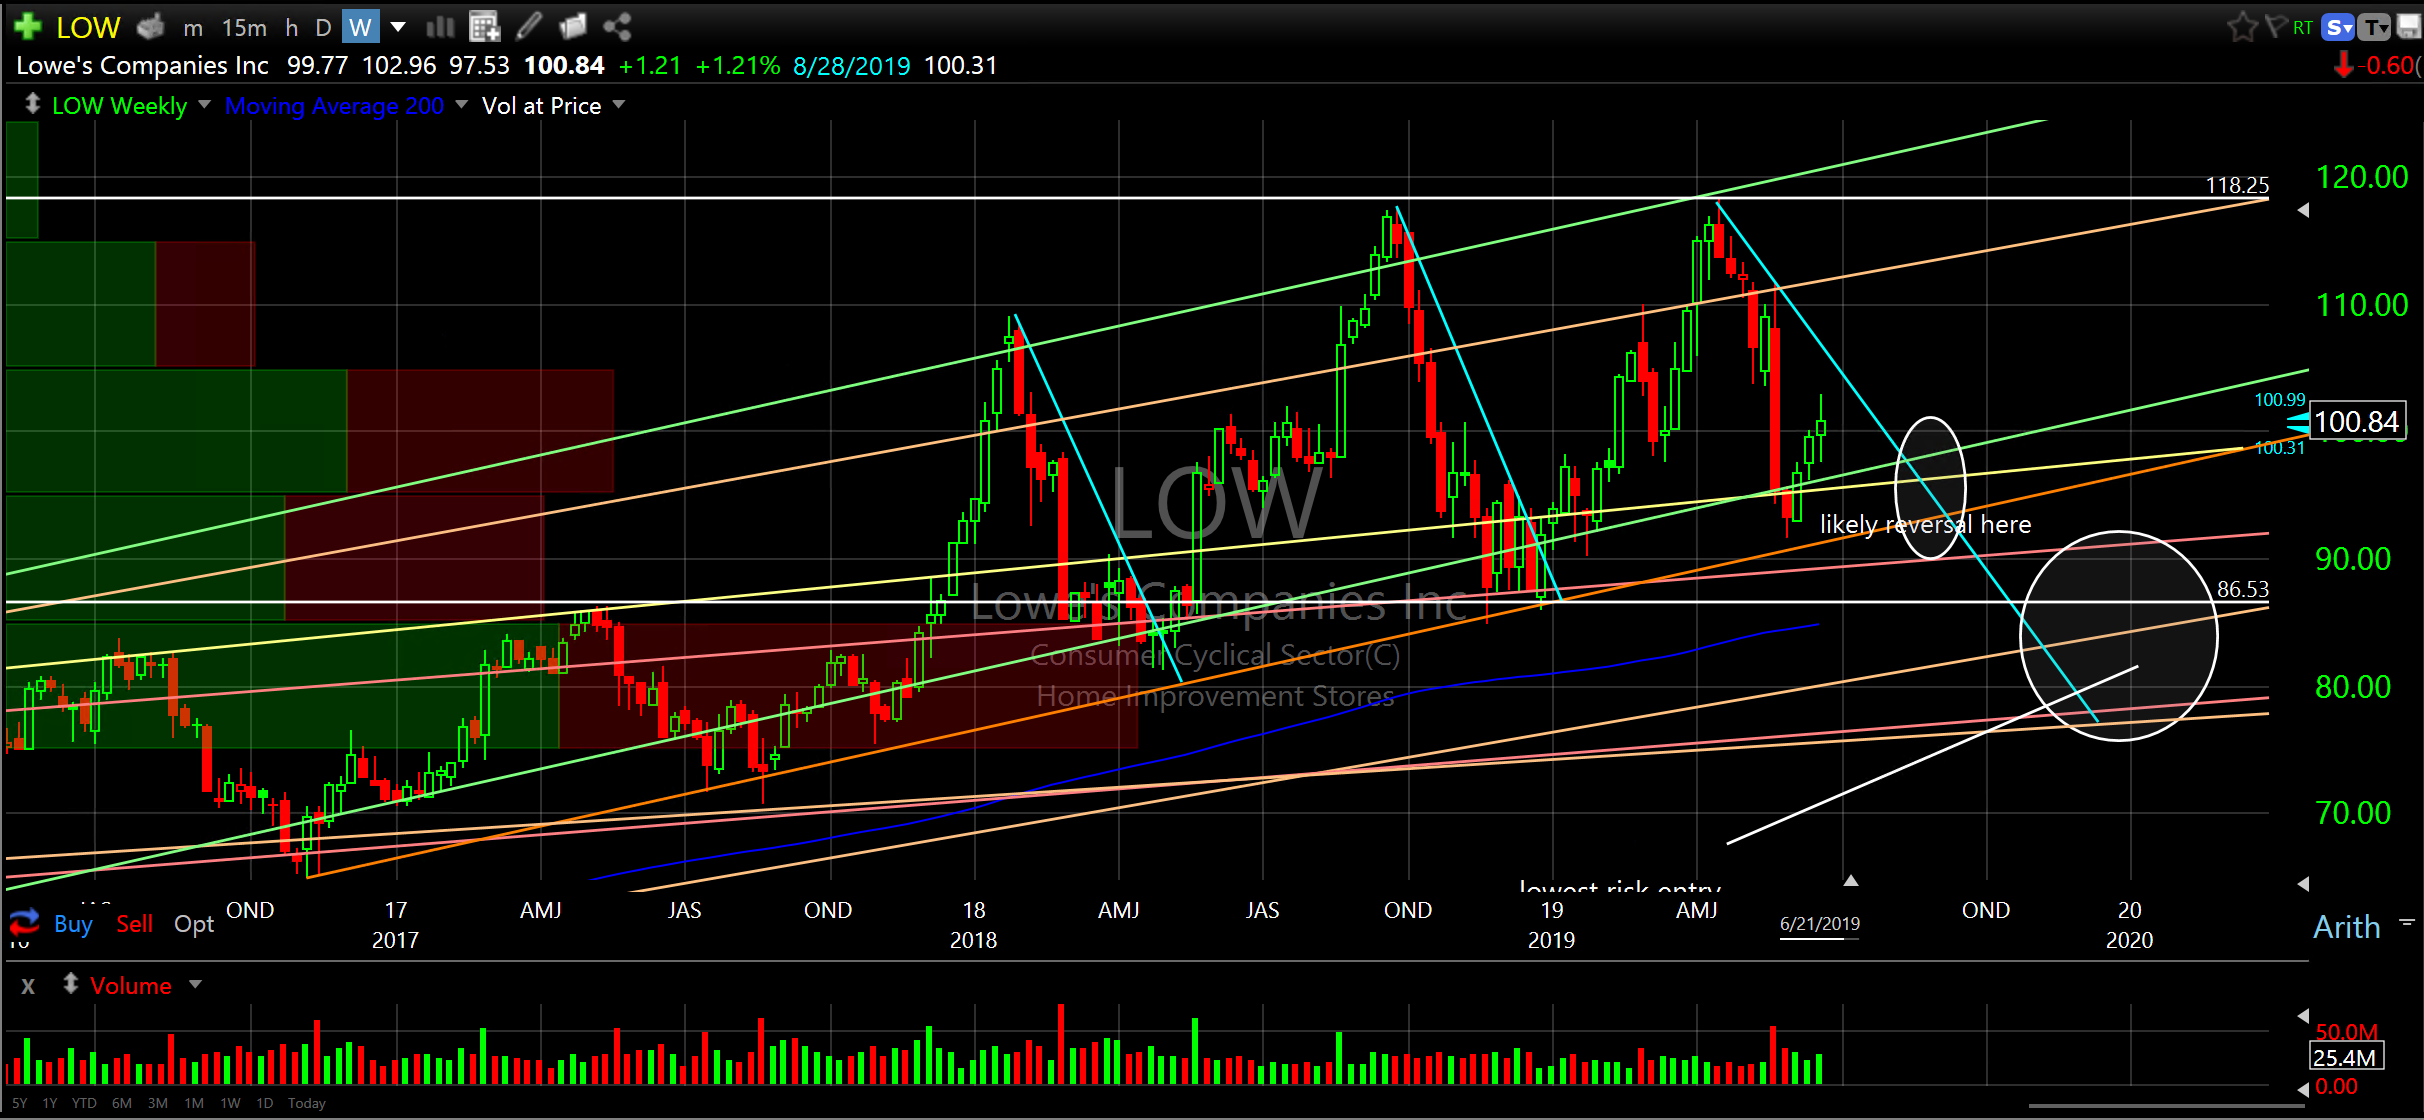
Lowe’s Companies Inc (LOW) looks interesting to me. You can see the spike/collapse repetition off the ascending brown baseline. Will it repeat? It sure has a chance if and when the blue descending resistance line is crossed. When that happens the spike should be quick so you might want to consider starting a position early. Spike history is running 15 to 20 weeks. A more conservative approach is to wait for resistance to be crossed but the trade off is usually buying at a higher price.
Lowe’s Companies Inc (LOW) weekly
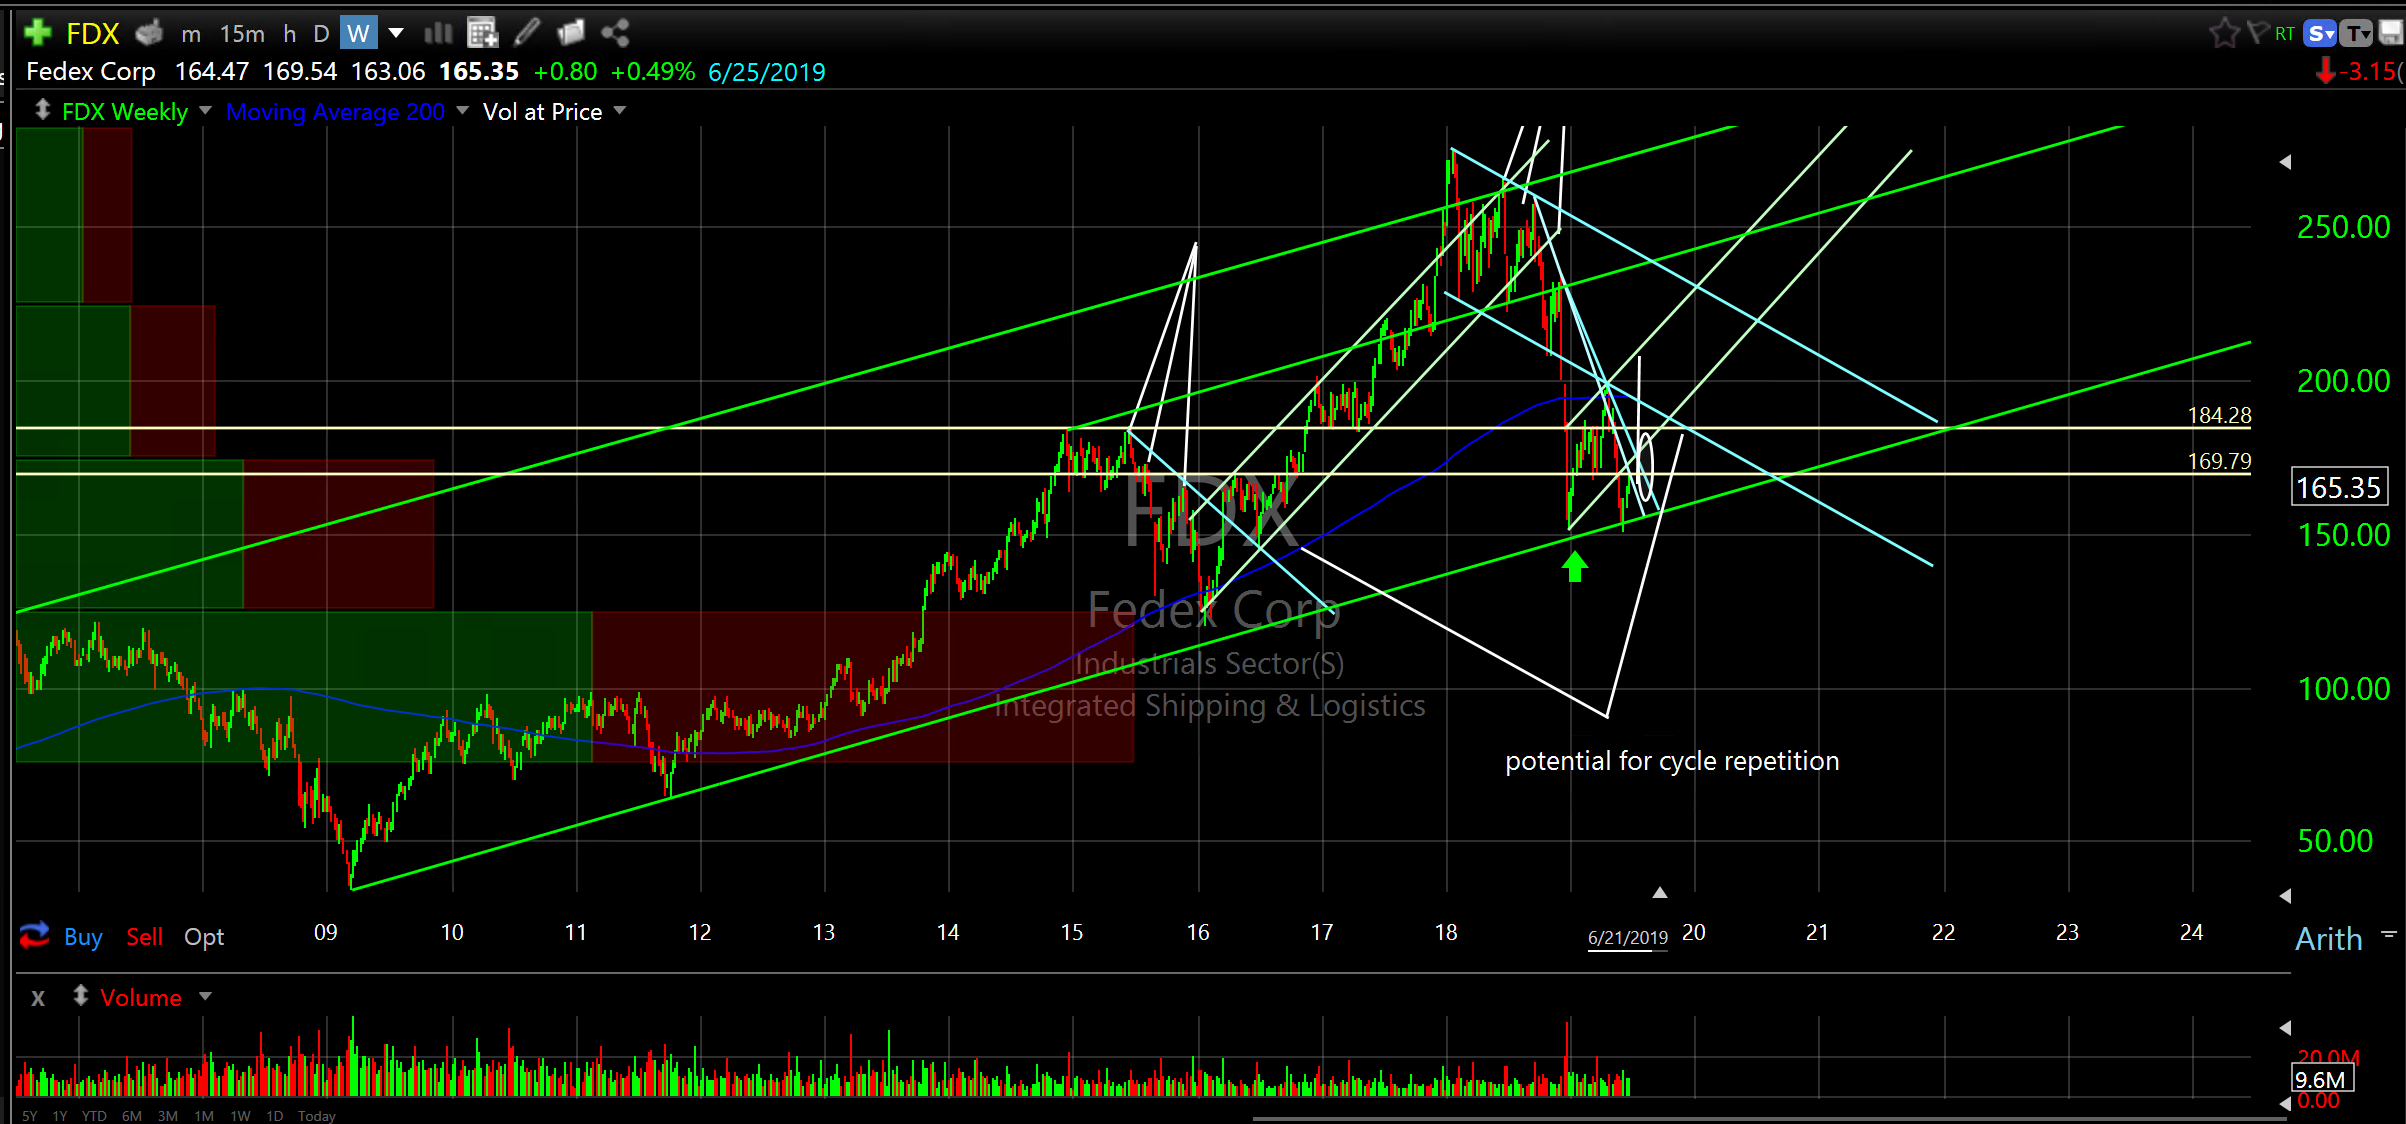
Check out the Fedex Corp (FDX) weekly and daily charts. I highlighted this one on January 14th. It ran up to $200 and just re-tested the December 2018 lows and reversed higher. If it can hold support (ascending green line) and start crossing descending blue line resistance then it could go into spike mode. If you like FDX this might be a good place to accumulate more or begin a position. As usual, the more conservative approach is to wait for resistance to be crossed.
Fedex Corp (FDX) weekly
Fedex Corp (FDX) daily

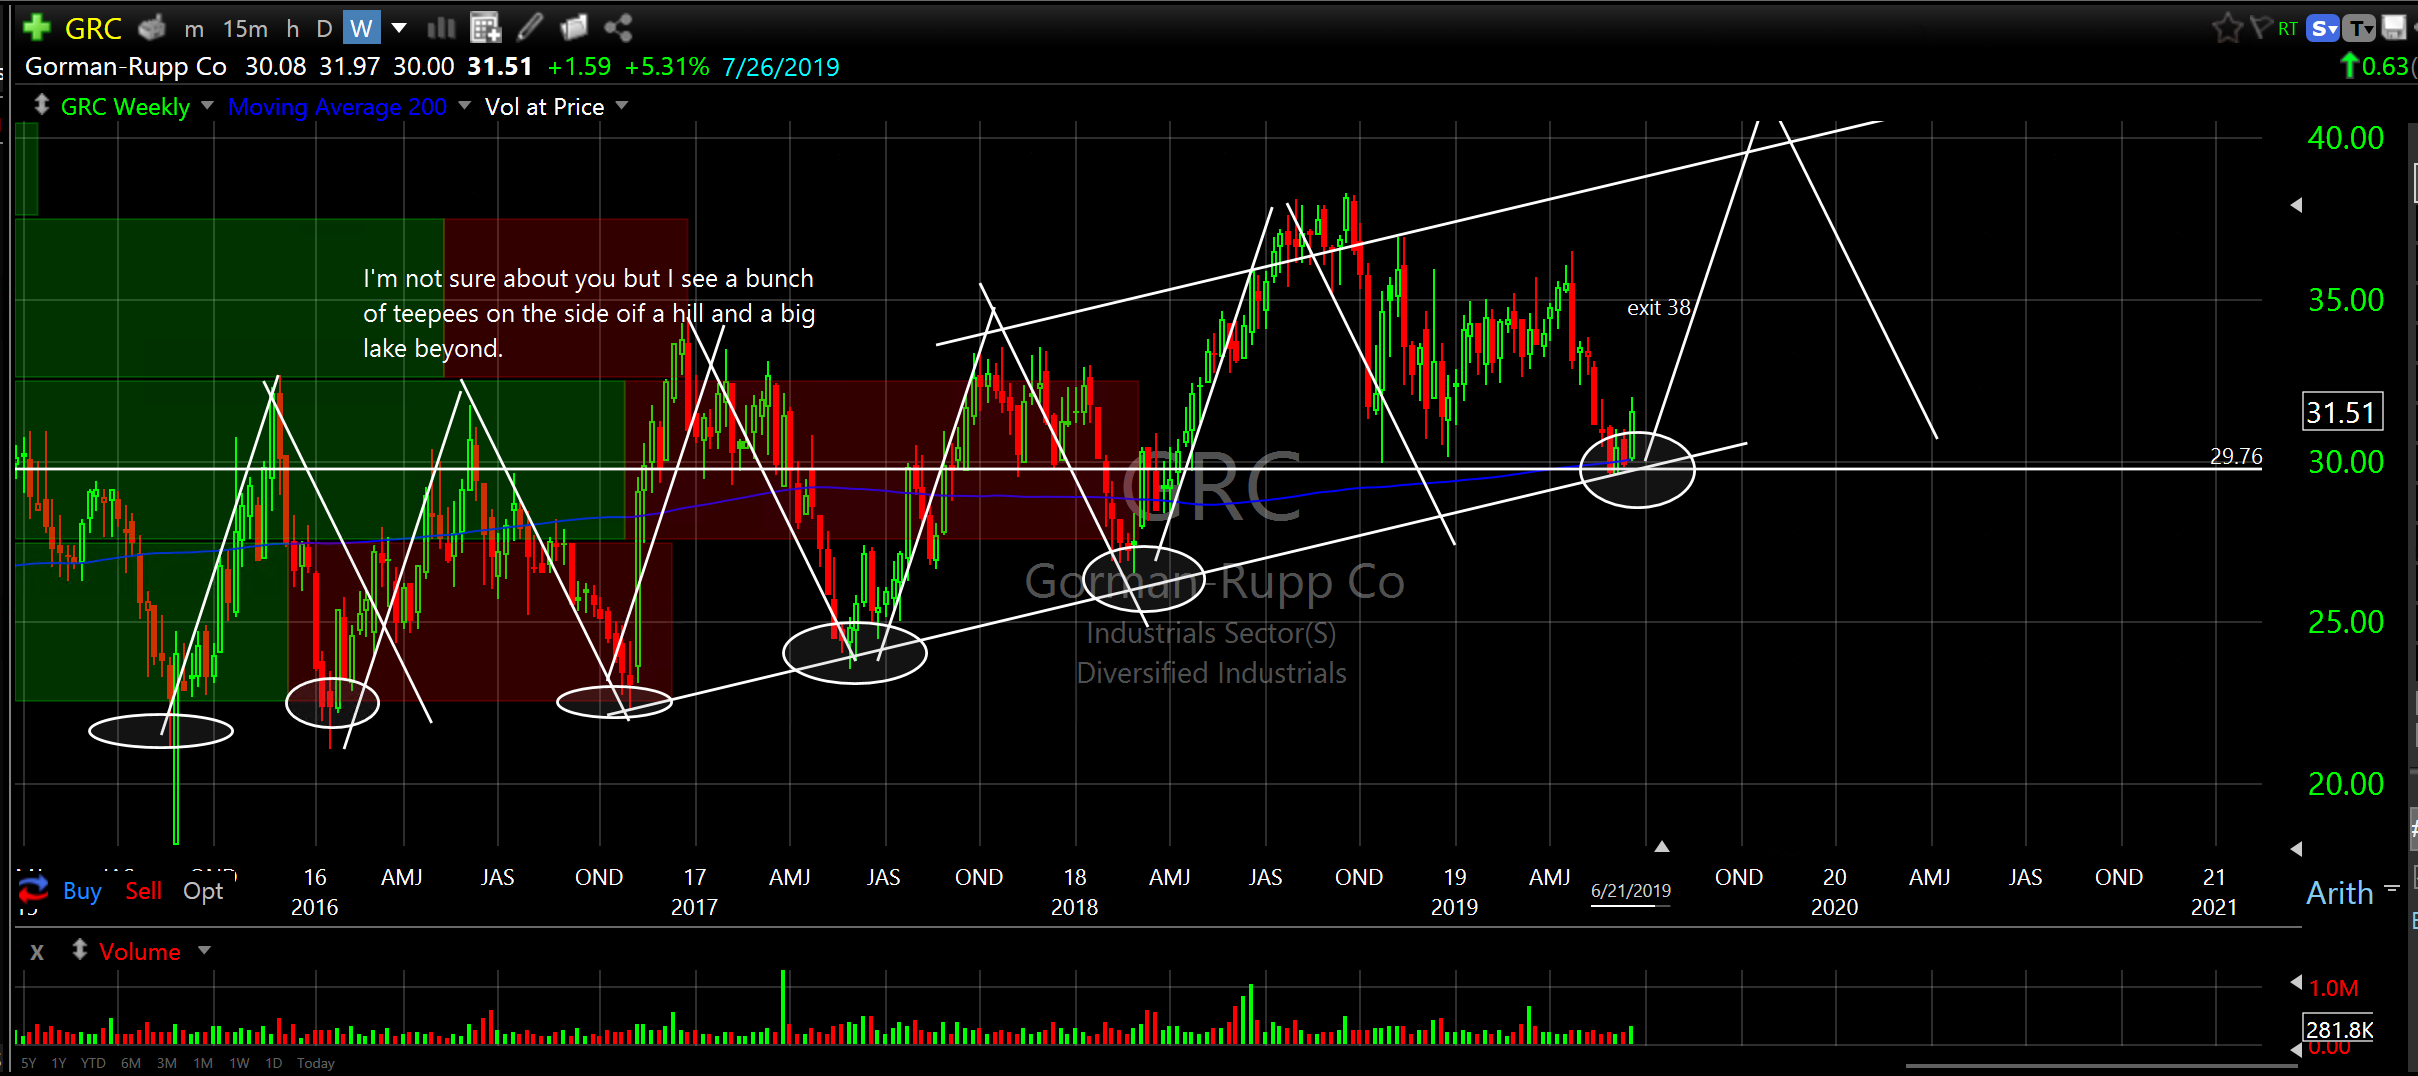
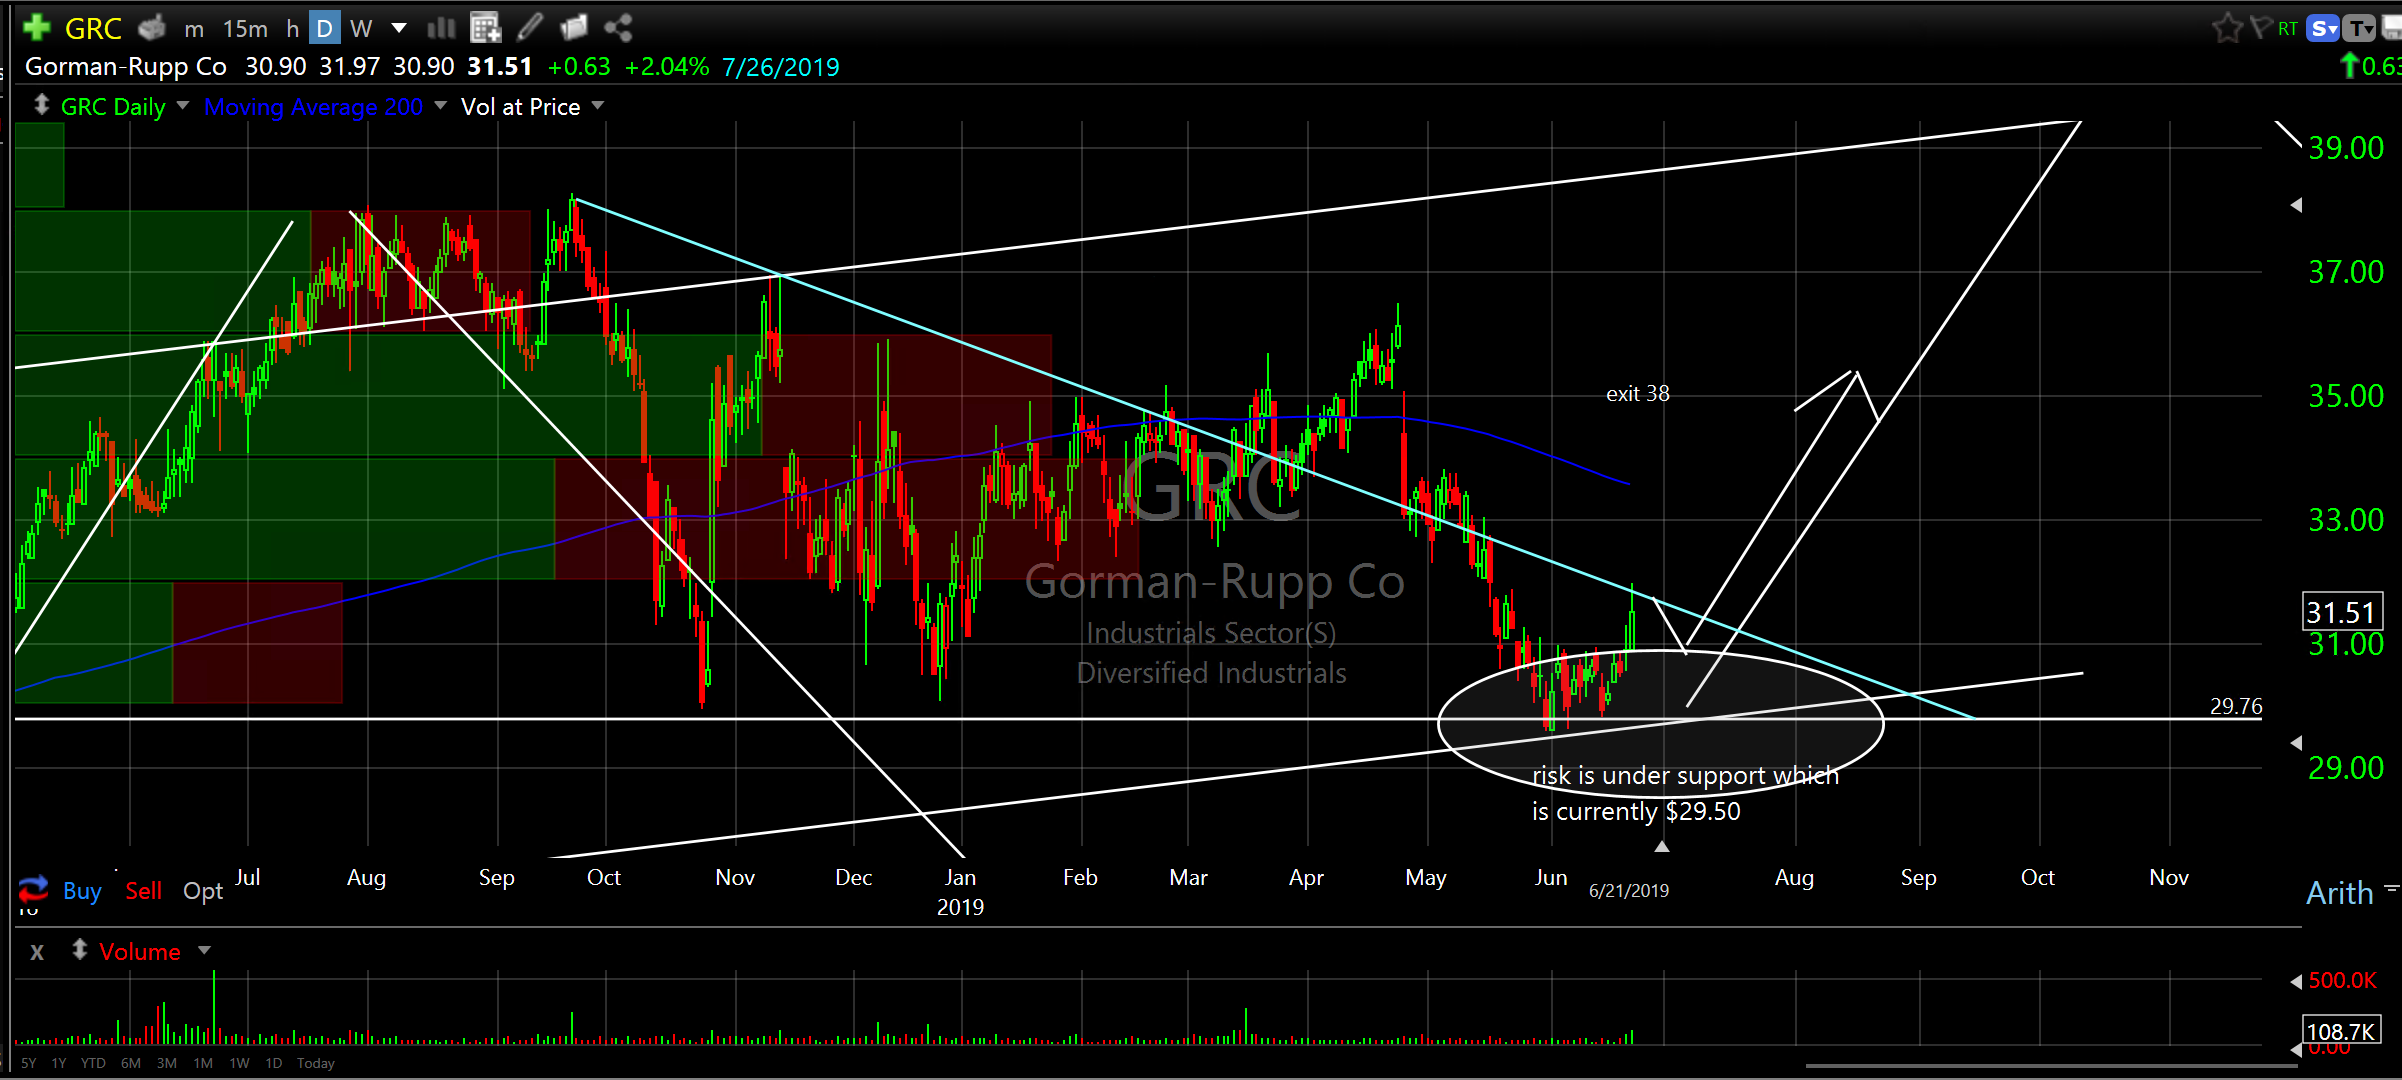
And finally, to wrap things up take a look at the two daily charts for Gorman-Rupp Co (GRC), a small cap that pays a 1.71% dividend. These charts looks so good I’m trying to figure out why NOT to buy it. So far, I can’t think of any. Look at the repetition. Look at the historical spikes off the ascending baseline (support). Look at all the teepees!
Gorman-Rupp Co (GRC) weekly
Gorman-Rupp Co (GRC) daily with narrower view
So, it appears we might be in Full Tilt Boogie Baby mode. I have lots of companies I like but I think it wise to keep nudging slowly. Watch for the $US to reverse lower, gold to ramp up with choppy price action, potential energy related reversal higher, drifting yields and domestic/international/ emerging markets expansion.
And in signing off…
To my friends up north in Canada with a wellspring of natural resources; mining, oil and Totem Poles (I love them)…it looks like a break out is on the horizon. Check out the chart of EWC, Shares MSCI Canada Index Fund ETF (EWC). Eh?
Shares MSCI Canada Index Fund ETF (EWC) weekly

I hope my weekly report is helpful to you. I hope my charting provides a framework for you to be able to “see” where capital is flowing and might flow into the future. Please do your own due diligence and other research you employ as my work is just my opinion and should not be taken as investment advice. My work is just another layer of analysis…even though I think it’s the most important layer. It helps me and I hope it helps you.
Have a Fantastic Week,
Don