If you went global with me a few weeks back then you’re pretty profitable right now.
Today I want to review some of our recent Global ETF’s trades, introduce some new Global ETF’s with good entry points, plus we’re going to sell XLE for a small gain (not on the Global ETF trend, but you get the point).
Here’s a quick overview:
- SPDR’s Energy ETF (XLE)……………………………………SELL +2%
- India Index Fund ETF (INDA)………………………………Hold +16%
- Mexico Index Fund ETF (EWW)……………………………Hold +20%
- Schwab International Equity ETF (SCHF)………………Hold +3%
- China Index Fund ETF (MCHI)……………………………..BUY
- South Korea Index Fund ETF (EWY)………………………BUY
- iShares Core MSCI Emerging Markets ETF (IEMG)…BUY
- Euro Stoxx 50 ETF (FEZ)………………………………………BUY
SPDR’s Energy ETF (XLE) weekly
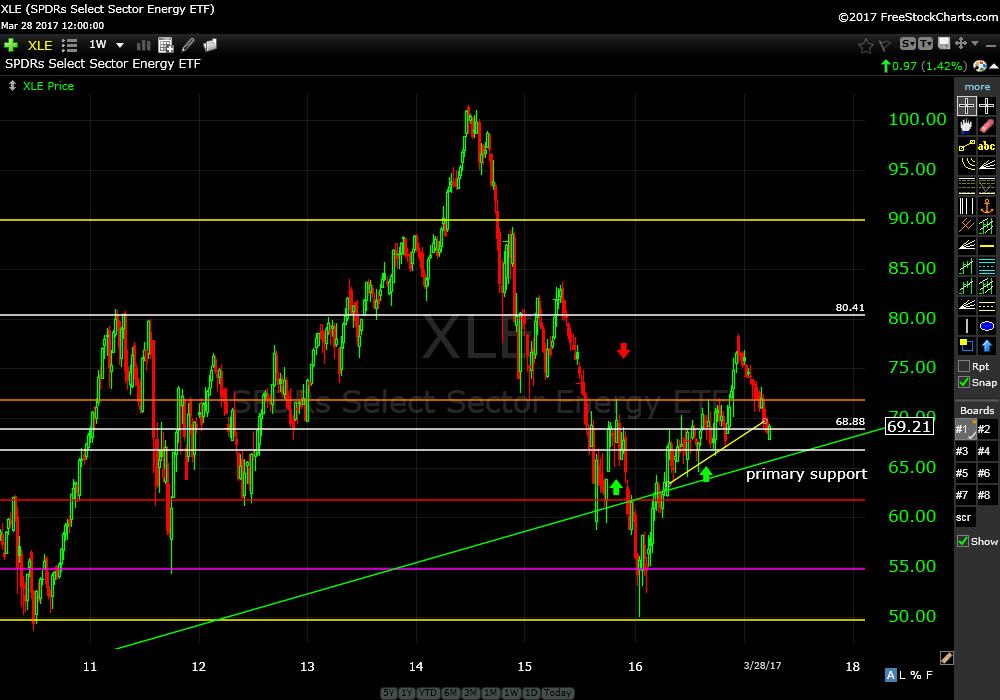
XLE looks like it’s coming back into primary support. I’m recommending selling it and waiting for another opportunity to get long. It’s about a 2% gain at the close on Tuesday, March 28. Sell it and we should get another chance to get long soon.
More Globetrotting…
In January I recommended buying INDA and EWW.
India Index Fund ETF (INDA) daily
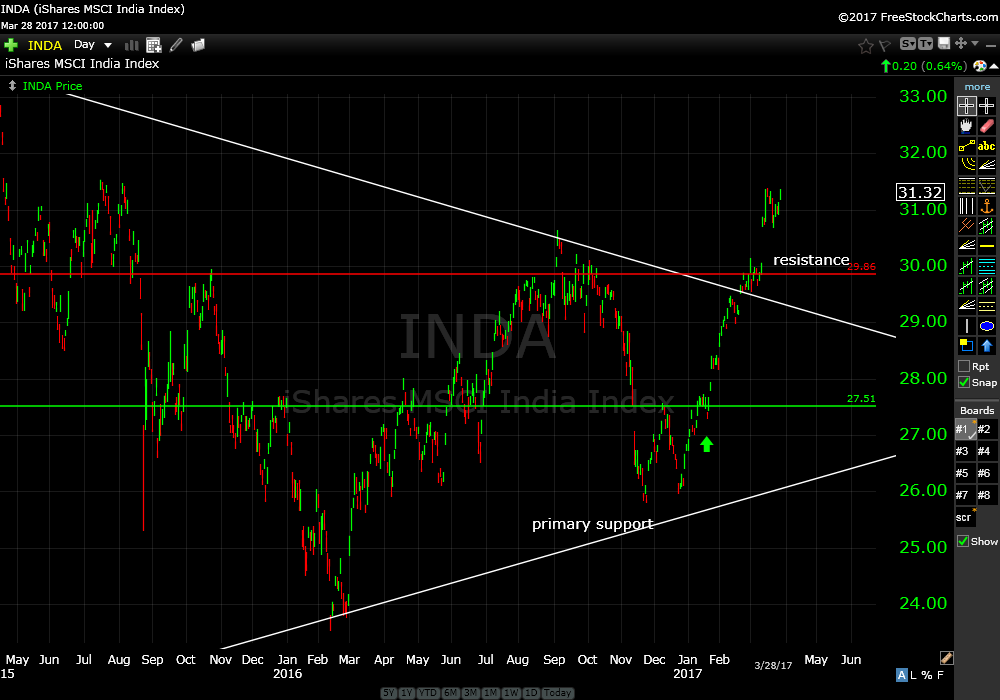
Price is up 16% from my recommendation. Continue to hold.
Mexico Index Fund ETF (EWW) daily
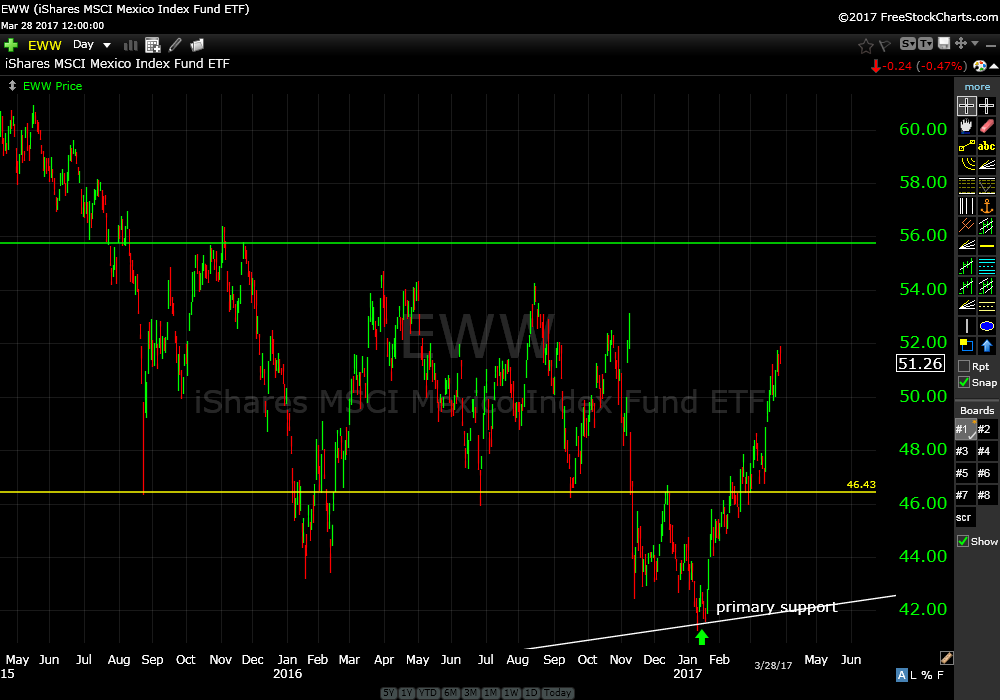
Price is up 20% from my recommendation. Continue to hold.
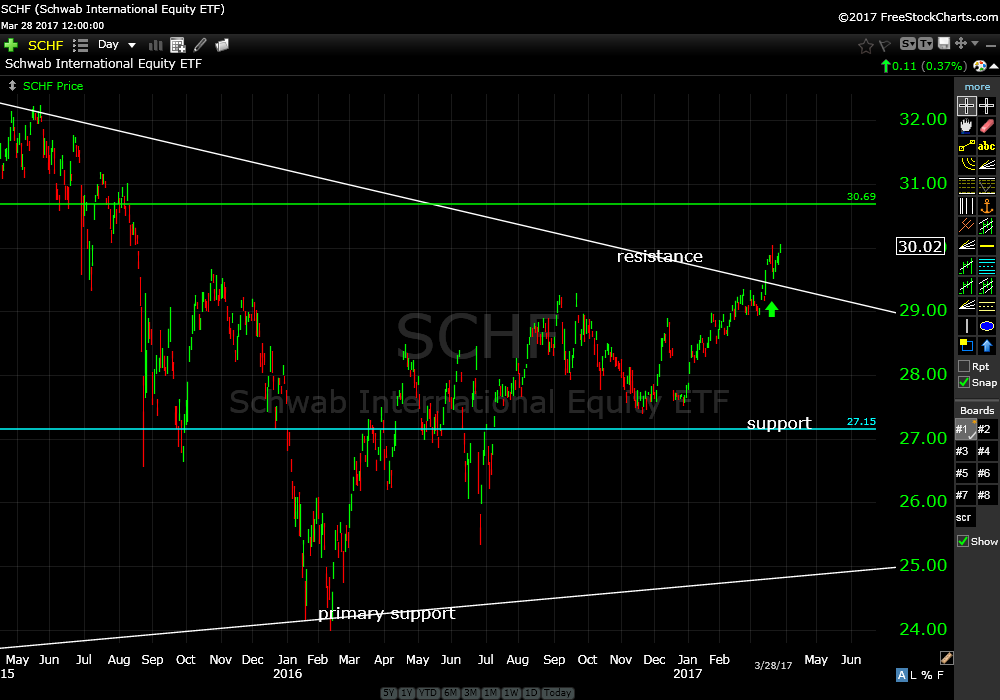
Last week I recommended buying Schwab International Equity ETF (SCHF). It’s up about 3%. Continue to hold.
Schwab International Equity ETF (SCHF) daily
I also discussed China, South Korea, Emerging Markets and the EU last week. I think it’s time to get more global.
China Index Fund ETF (MCHI) daily
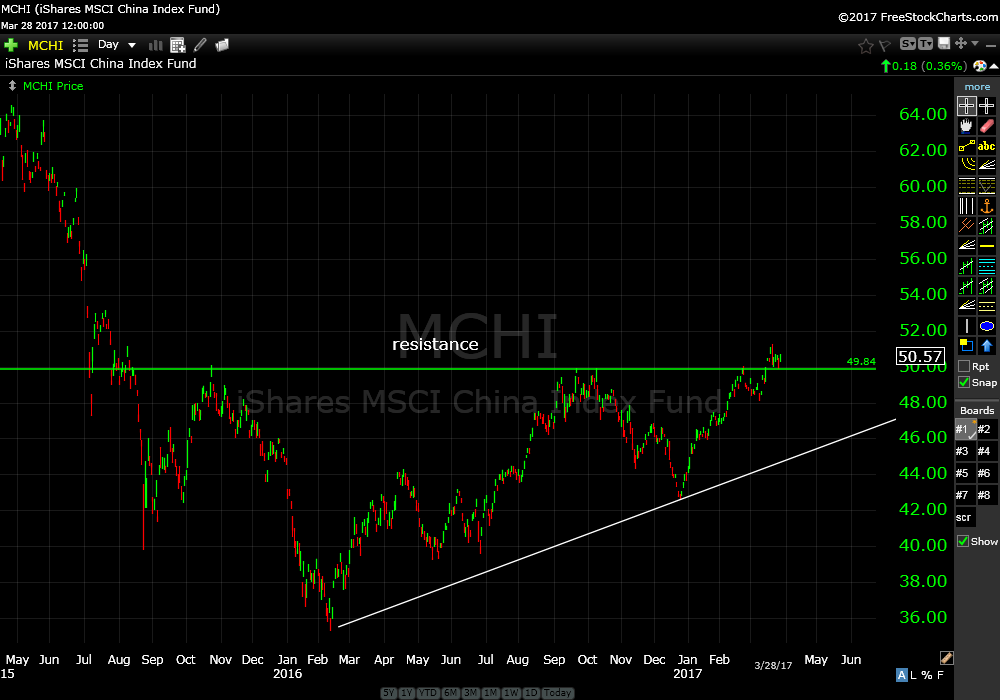
Price has cleared resistance and made new highs from October 2015. It’s going to start getting some attention now. I’m putting it on the buy list for tomorrow, Wednesday, March 29. Risk is under $49 in the short term.
South Korea Index Fund ETF (EWY) weekly
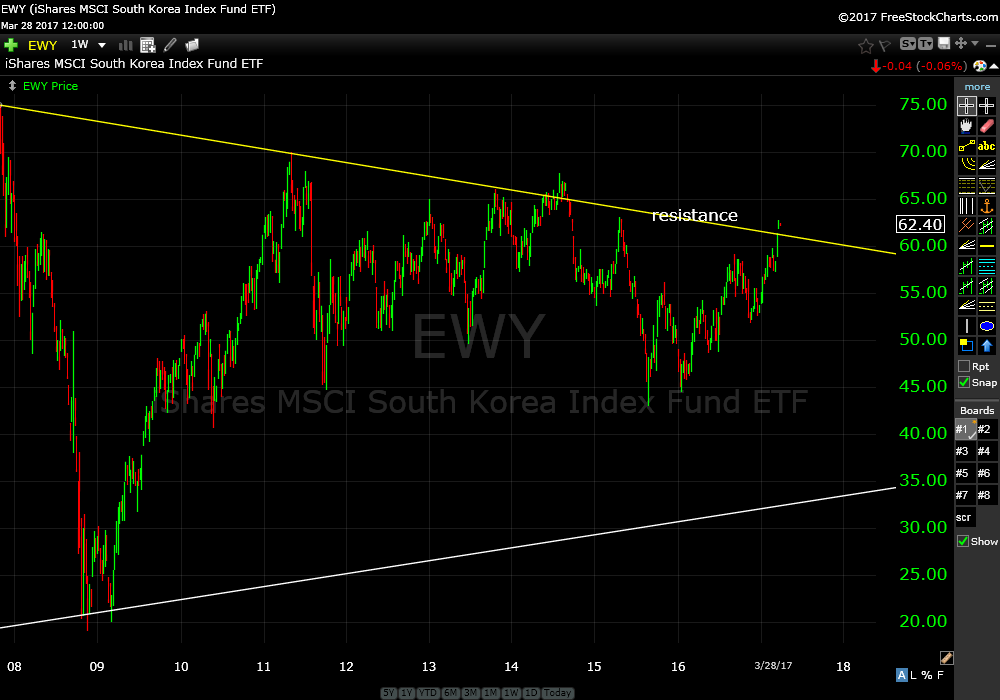
Price has cleared resistance and has been strong from early 2016. This one might get more attention in the coming months. Risk is under the downwards sloping yellow trend line. I’m adding this to the buy list for tomorrow, Wednesday, March 29.
iShares Core MSCI Emerging Markets ETF (IEMG) daily
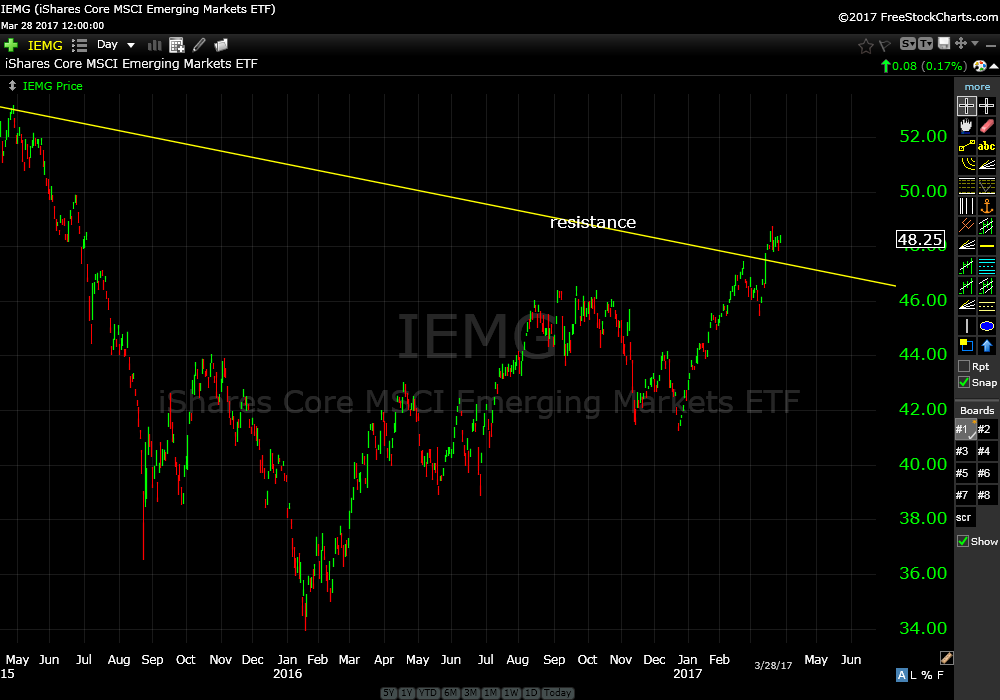
Similar price action going on with emerging markets. Risk is under downwards sloping yellow trend line. I’m adding this one to the buy list for tomorrow, Wednesday, March 29.
Euro Stoxx 50 ETF (FEZ) weekly
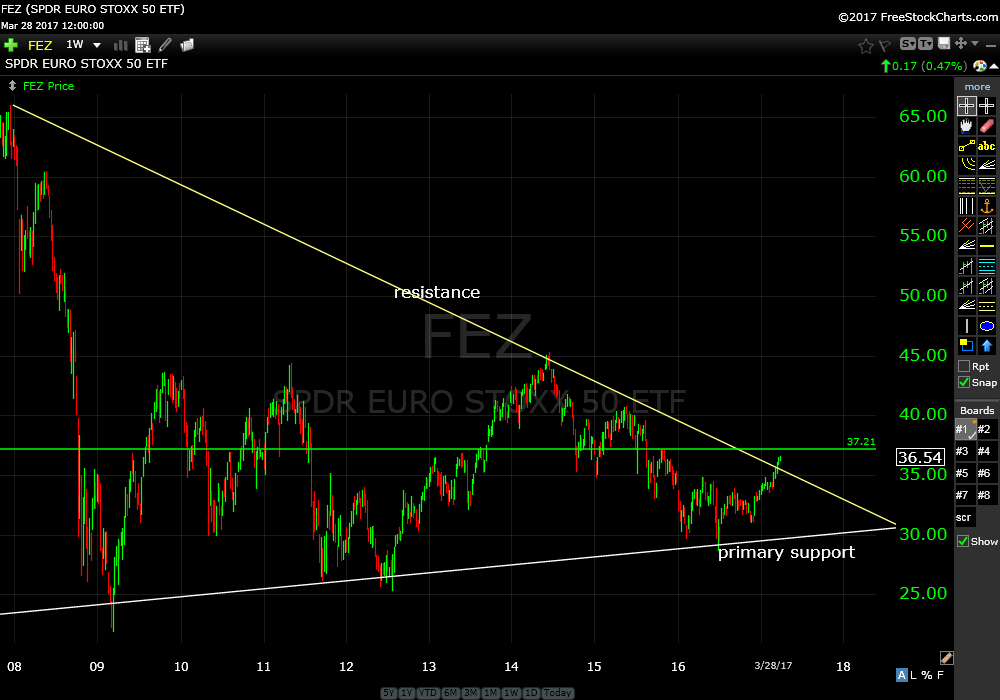
As I mentioned last week, the EU index has been performing well. Price cleared resistance, the yellow downwards sloping trend line. There is slight resistance at the green horizontal line. Price might get a stall there but likely to clear this zone. It’s going on the buy list for tomorrow as well. Risk is under the downwards sloping trend line for the near term.
Continue to hold all other open positions. Don’t trade on media garbage. Stay focused on price action. Stay focused on evidence based investing. Remain calm.
As always, if you have any questions just email me or give me a call. I will get back to you. Also, if you have any questions about a stock or ETF I would be happy to share my thoughts.
All the best to my subscribers on the Gold Coast who got slammed by Cyclone Debbie.
Trade Smart,
Don