Broader Market Review
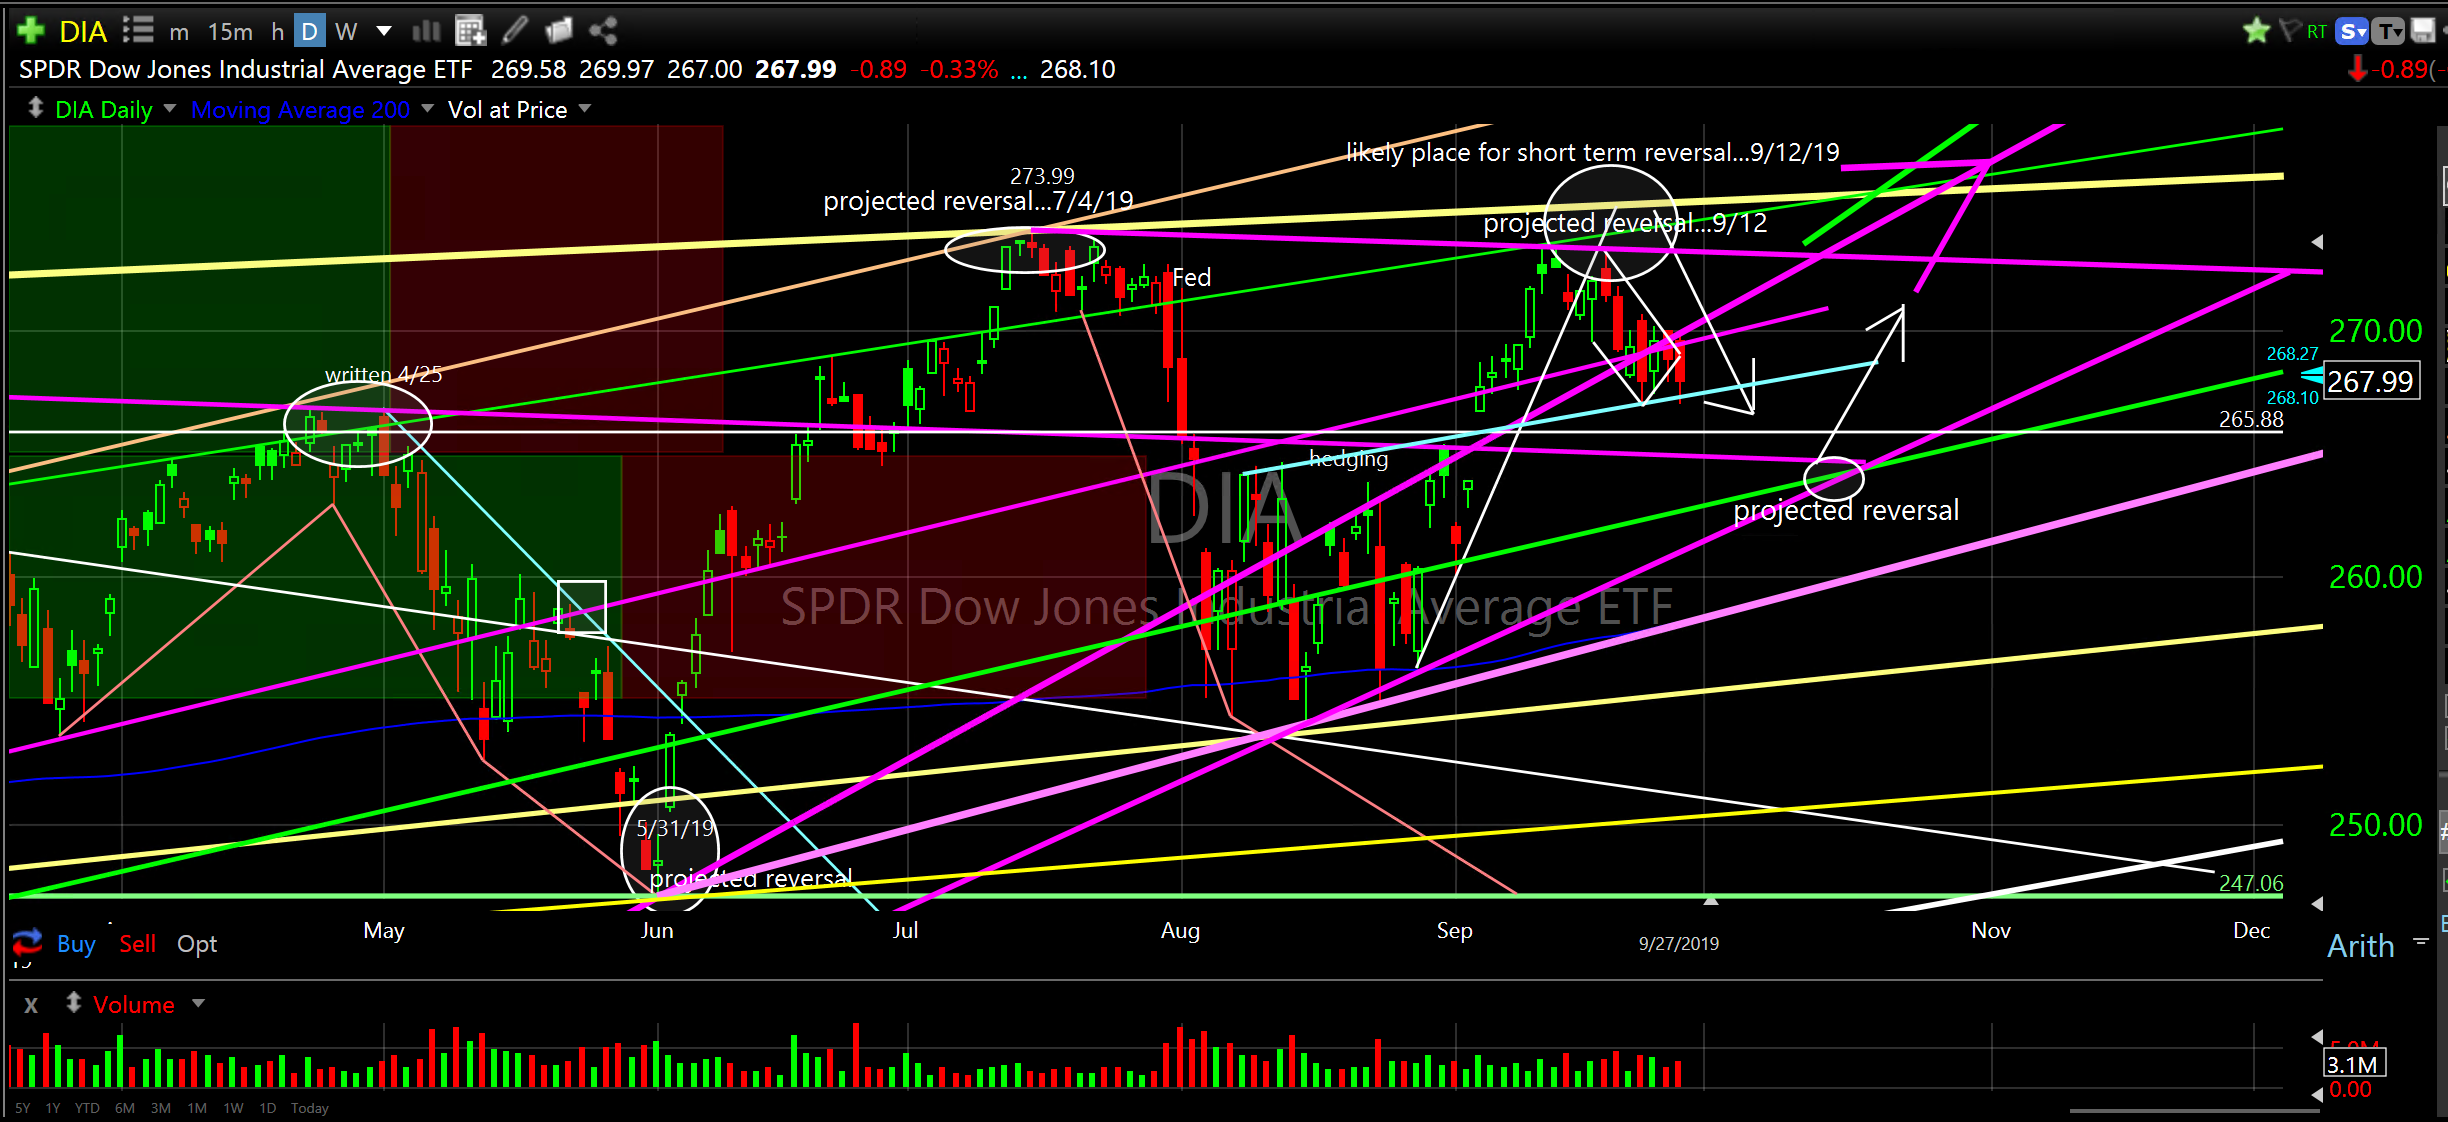
I think we are smack dab in the dip (reversal) I thought was likely to occur as I described a couple of weeks ago (see chart). Beginning with the reversal higher off the December 24, 2018 low the broader market has had six major reversals (see little circles on chart). I have been surprisingly spot on in identifying five of the six (before they occurred). Pretty good. Pretttty, prettttty, pretttttty good. thanks LD. To be honest, I’m always amazed how accurate charting can be. Trust me, it’s not so much me as it is the charting. Anyone can chart and anyone can see what I see, it just takes a little time to get the hang of it. What’s crazy is that there are so many people that still discount charting and price data analysis. Why is that?? I don’t get it. I will tell you right now that fundamental analysis can’t be this accurate. Price action always precedes fundamentals. Even after so many years I am gobsmacked daily by the glimpses into futureland charting can provide. Is it always accurate? Of course not, we are dealing with humans you know. yeah, I said gobsmacked. why not. it’s a funny word and I try and sneak it in there once every five years. good till 2024.
OK, so back to the current dip. While there are no guarantees on depth, I have drawn in the most likely support position where the reversal higher might occur. On the chart of DIA look for the intersection of the green and purple line with the circle. This projected reversal is approximately October 15th at DIA 264. There is room for price to get down lower than this to the ascending pink line but I don’t think it needs to go that low. If it does, the sling higher will likely have even more thrust. So, short term my price projections are a bit lower (the white arrows) and intermediate term (6-12 months) my projection is much higher (the purple arrow).
My 2020 outlook remains unchanged; I am very bullish. The broader market has been pushing up against ascending resistance for almost two years and every time it pushes just a little higher it just gets hammered. Volatility has been “off the charts” for almost two years with the crescendo low on December 24th, 2018 and subsequent slingshot higher into May with repeated attempts at breaking the overhead ceiling and releasing higher. Price just keeps banging and banging up there and when it finally releases it’s going to be like opening a big bubbly corked bottle of 2009 Dom Perignon; Look out above! Don’t break the lights!
When this happens it will coincide with many individual stocks positioning themselves stretched down into support coiled to spring higher up and through their own resistance levels. Boing is the technical term.hehe. Other broader market charts are similar to the DIA chart below. To view those charts just go to “Search” on website. This will pick up all charting in updates by symbol.
SPDR Dow Jones Industrial Average ETF (DIA) daily
Recently Highlighted Chart Review
The following charts are updated if price action has deviated from projections.
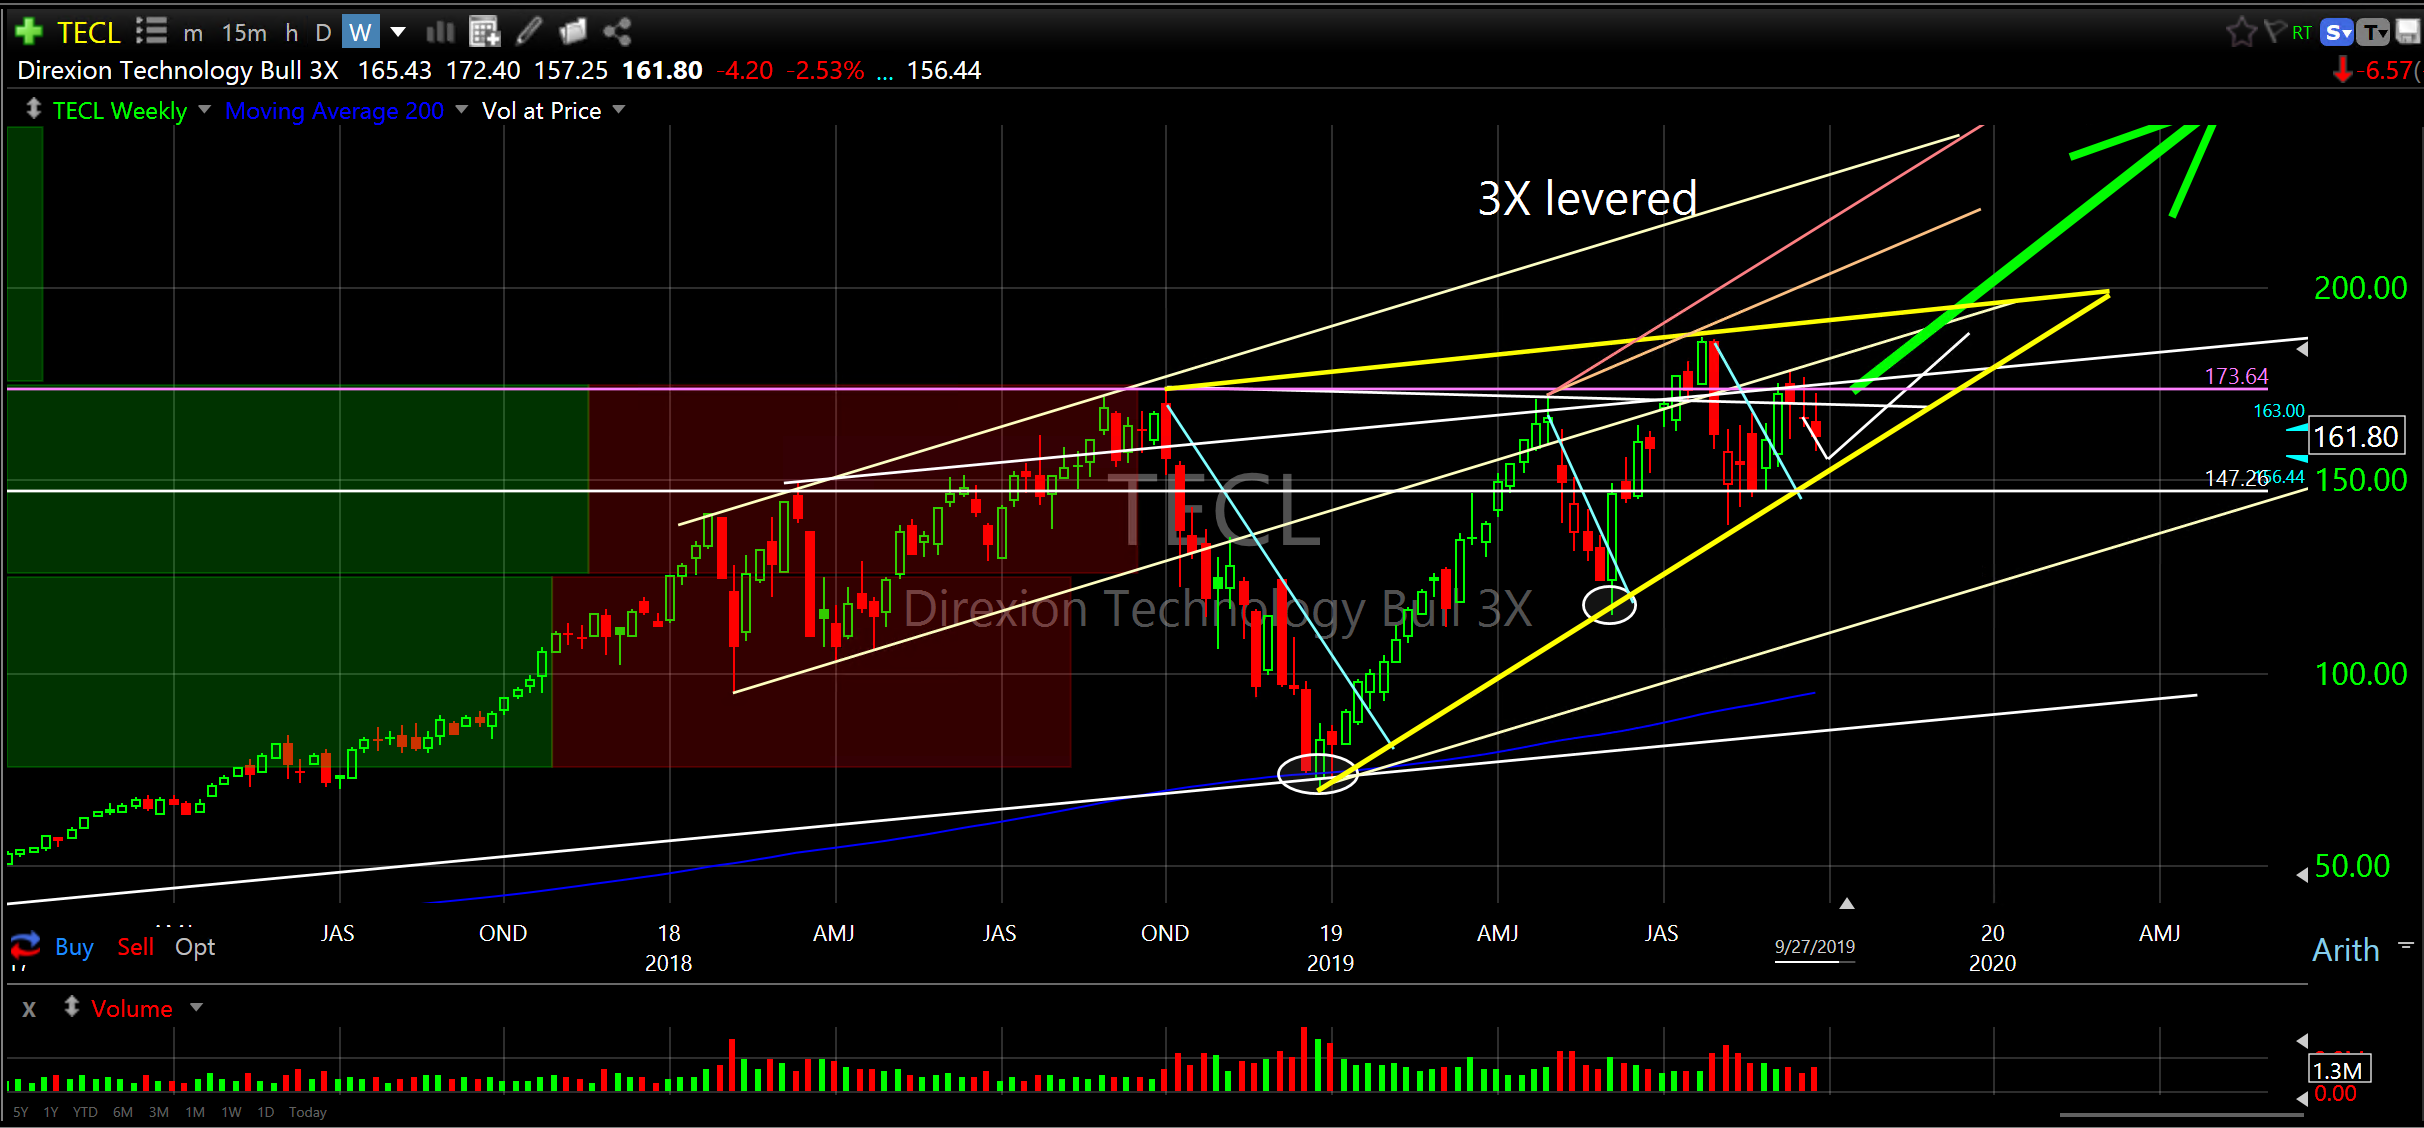
Direxion Technology Bull 3X (TECL) weekly
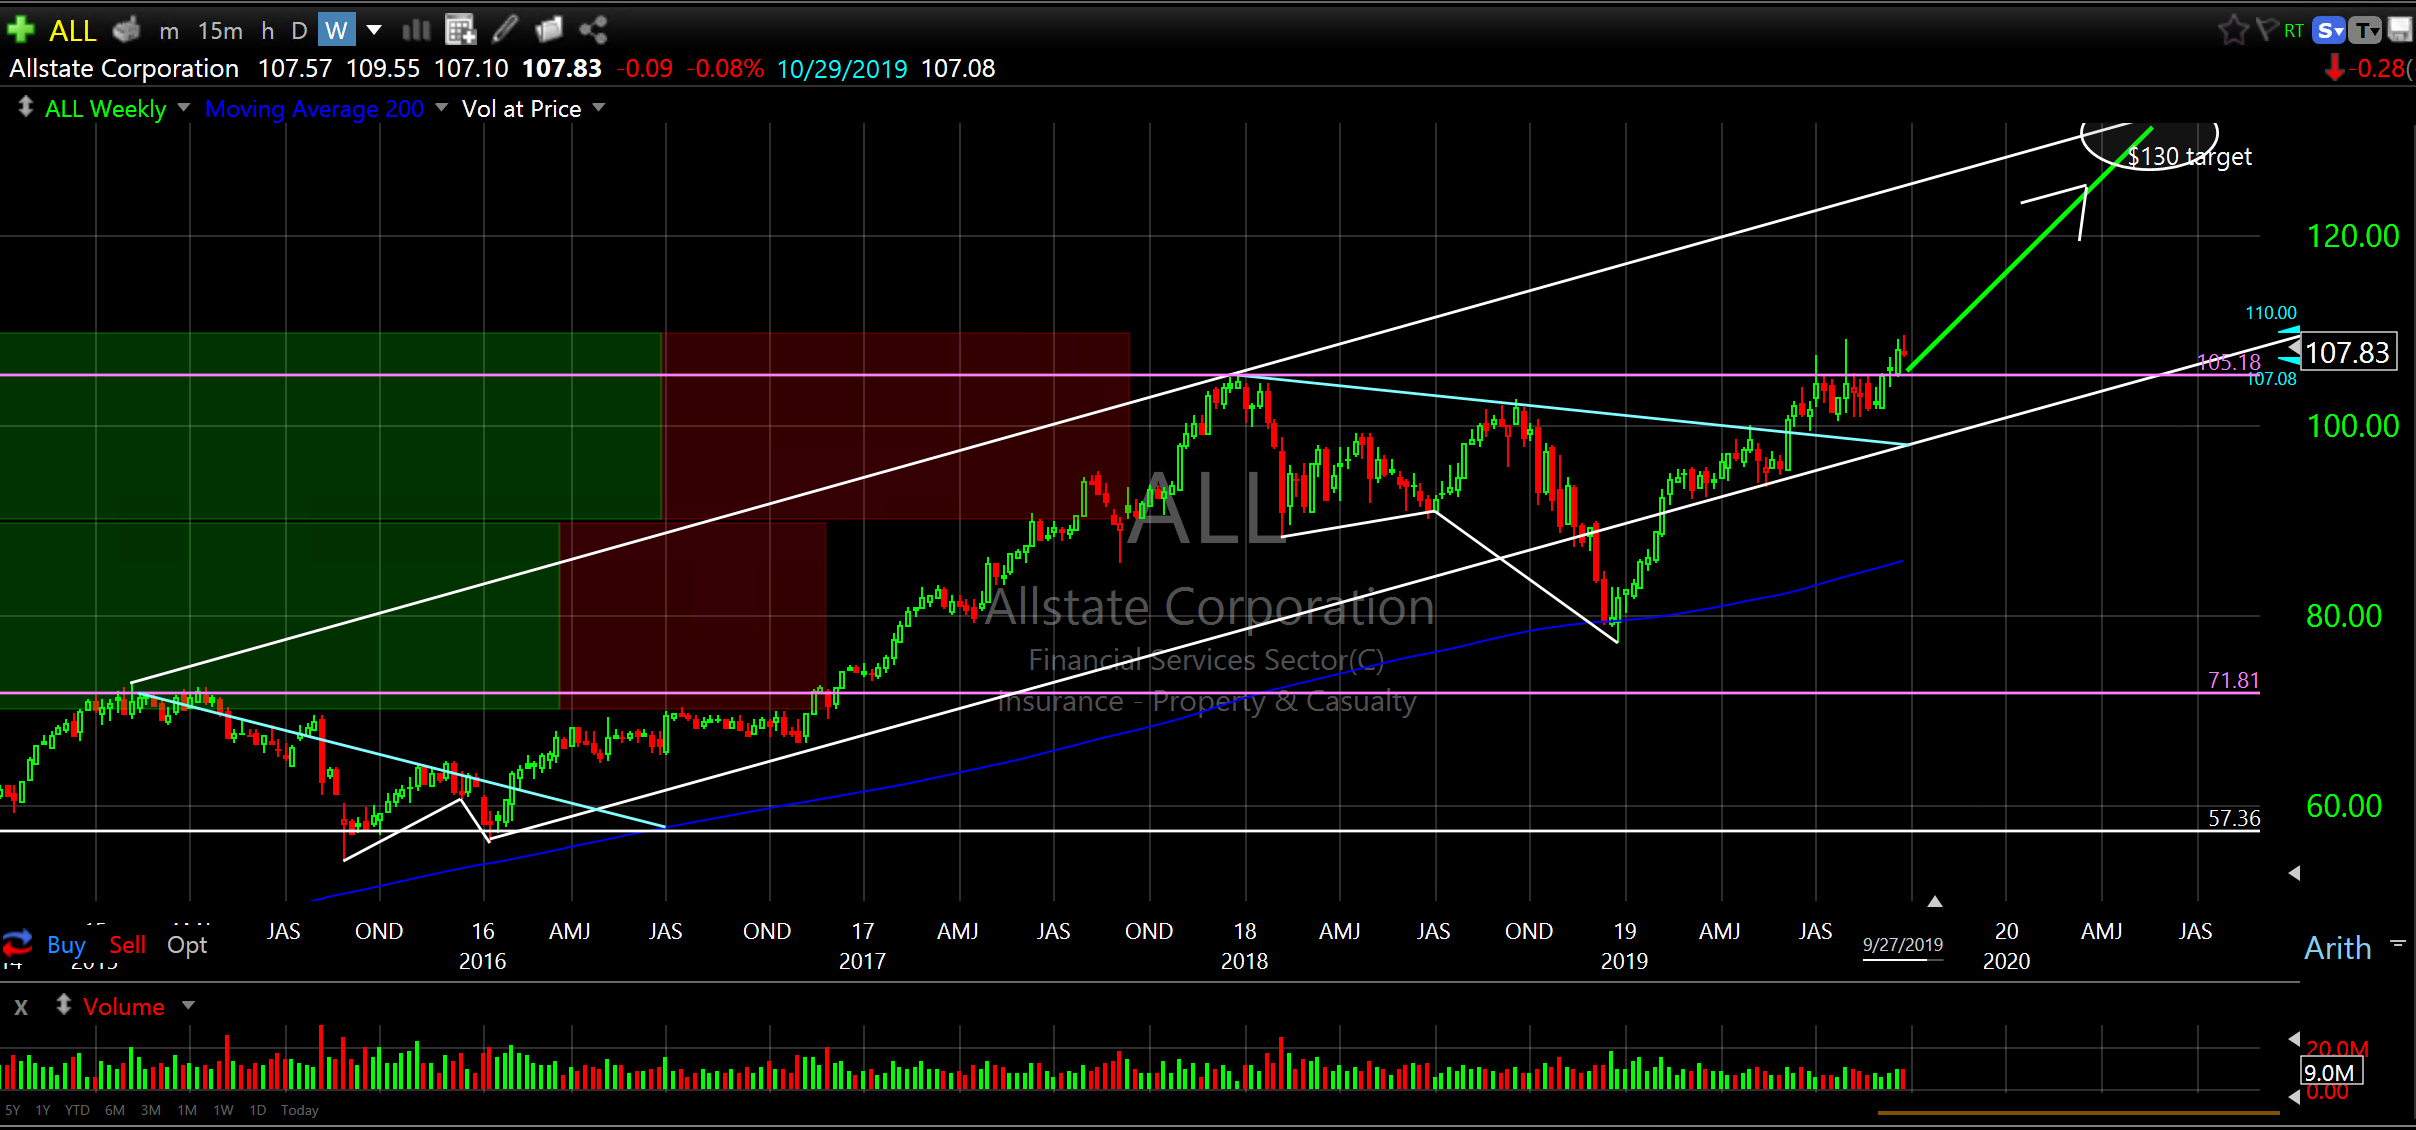
Allstate Corporation (ALL) weekly
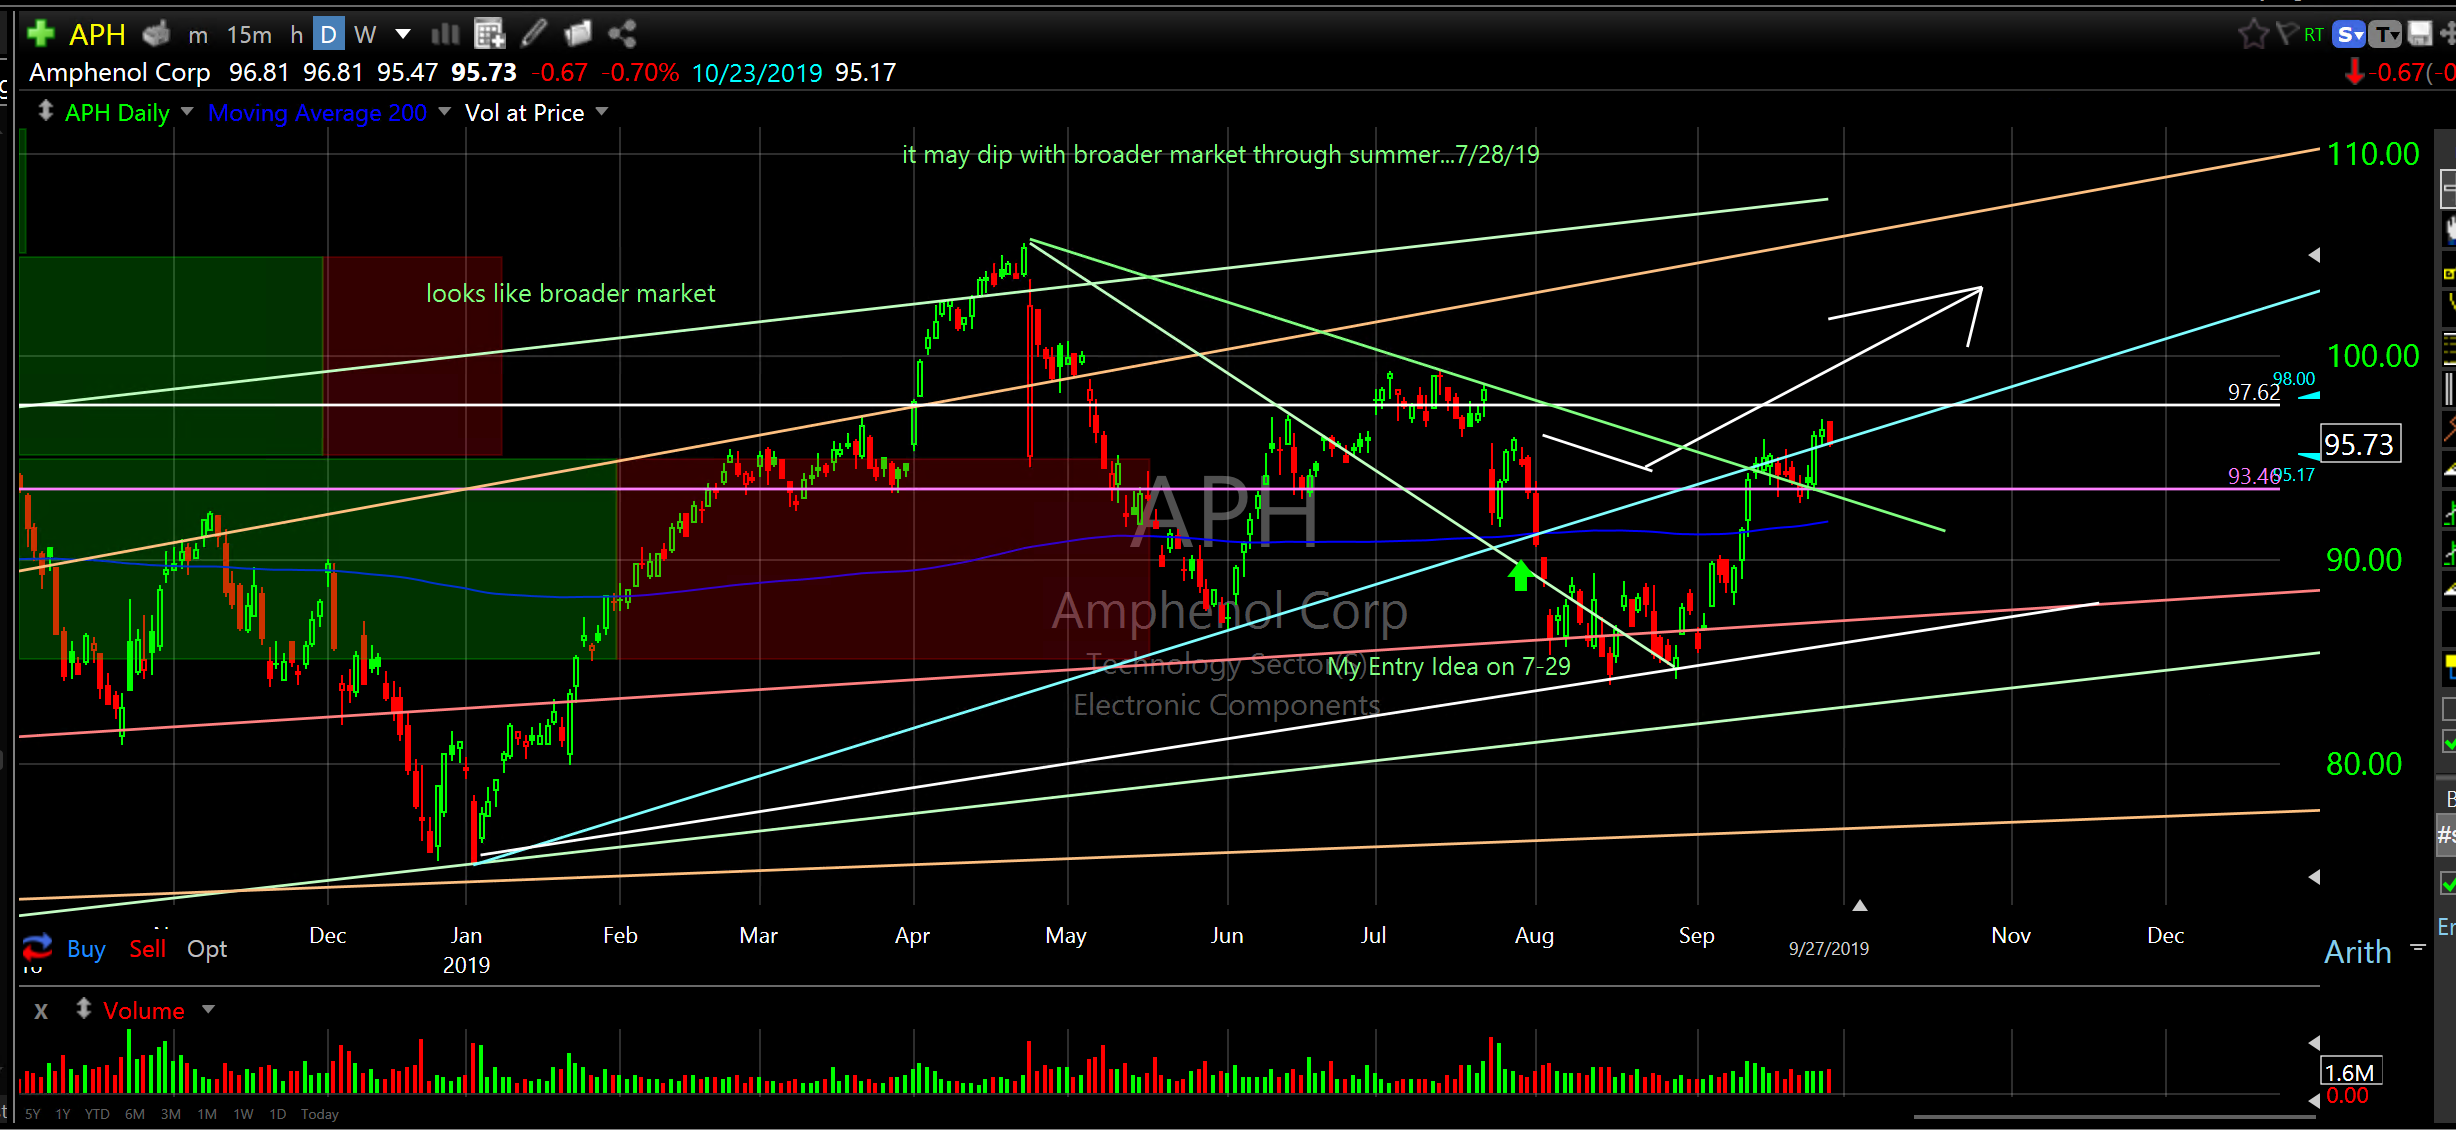
Amphenol Corp (APH) daily
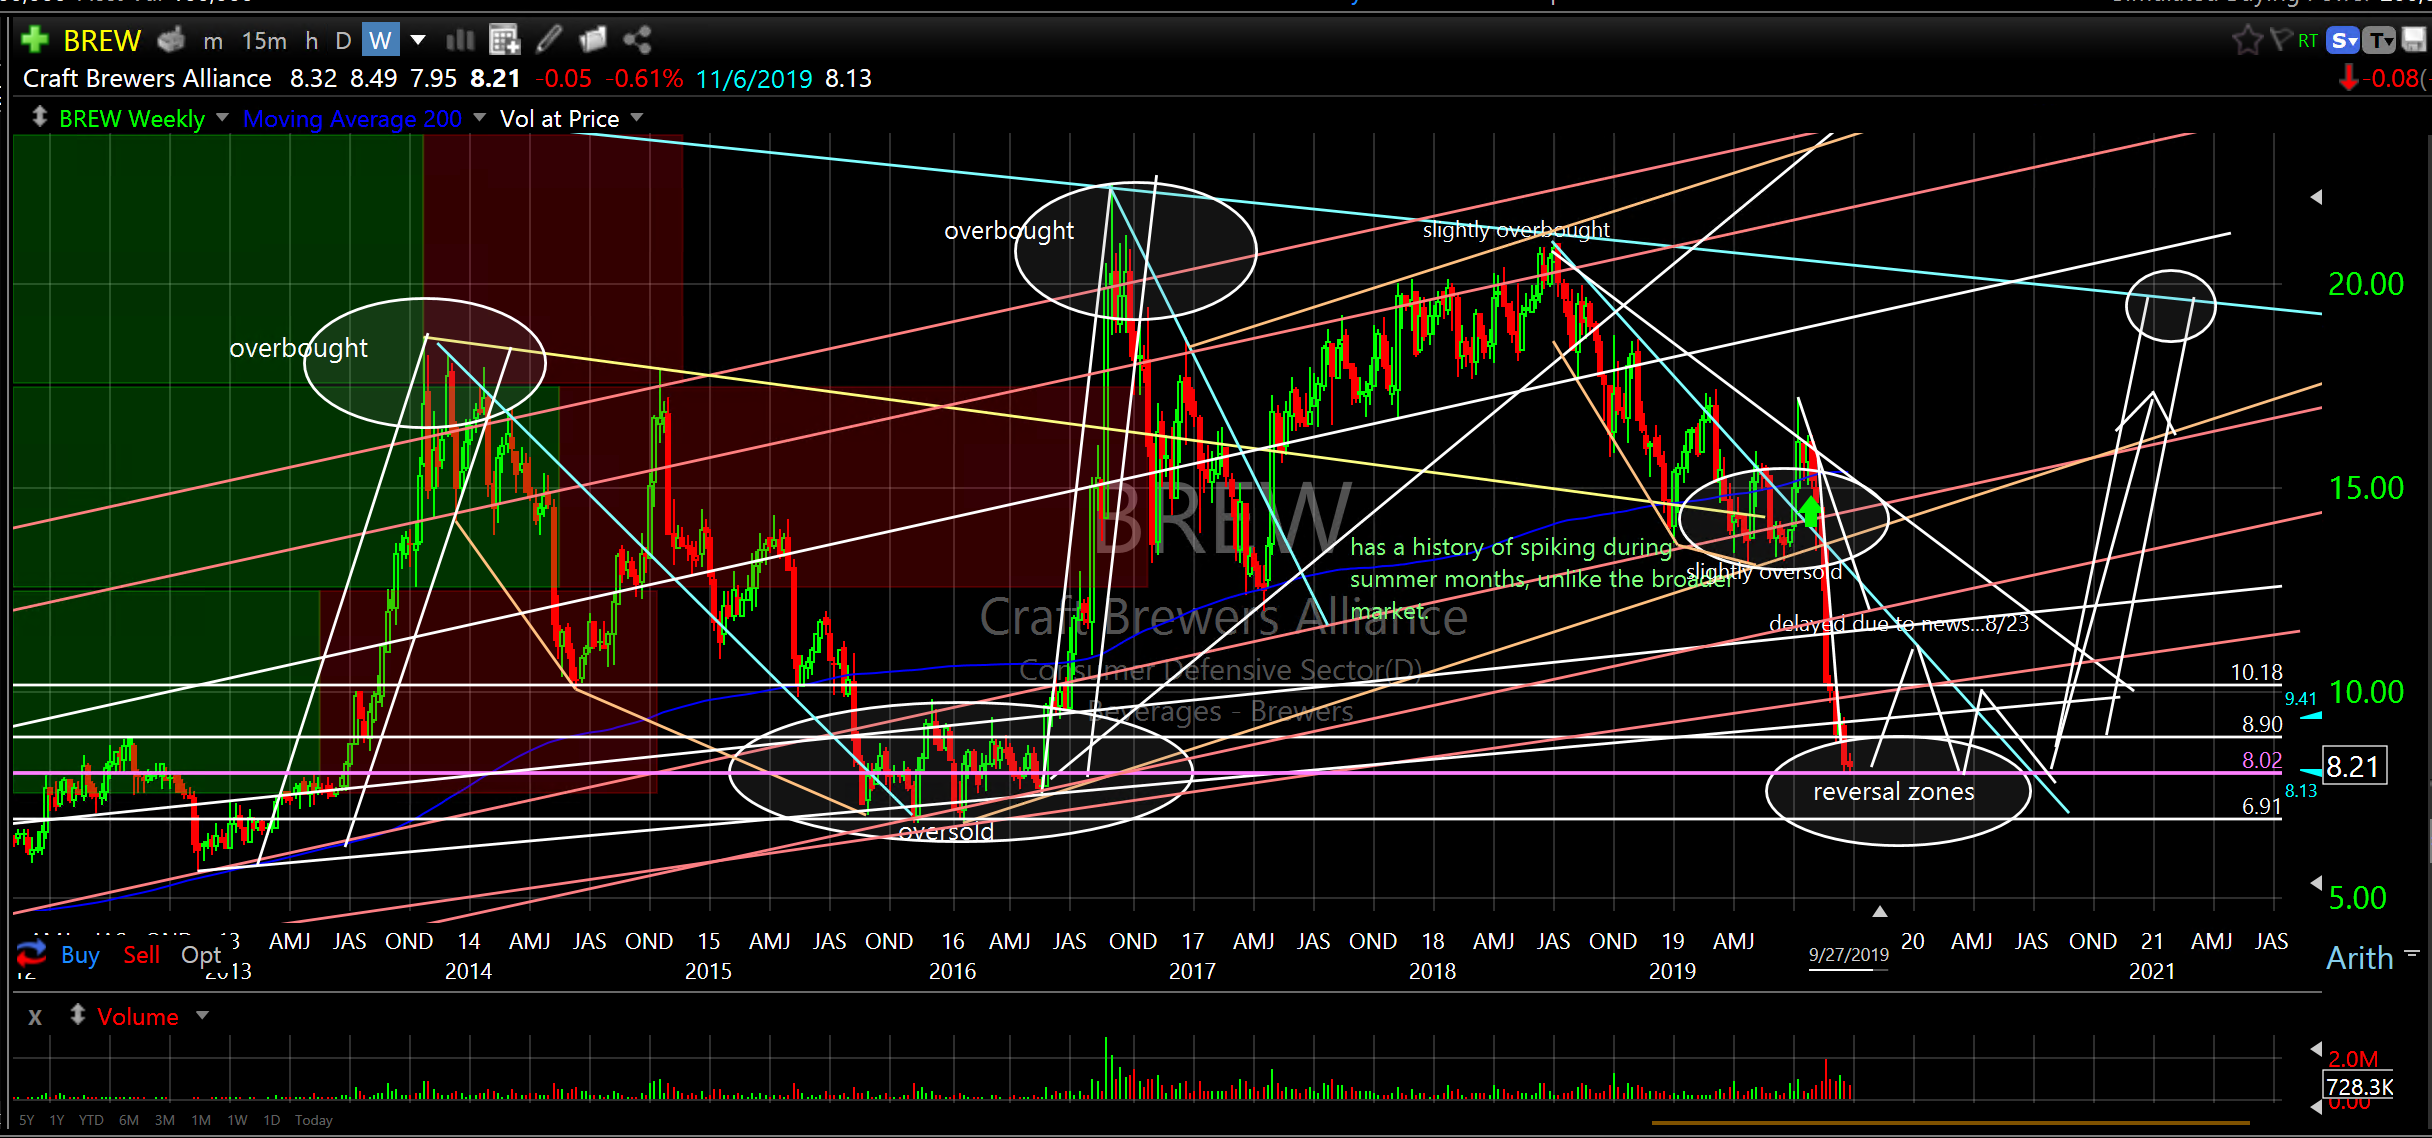
Craft Brewers Alliance (BREW) weekly
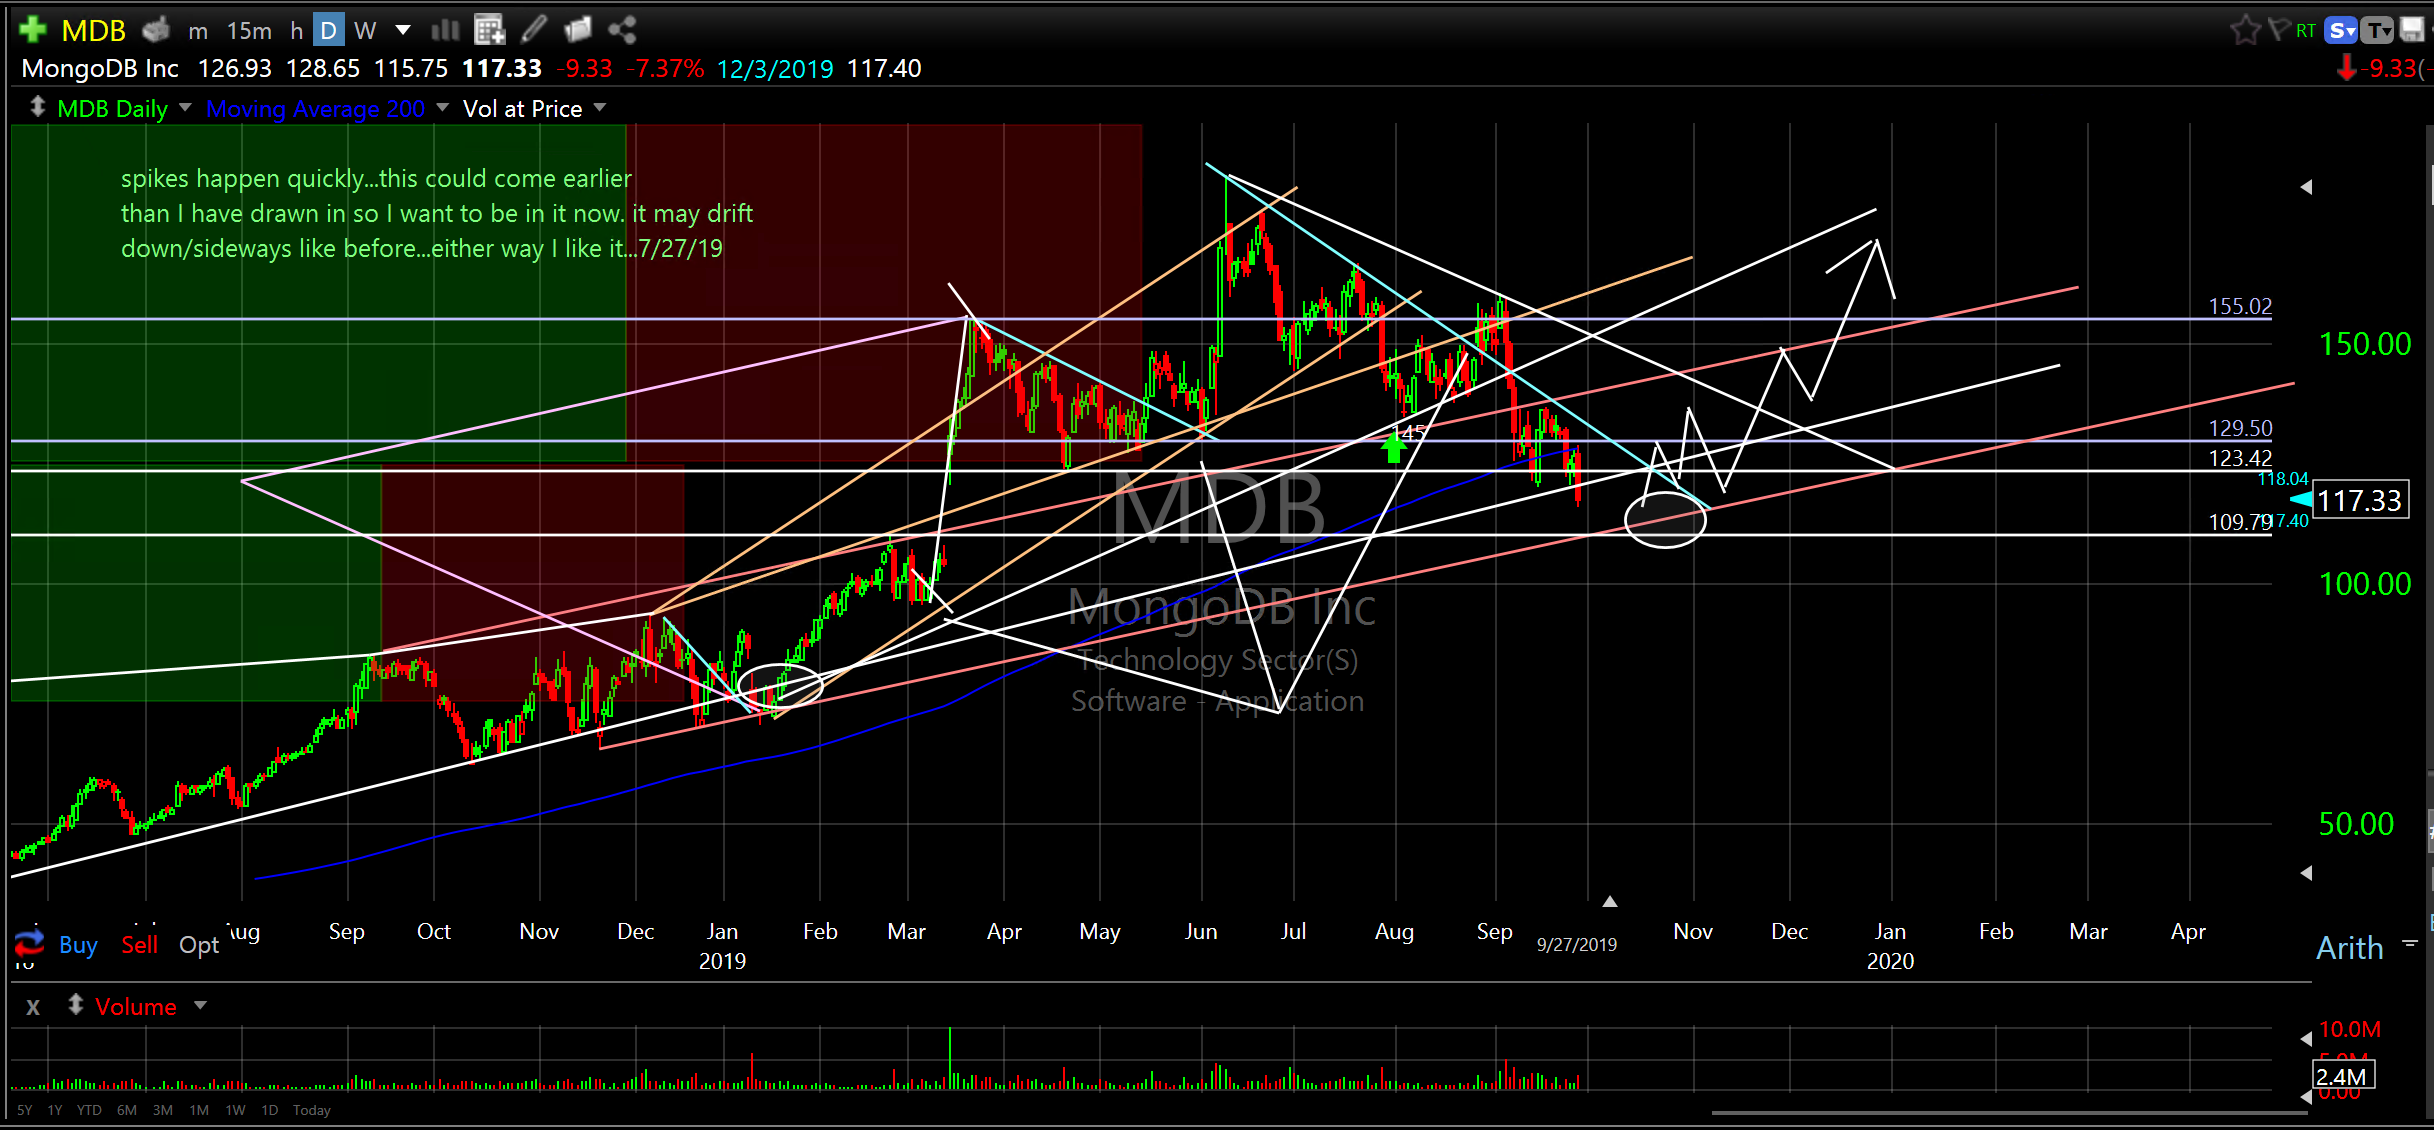
MongoDB Inc (MDB) daily
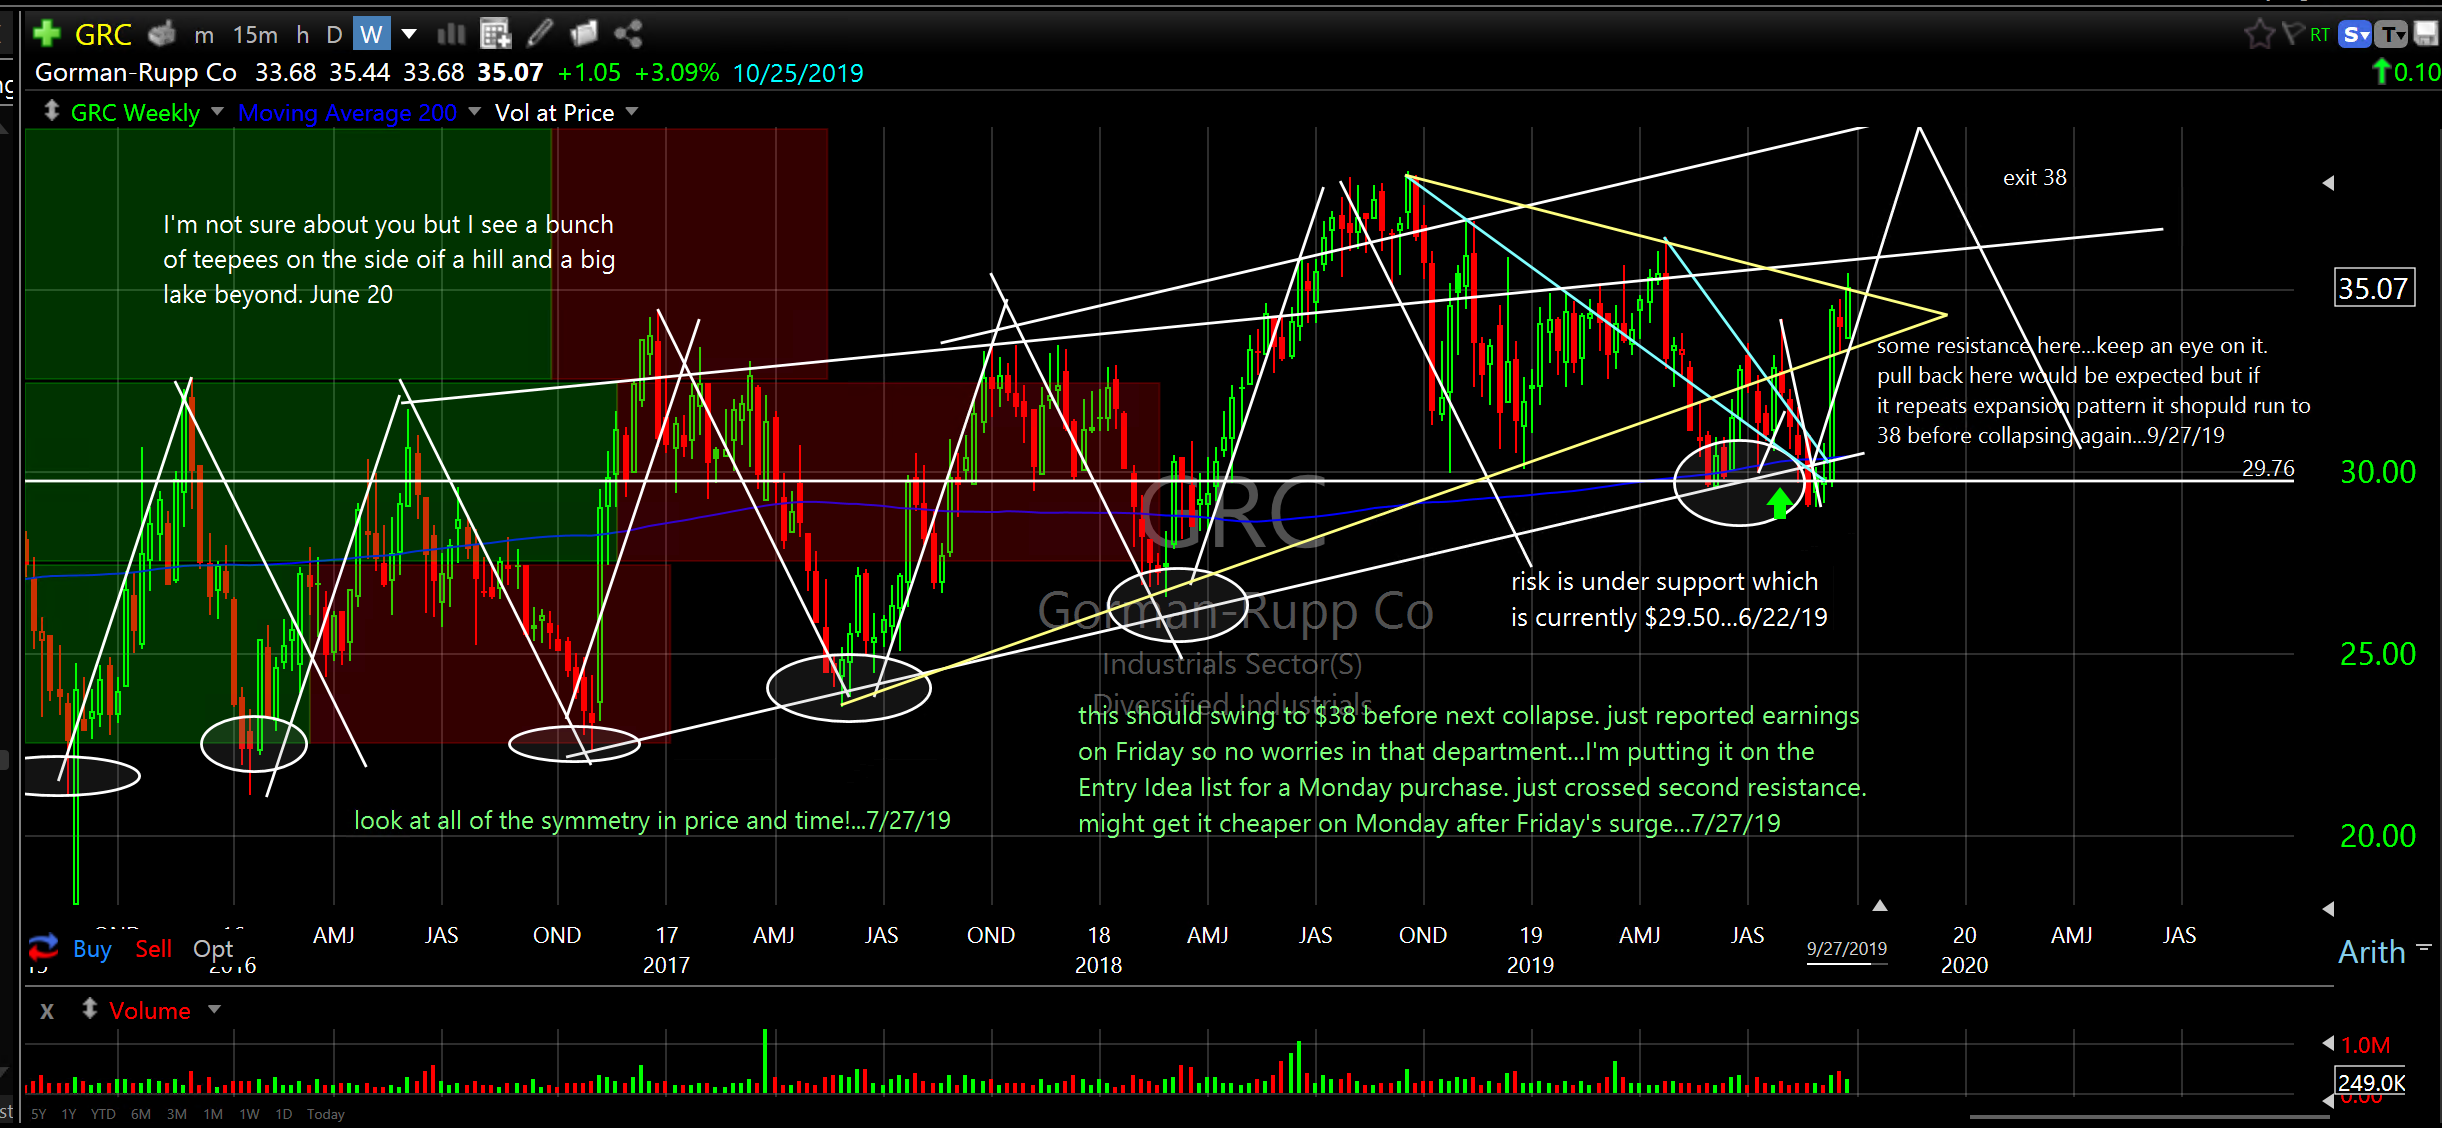
Gorman-Rupp Co (GRC) weekly
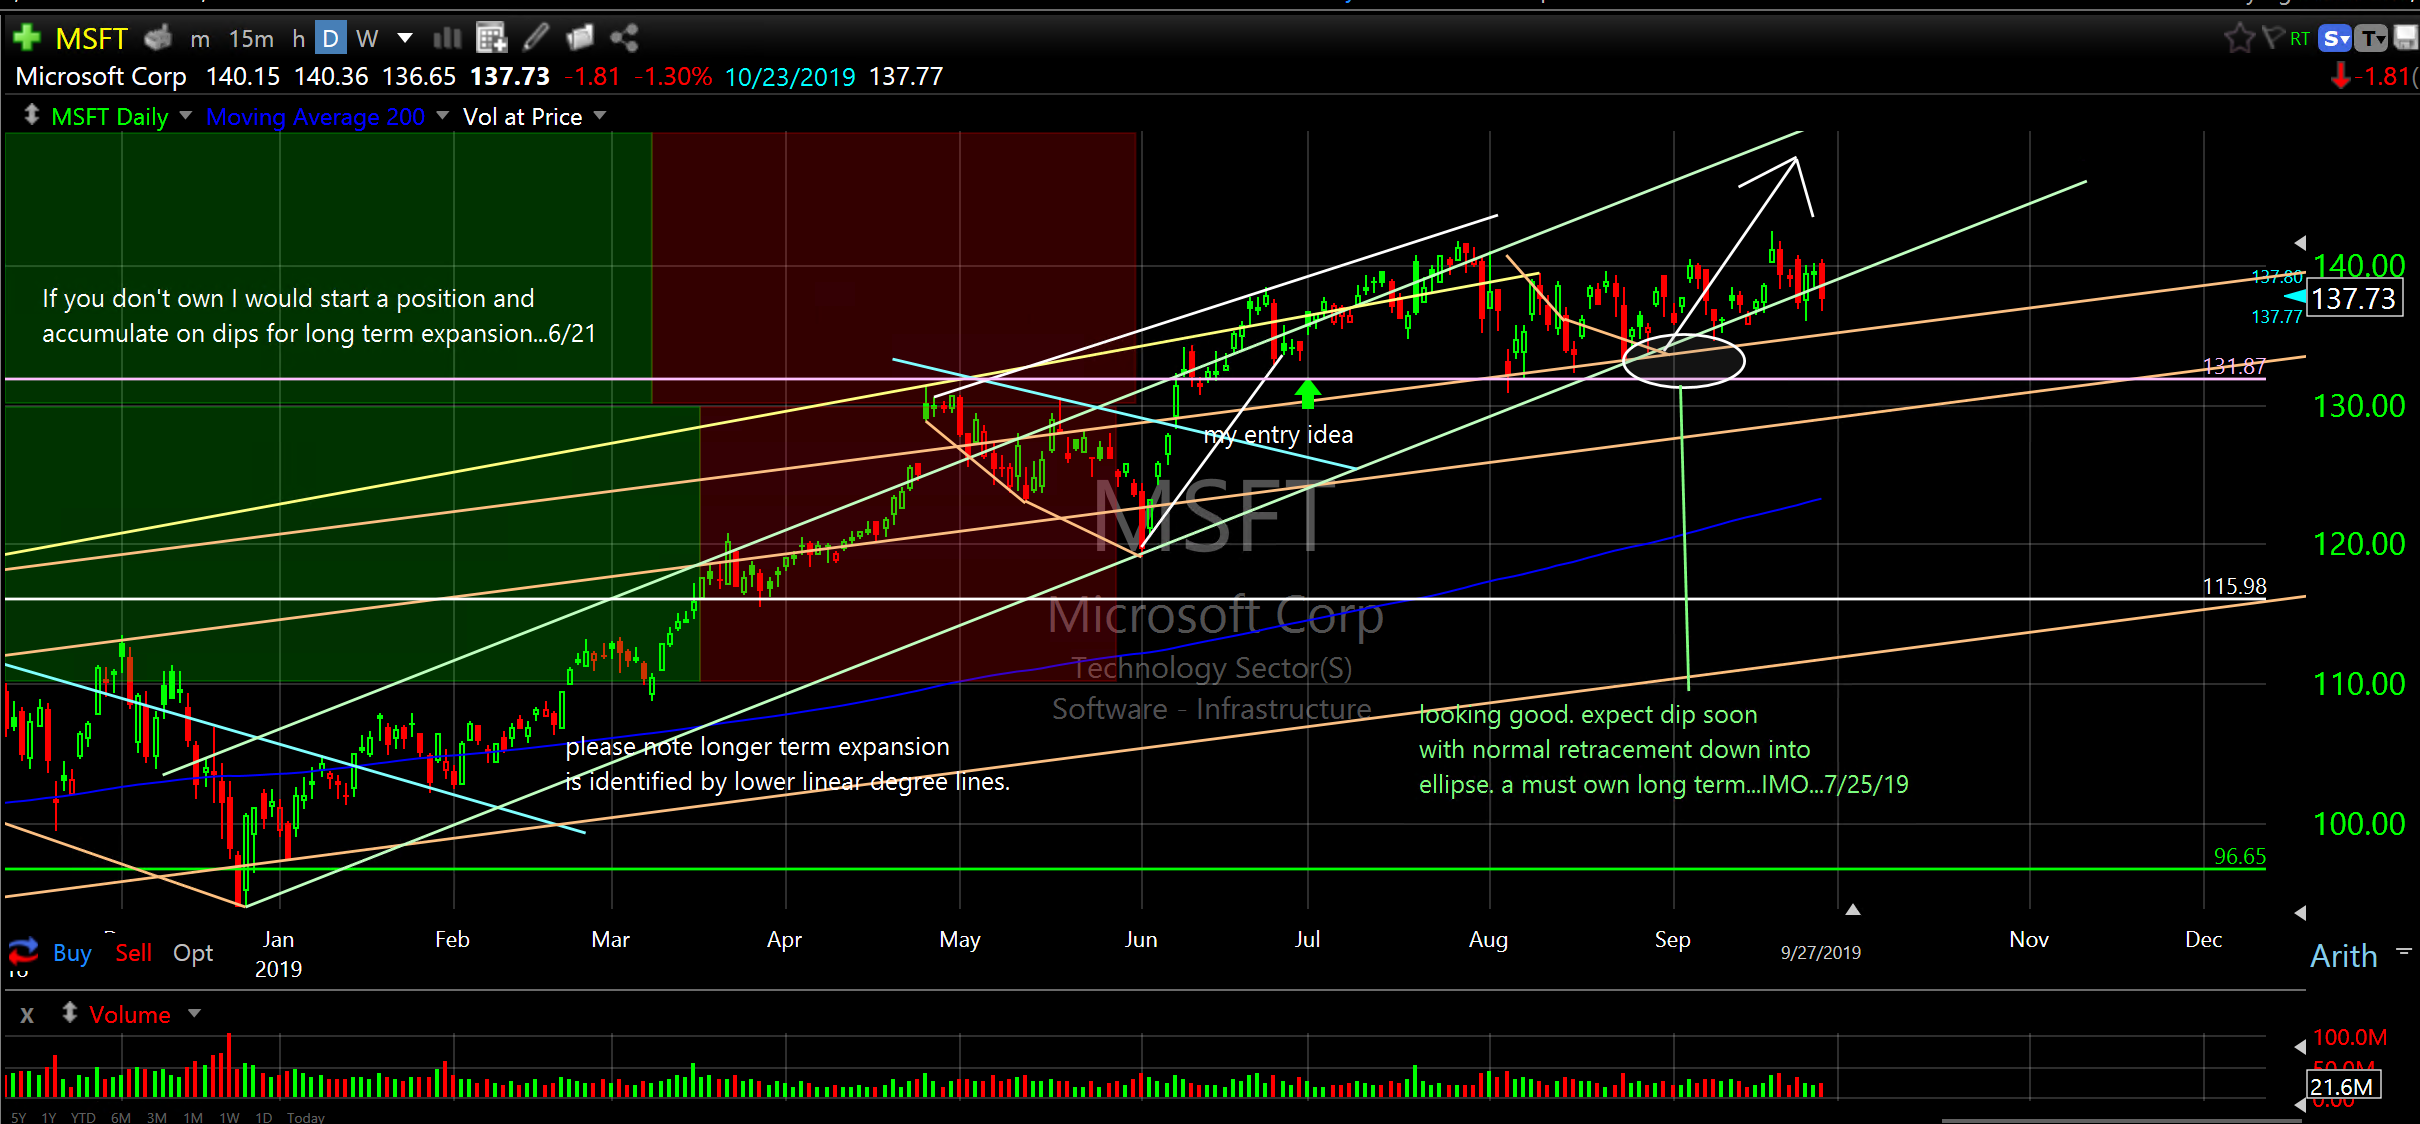
Microsoft Corp (MSFT) daily
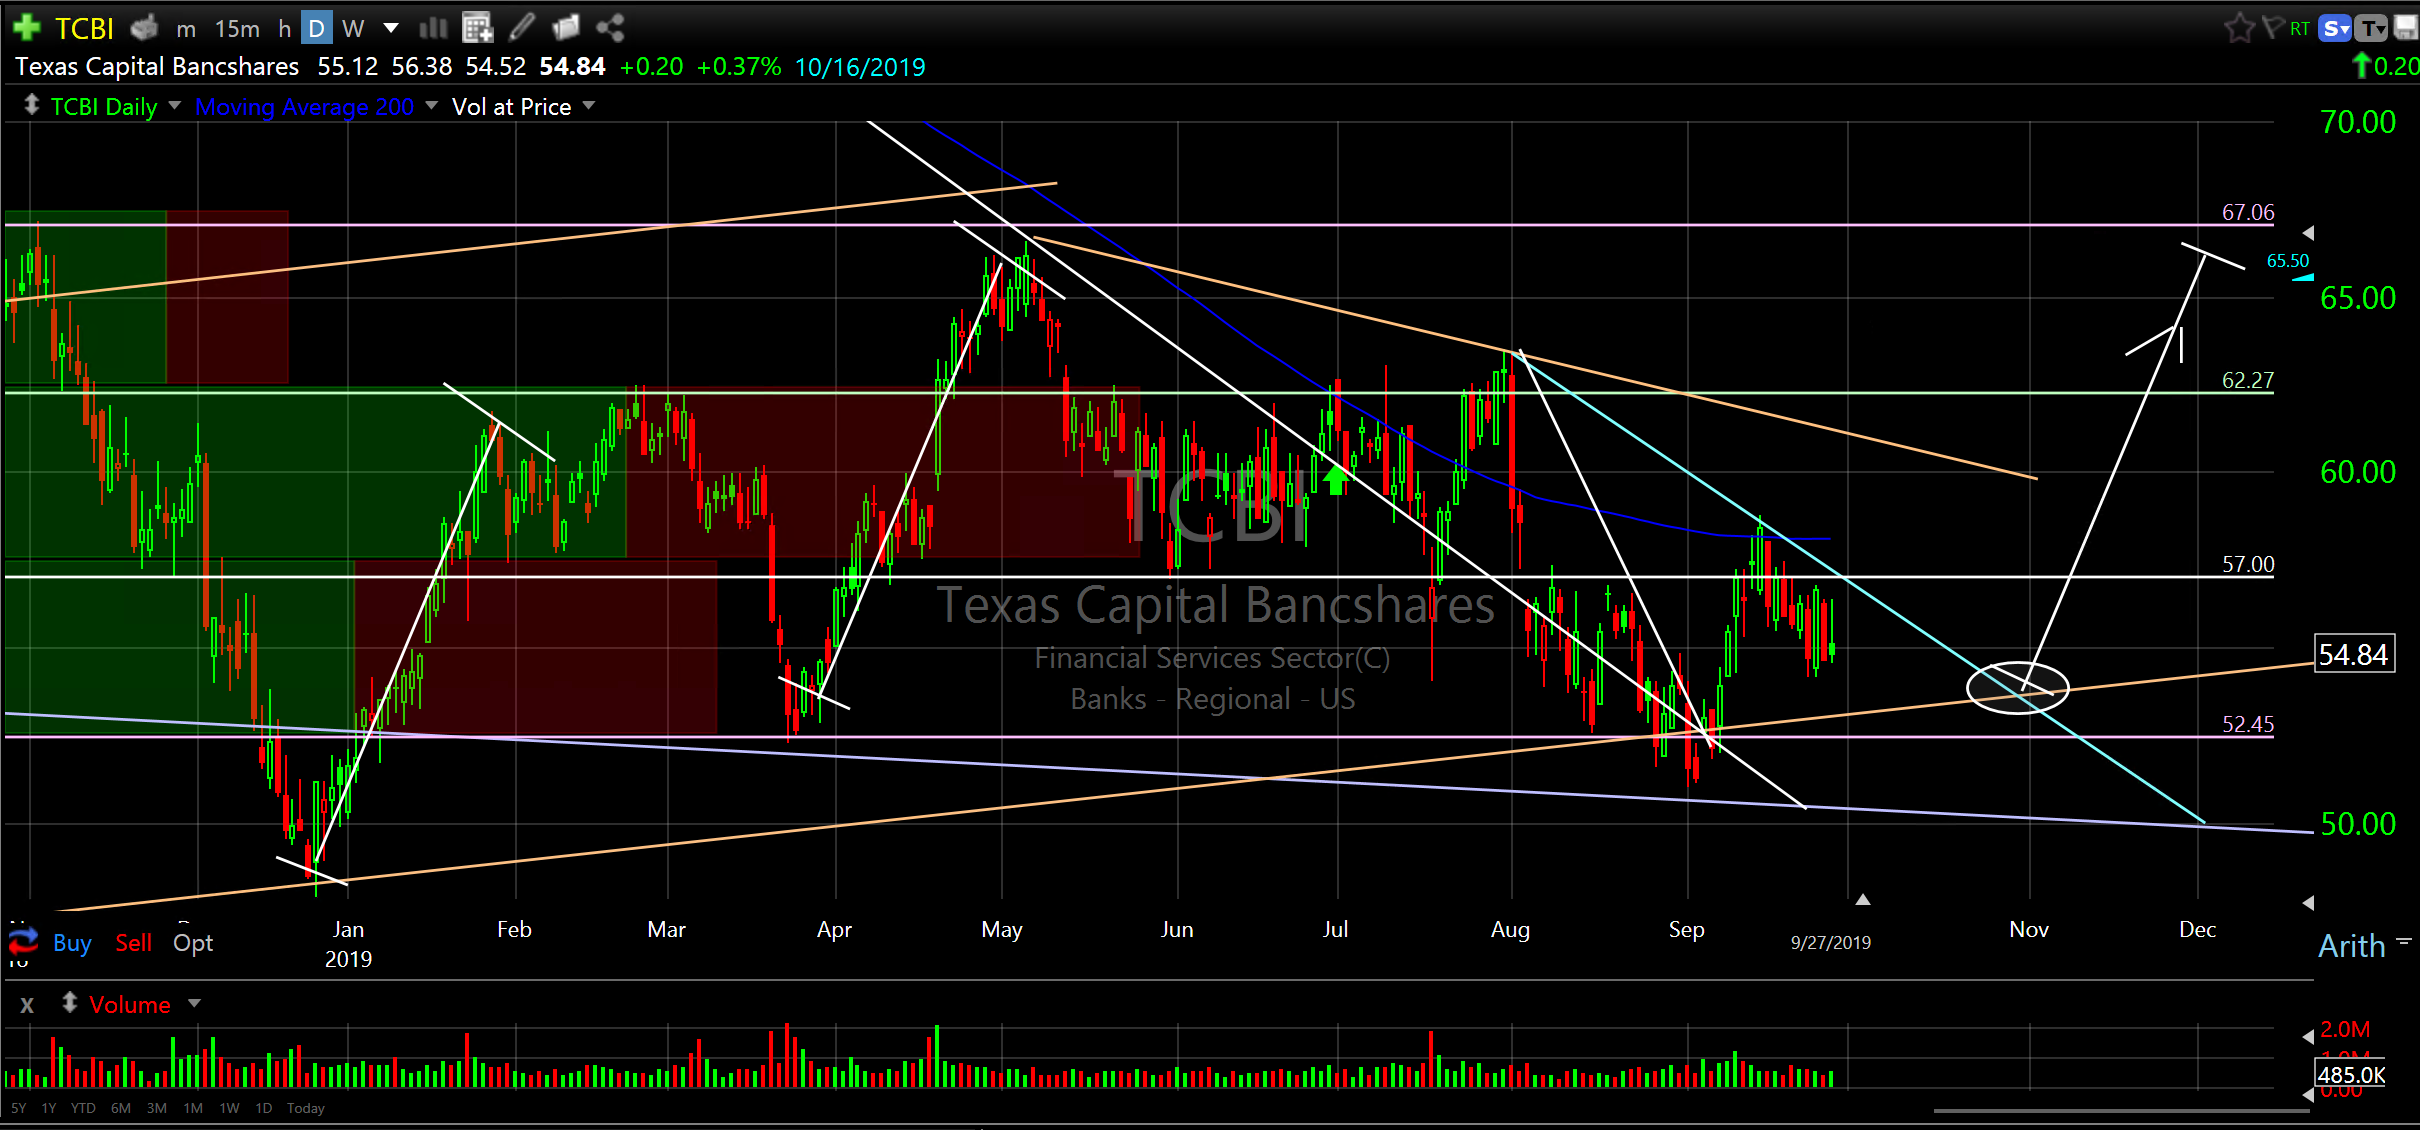
Texas Capital Bancshares (TCBI) daily
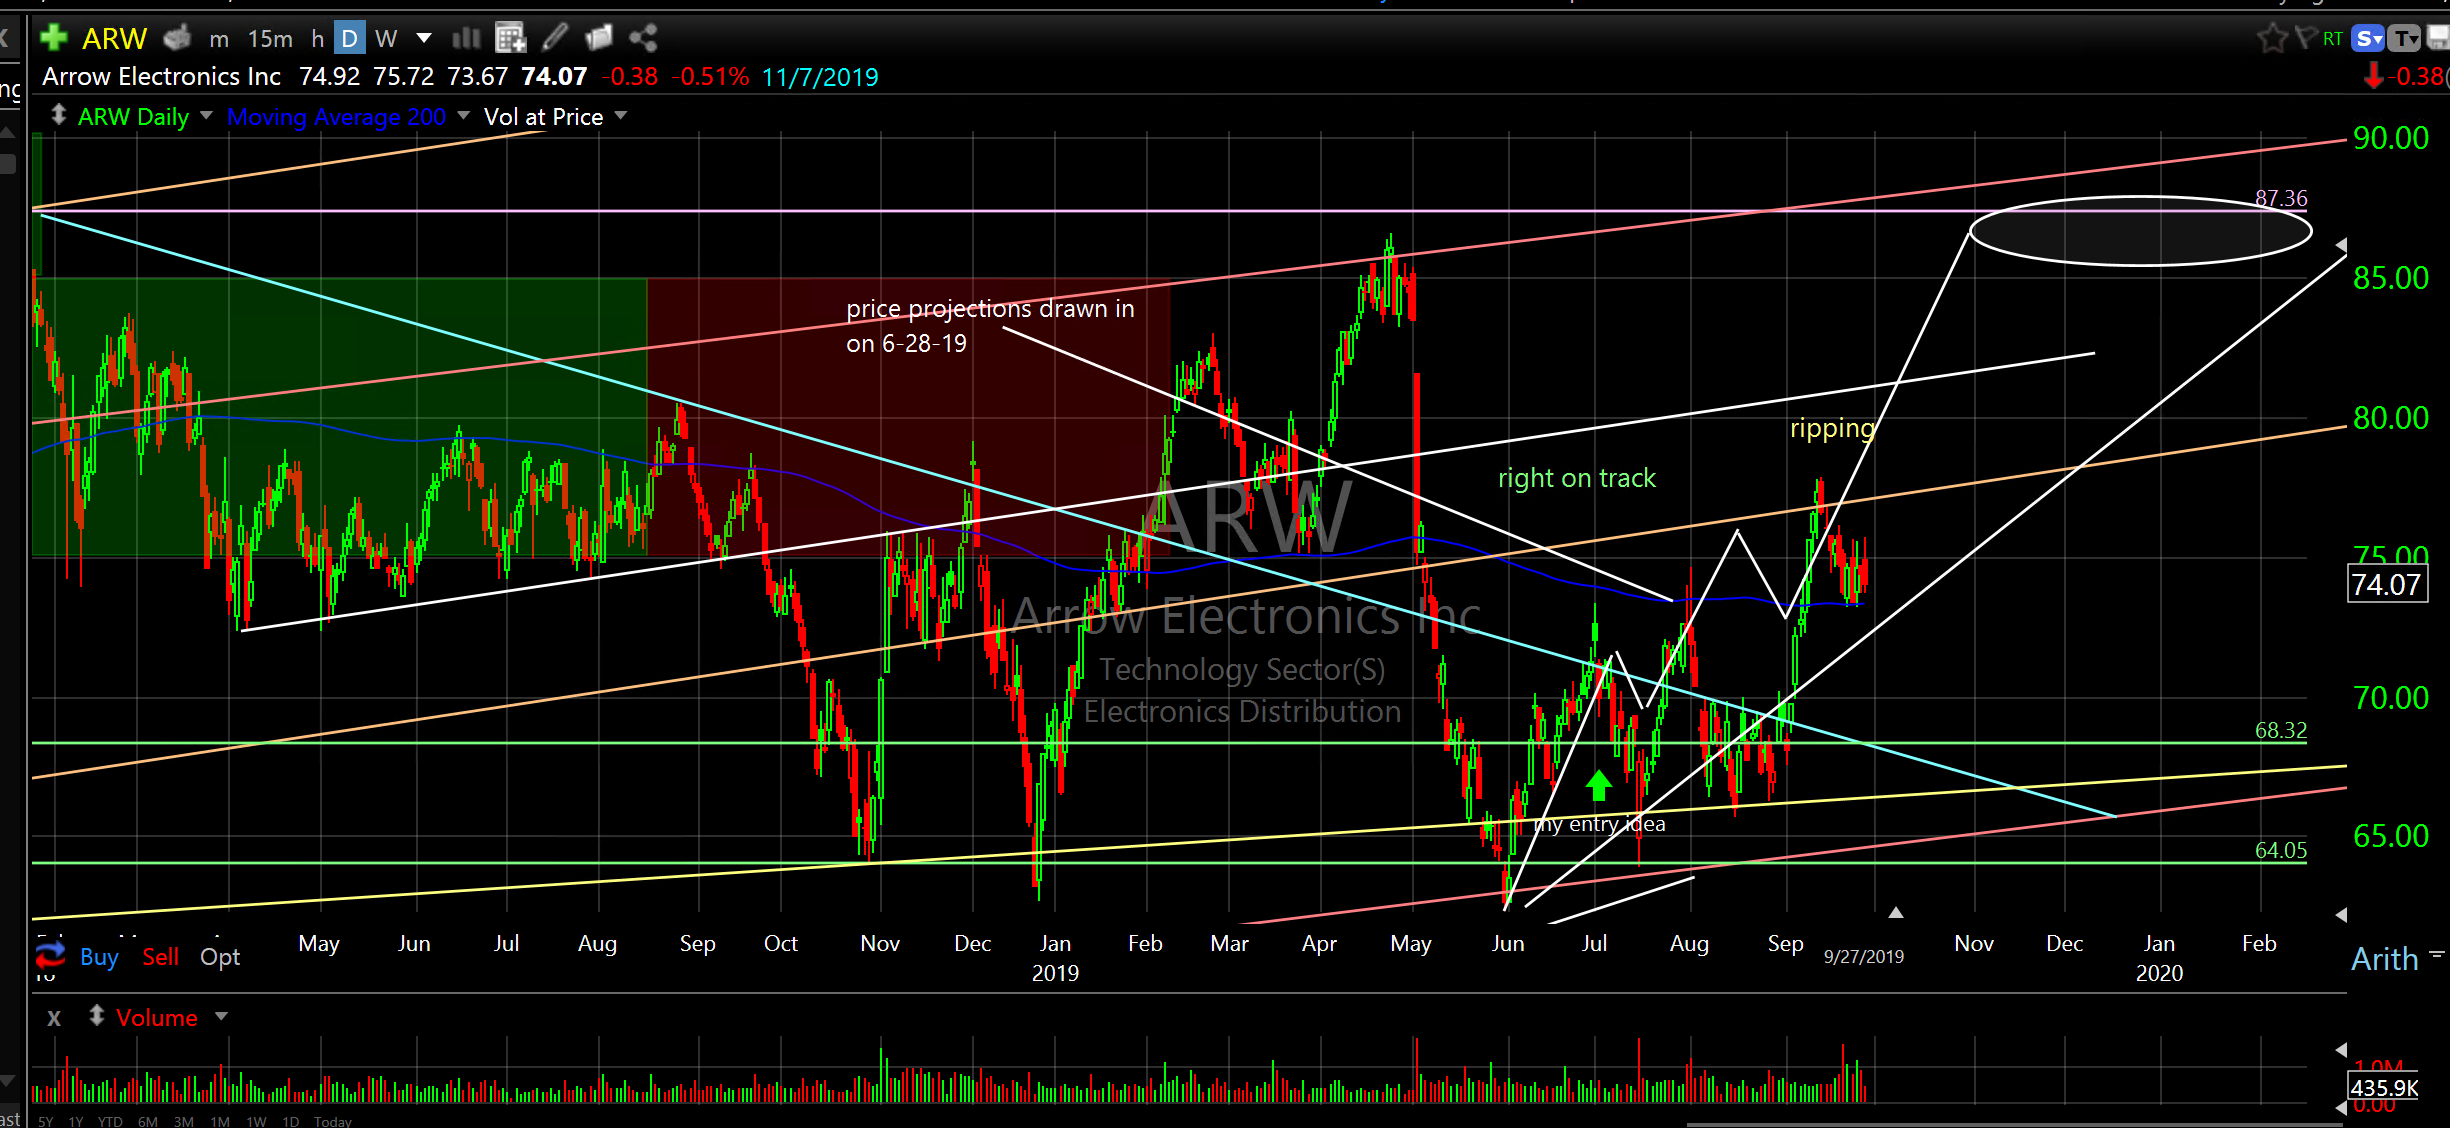
Arrow Electronics Inc (ARW) daily
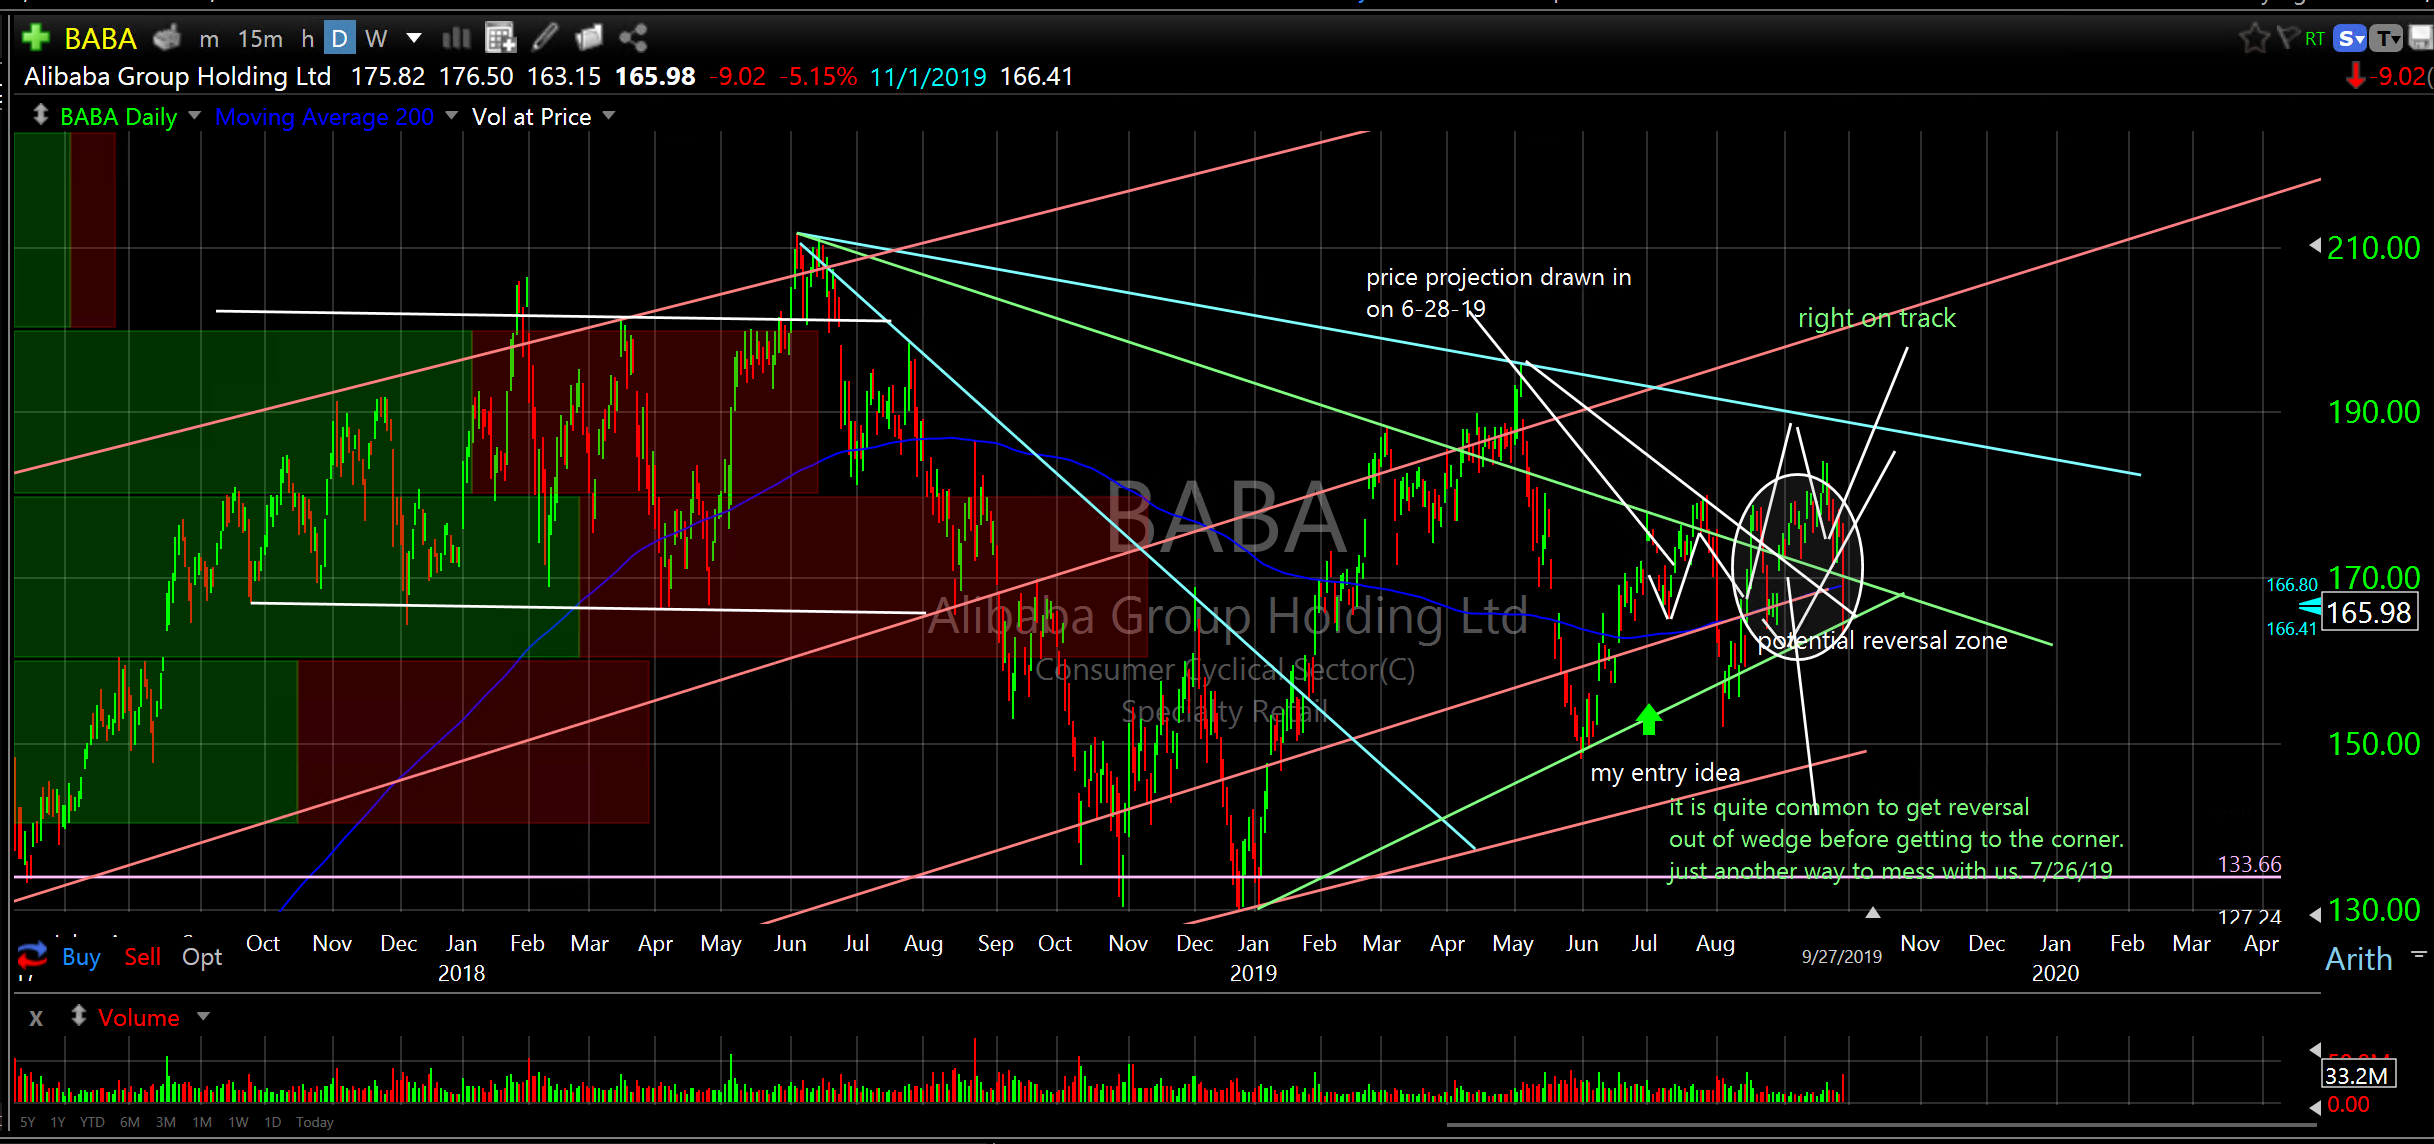
Alibaba Group Holding Ltd (BABA) daily
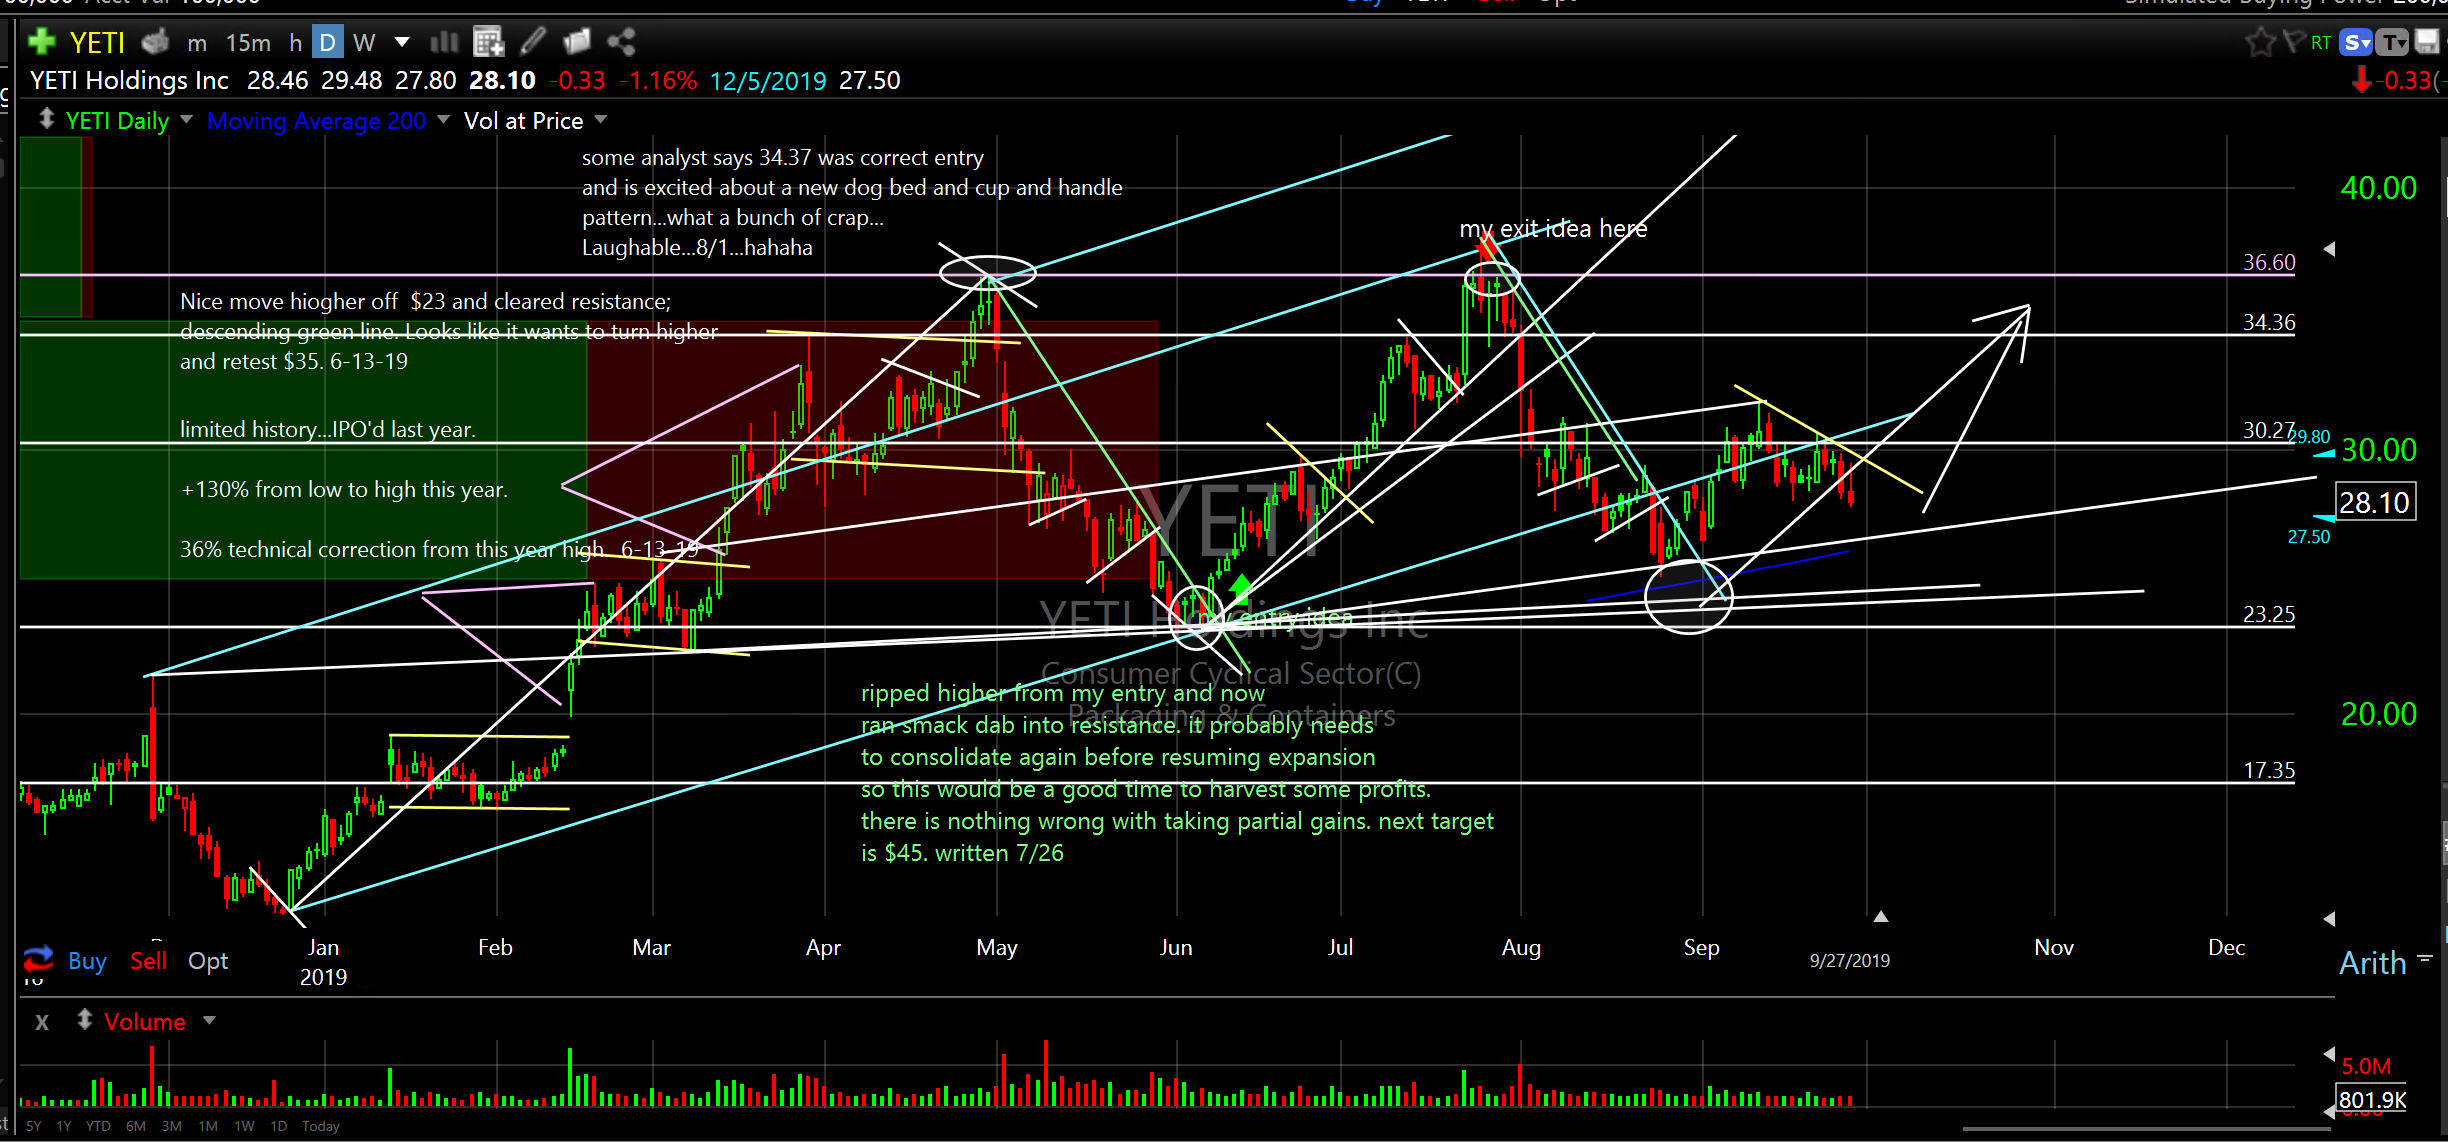
YETI Holdings Inc (YETI) daily
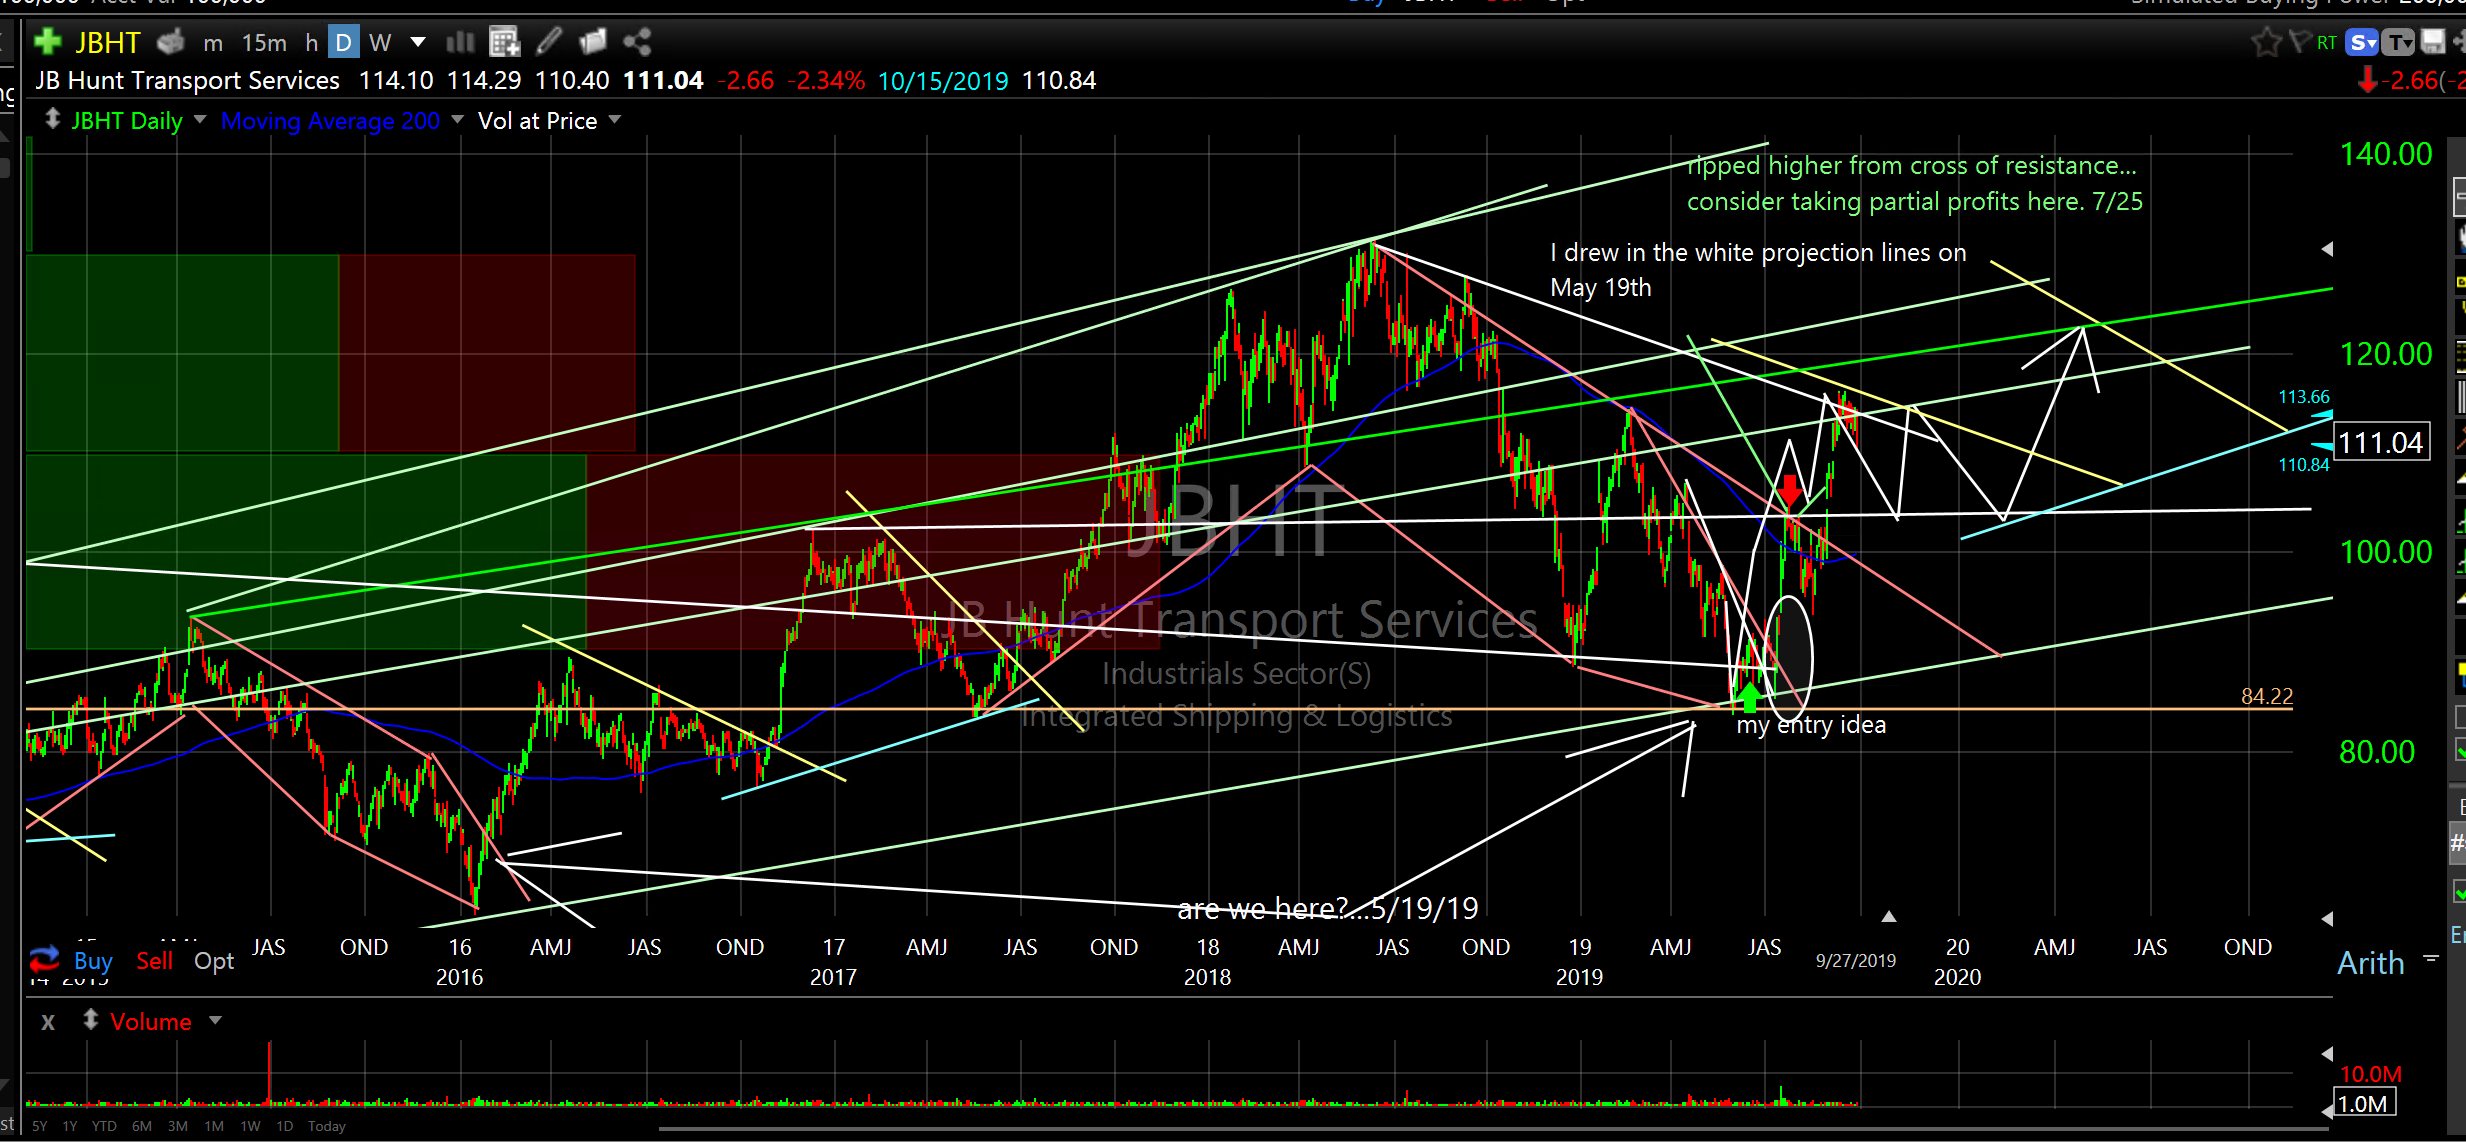
JB Hunt Transport Services (JBHT) daily
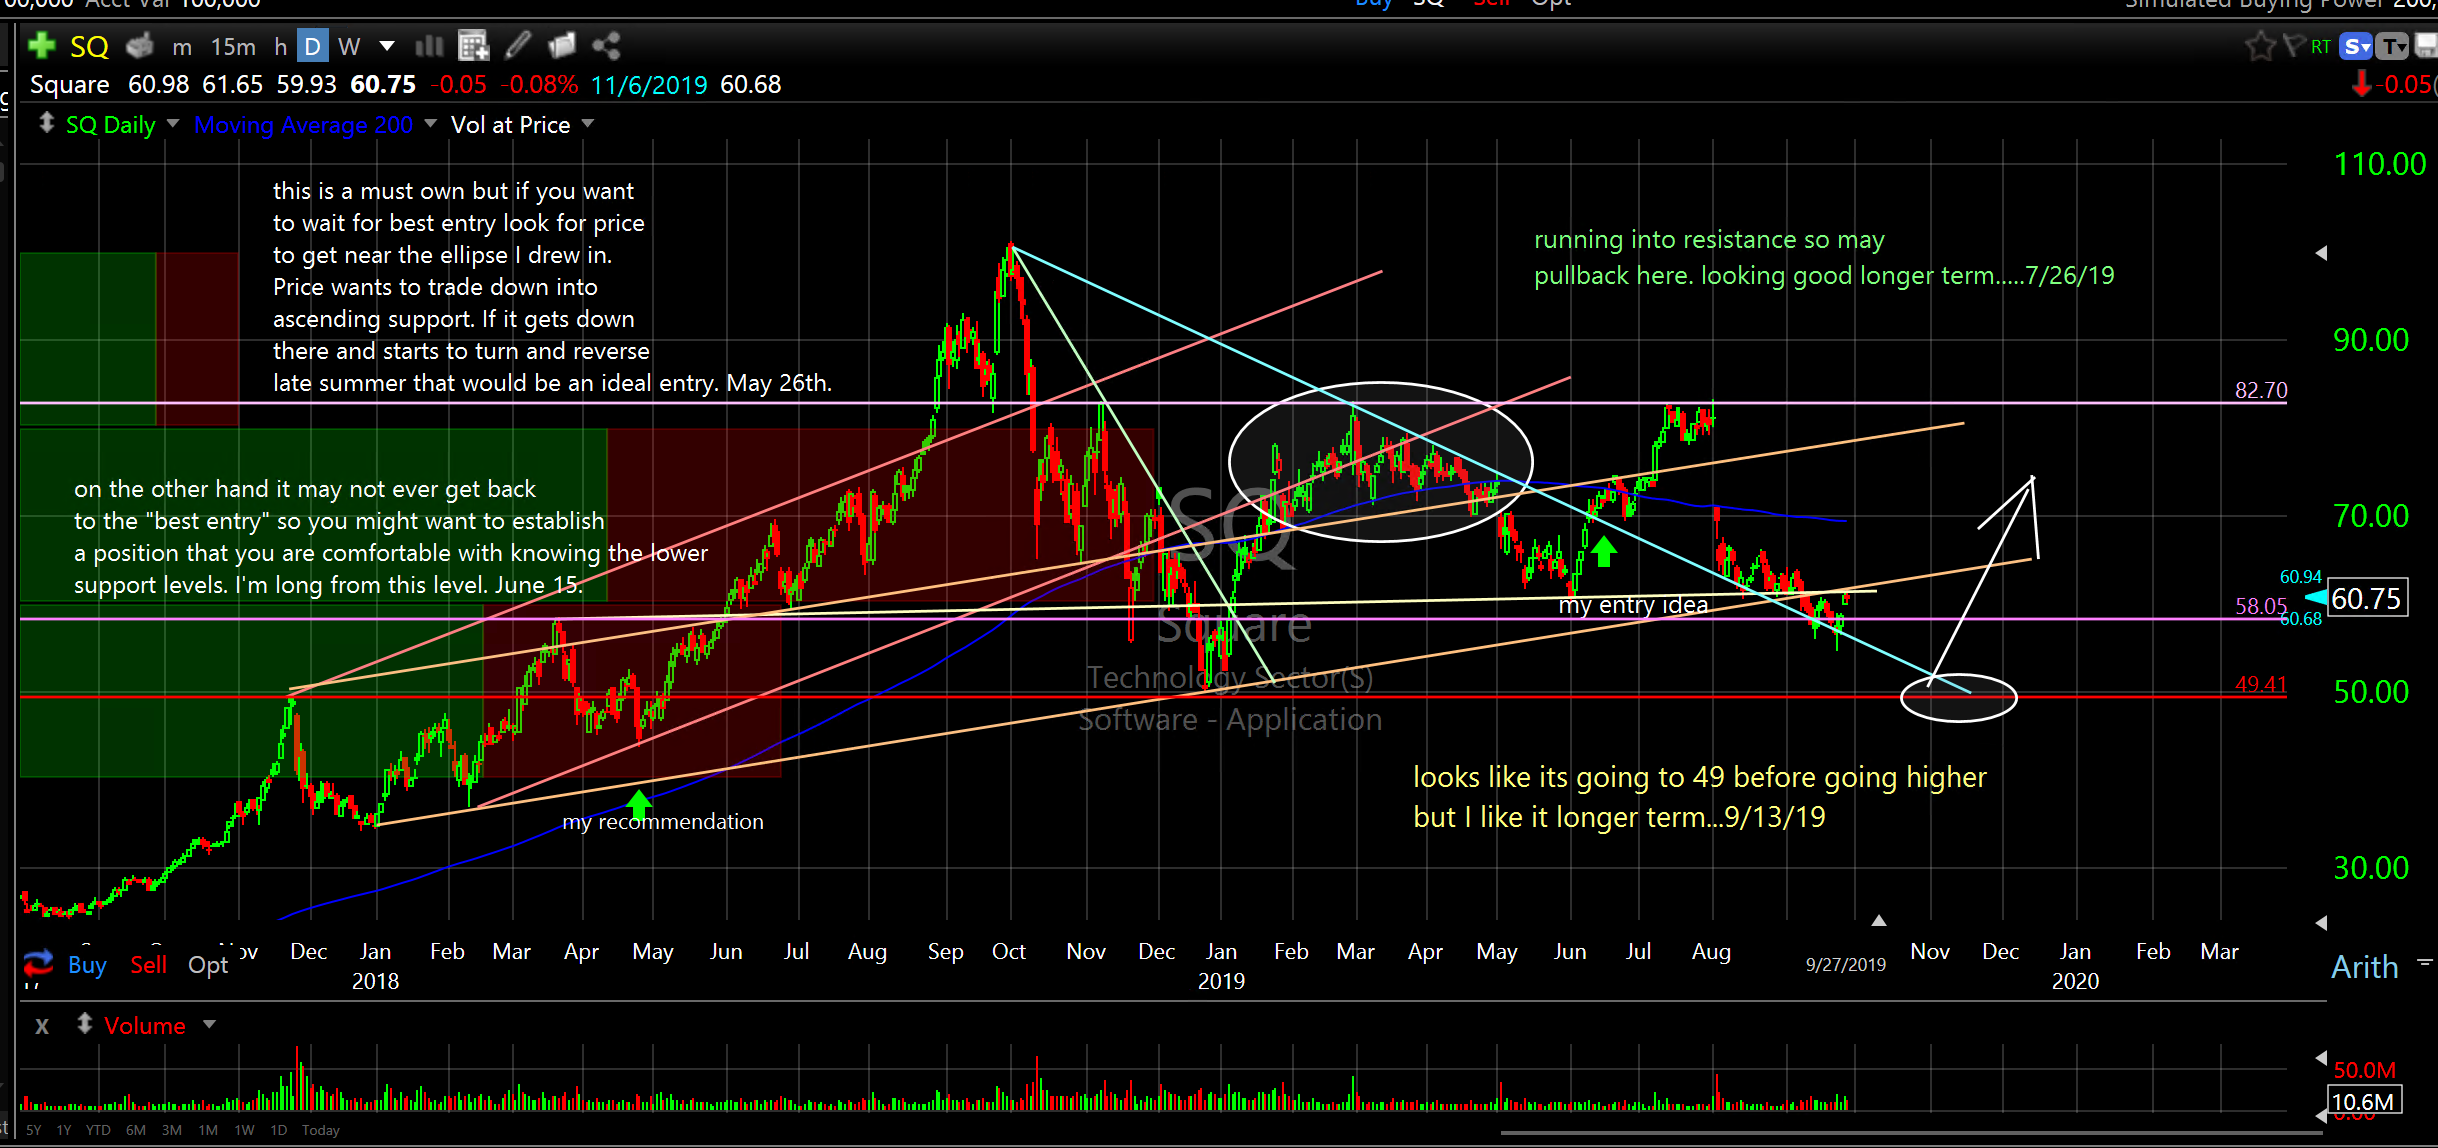
Square (SQ) daily
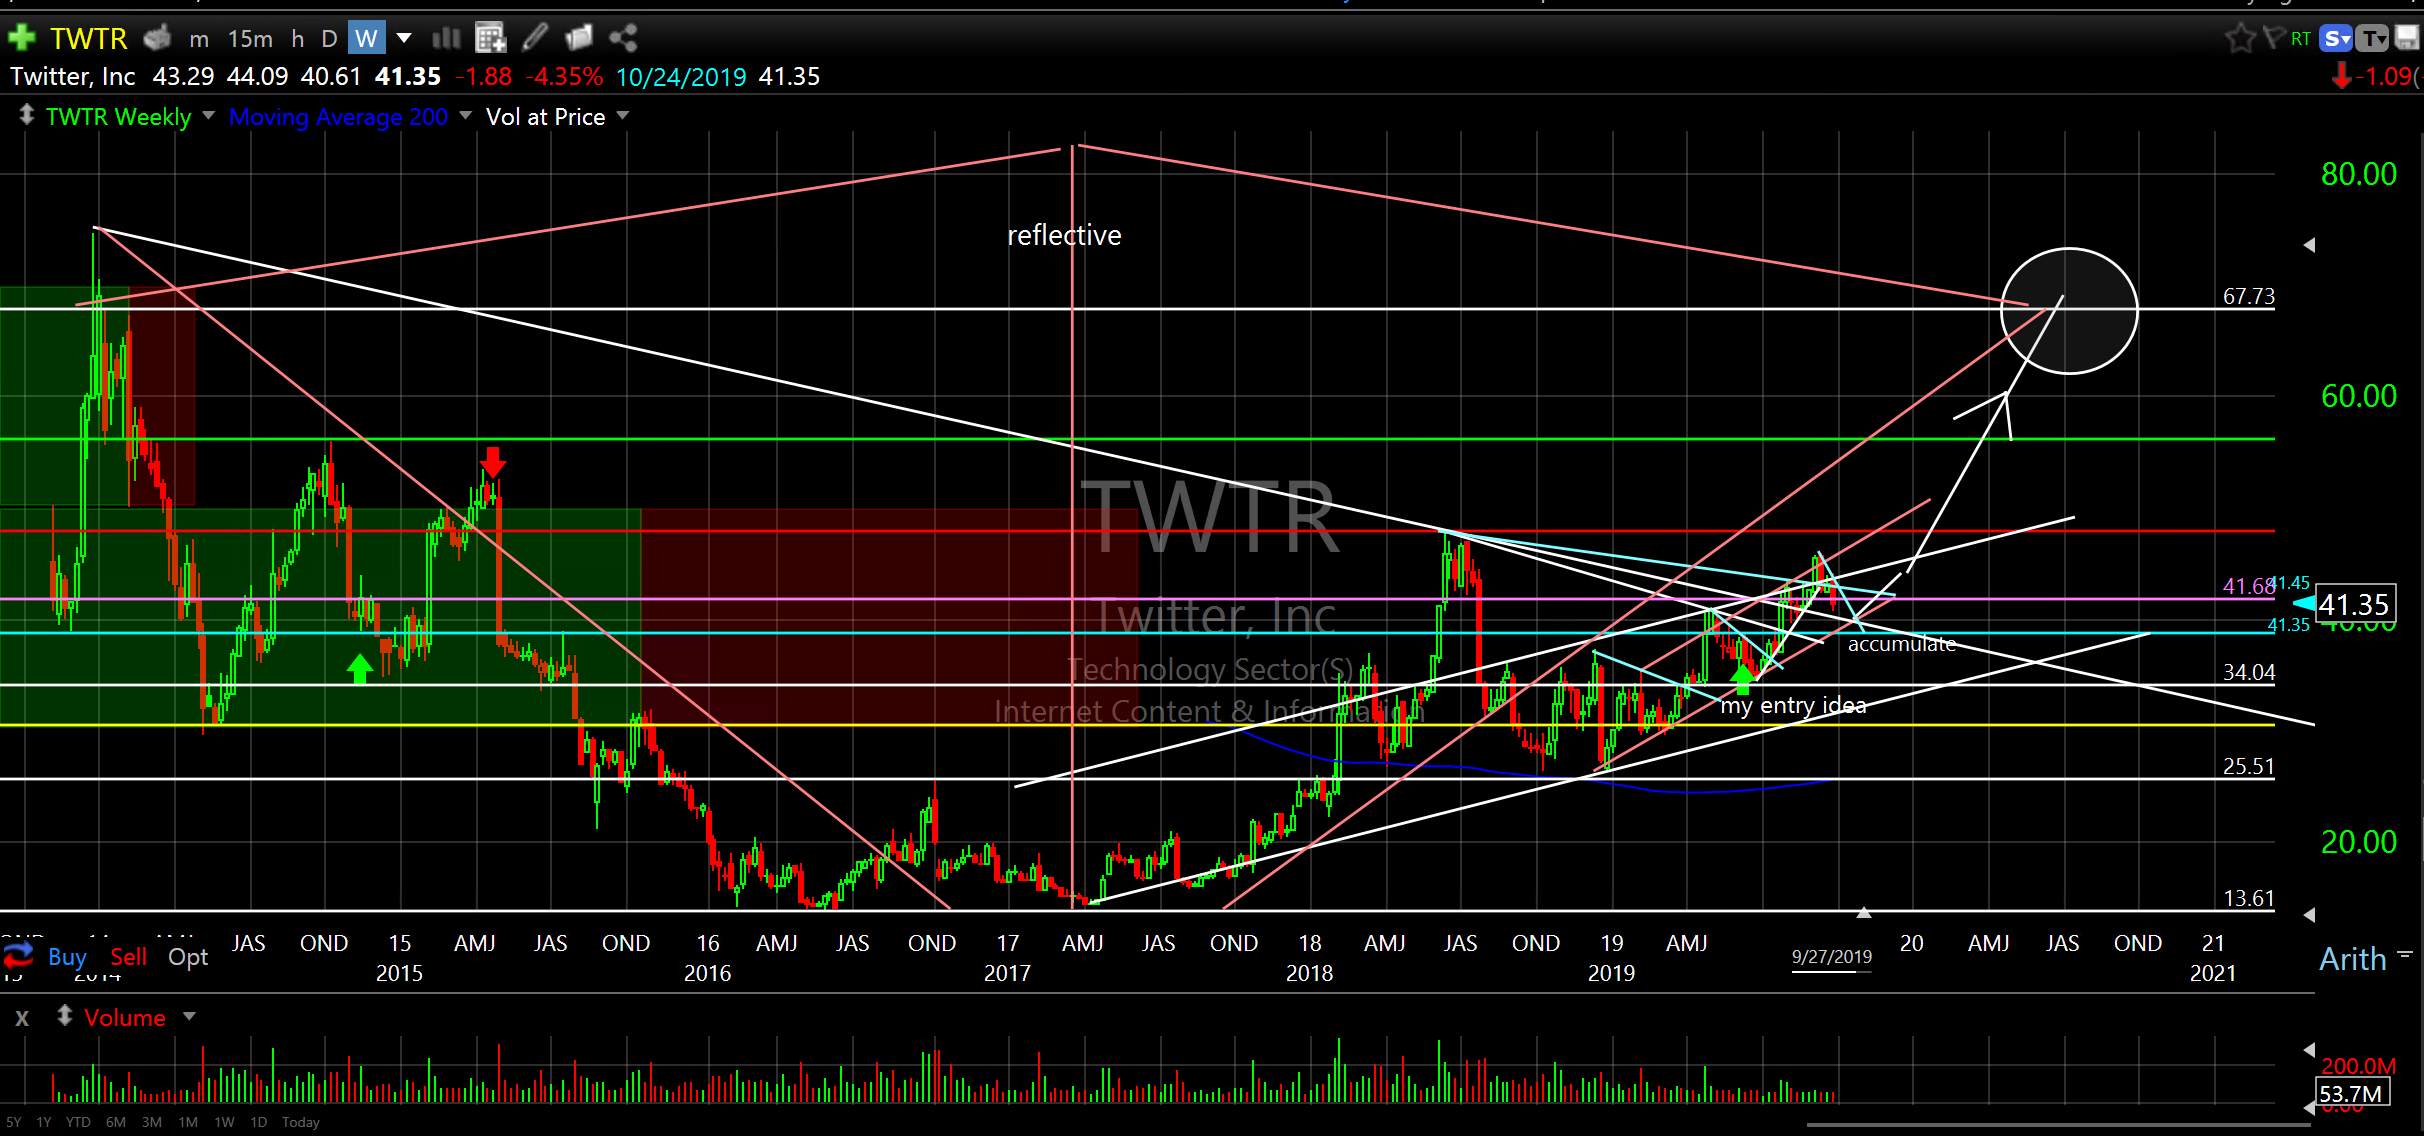
Twitter, Inc (TWTR) weekly
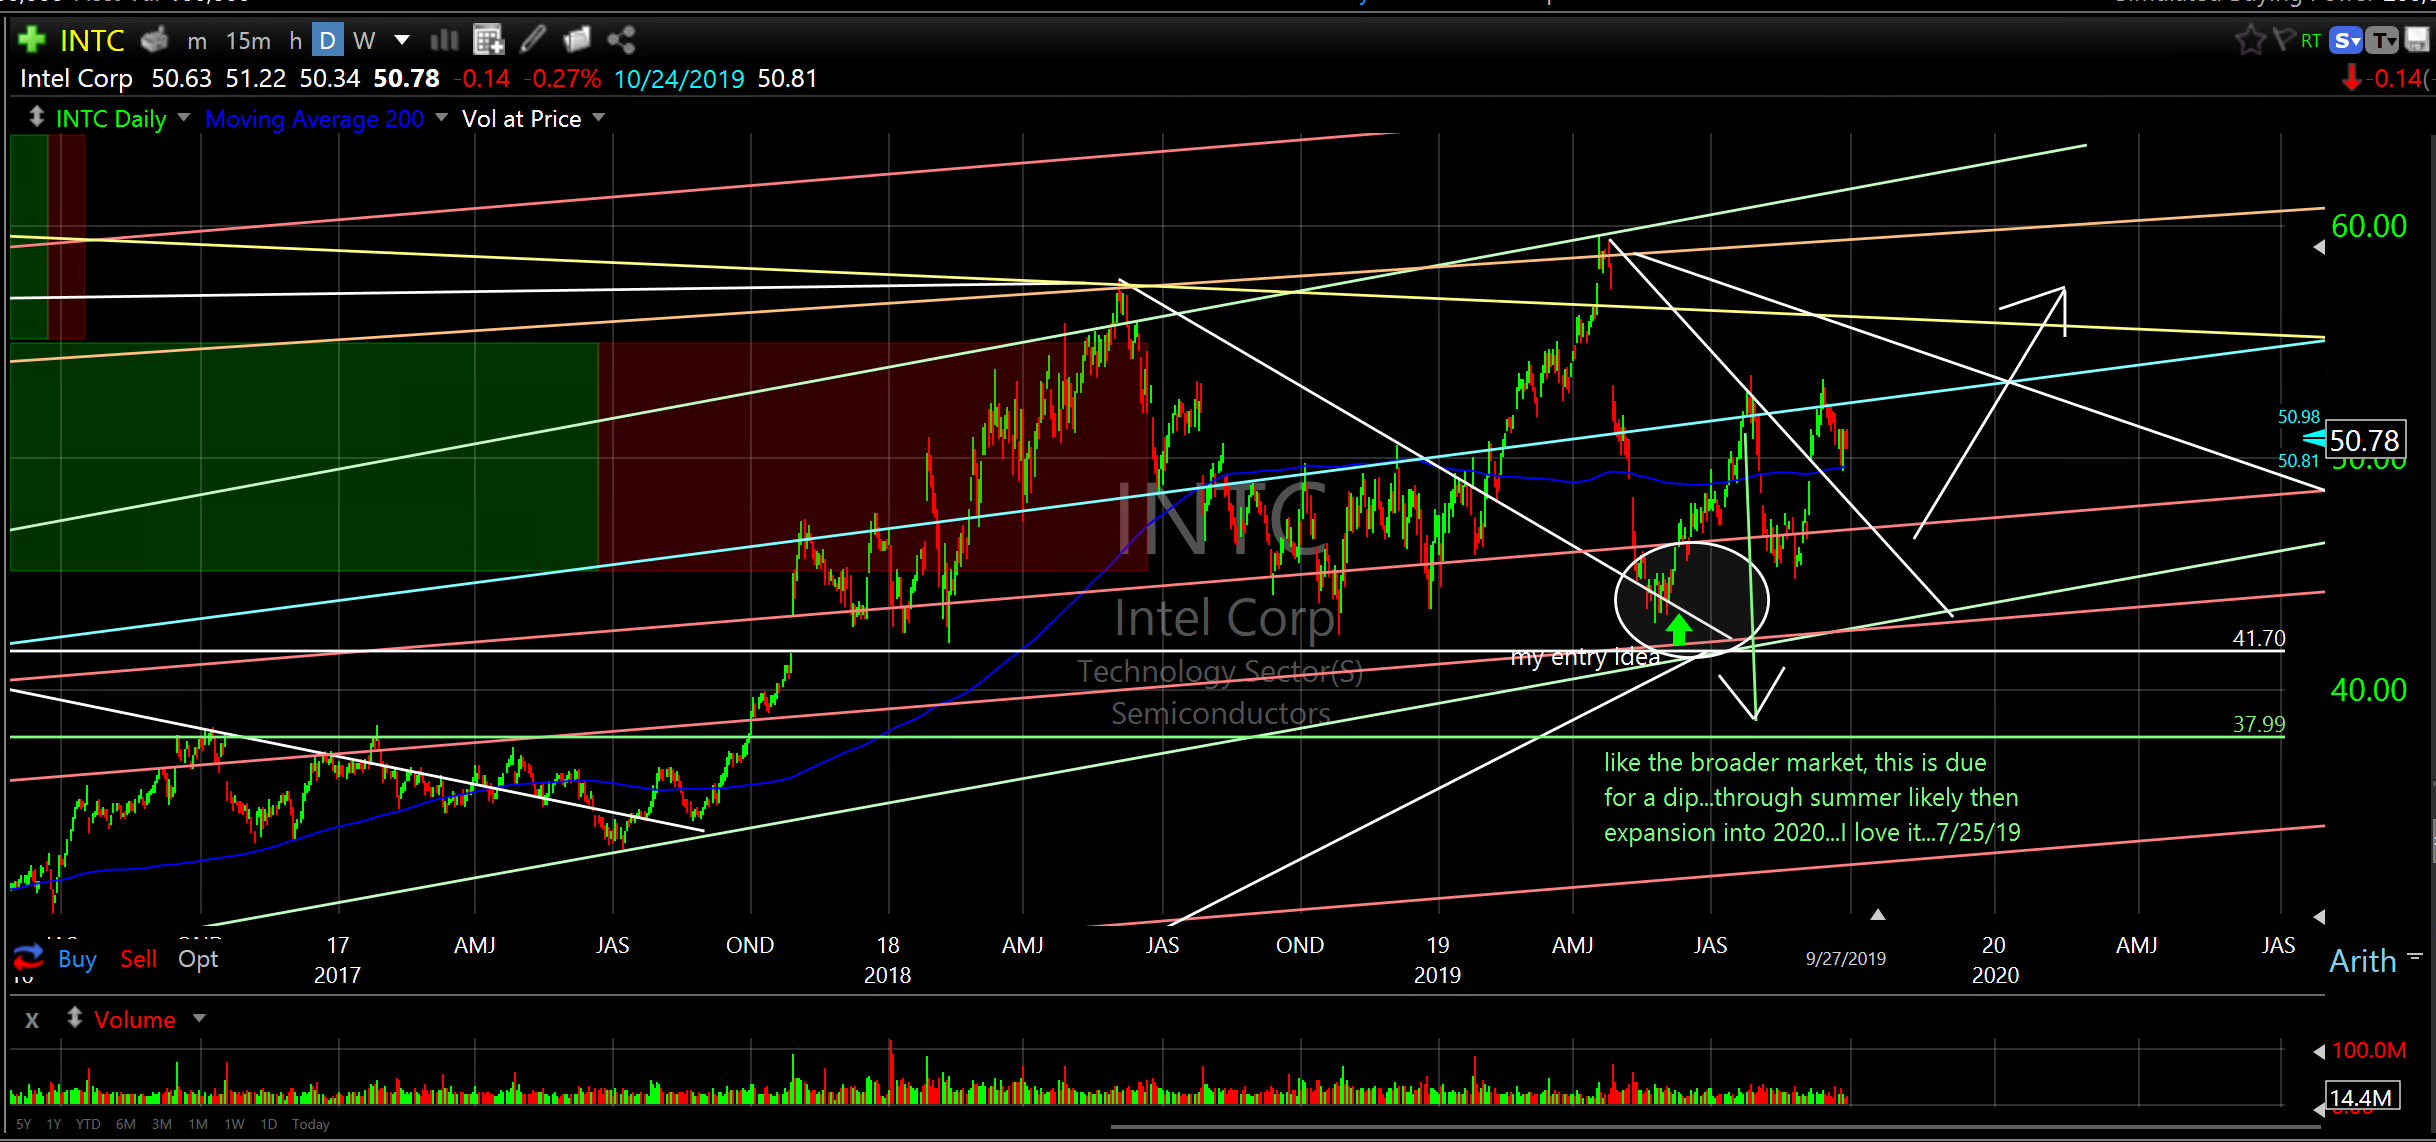
Intel Corp (INTC) daily
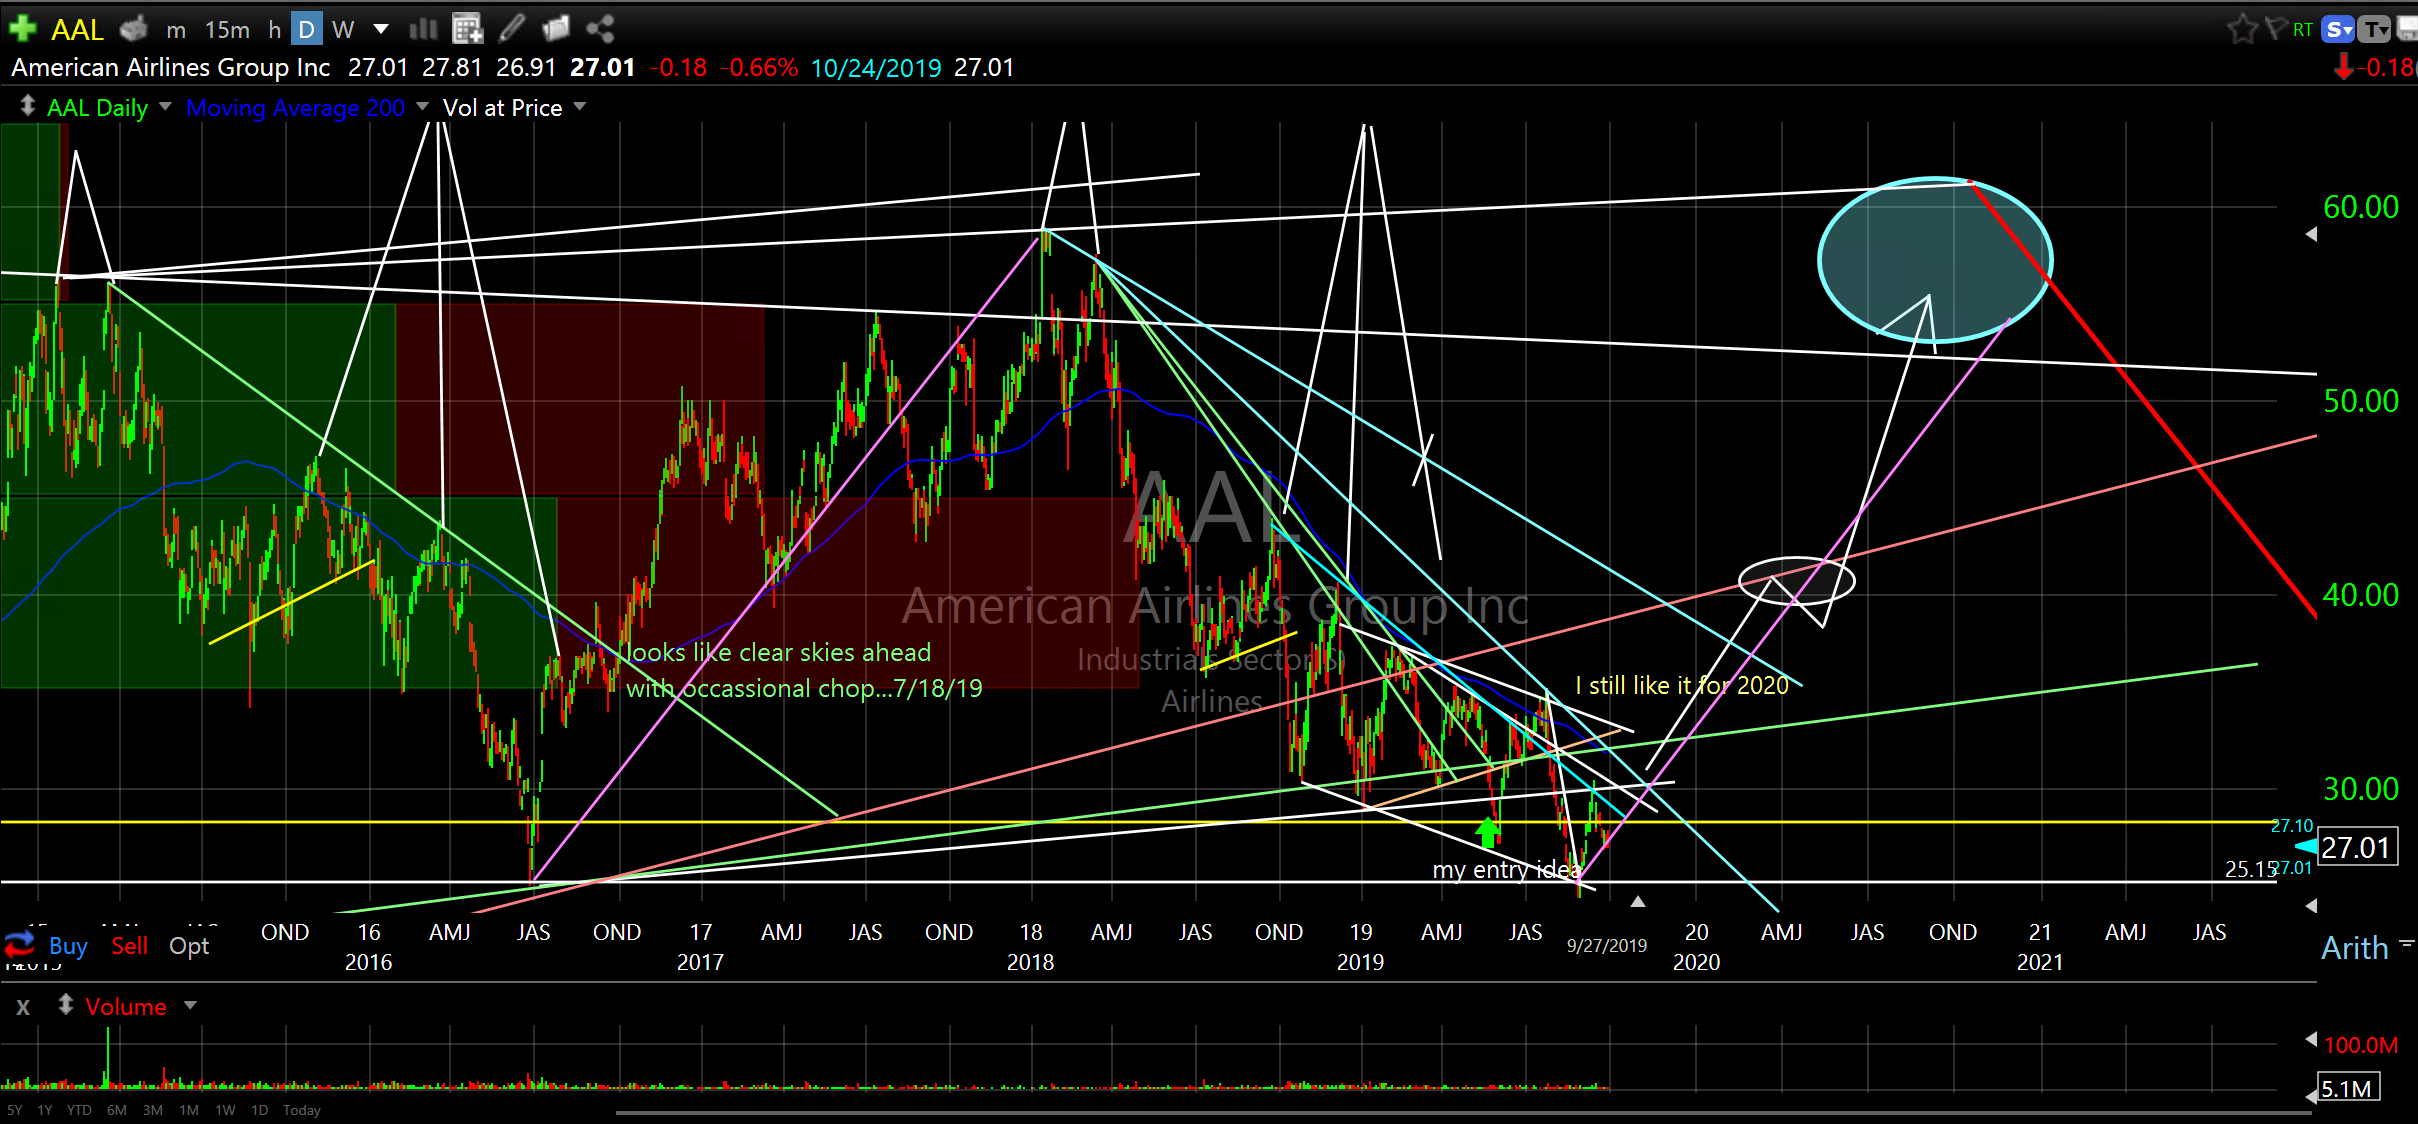
American Airlines Group Inc (AAL) daily
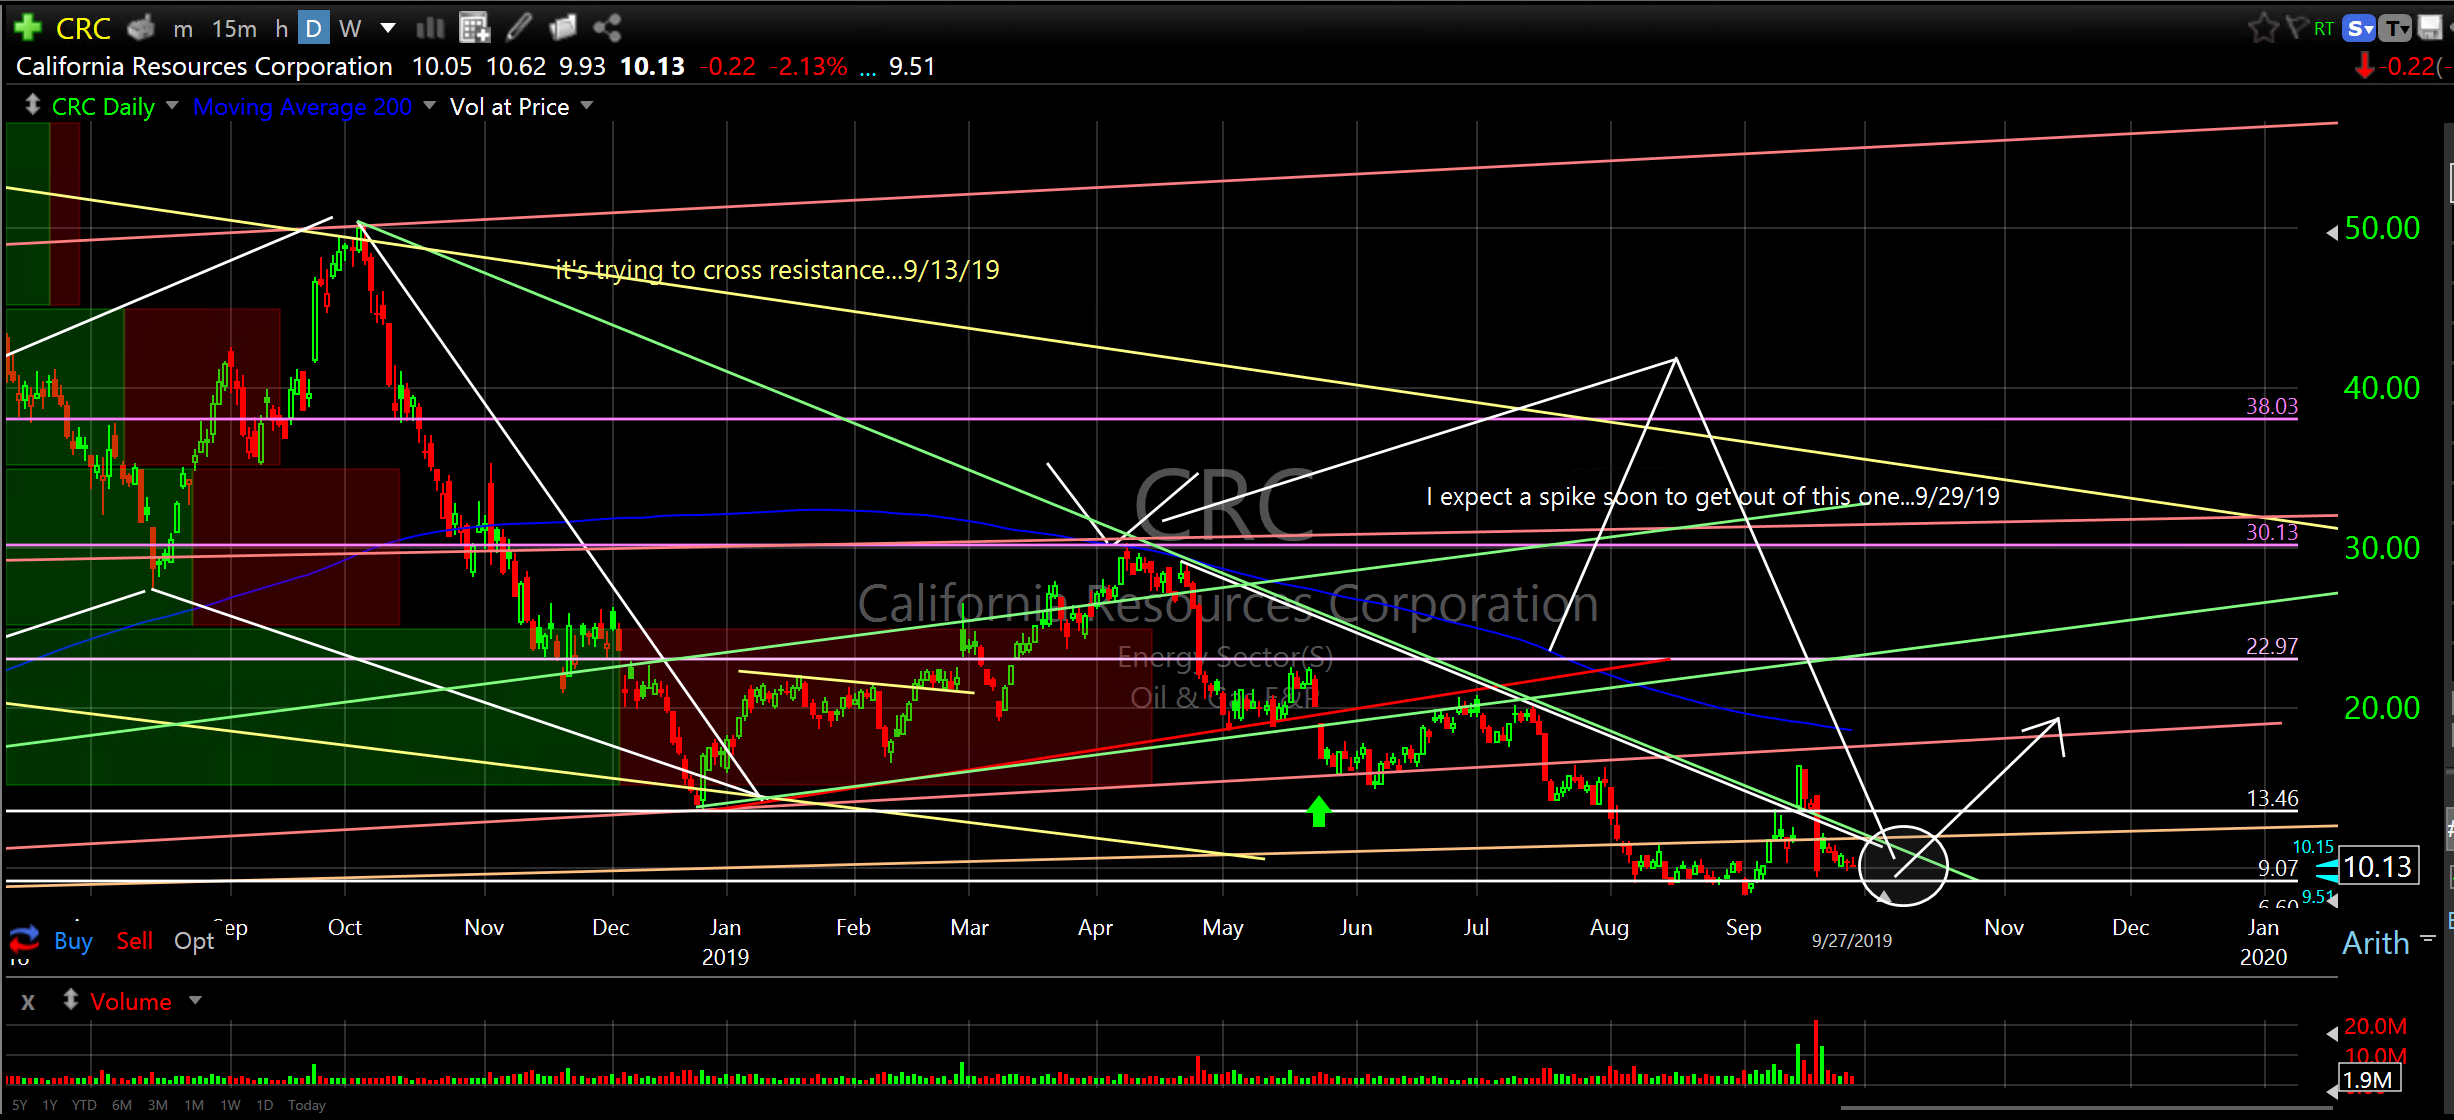
California Resources Corporation (CRC) daily
That’s about half of the charts I want to cover for you this week. I will send the others tomorrow or Tuesday.
Also, one of our sons is getting married on Friday so I will be traveling this week and busy doing Dad stuff. I plan on checking the market when I can grab some time and I will certainly try and do my weekly writing but it will likely be shorter than usual as I will have limited time between Wednesday and Monday. I will make the time to cover anything that is really important however.
If you have any questions please don’t hesitate to ask. Remember, these are just my opinions and I make mistakes and I don’t have all the answers…therefore I chart.
Thanks for reading my stuff and I hope it helps you as much as it helps me.
Don
PS. here is a good read by a smart guy…
https://www.broadswordcapital. com/things-ive-learned-last- 30-years/