Good news…14 out of 15 open trades are up.
Bad news…no new trade opportunities as of today.
I do have REG, Regency Centers Corp, on my radar though.
Regency Centers Corp (REG) weekly
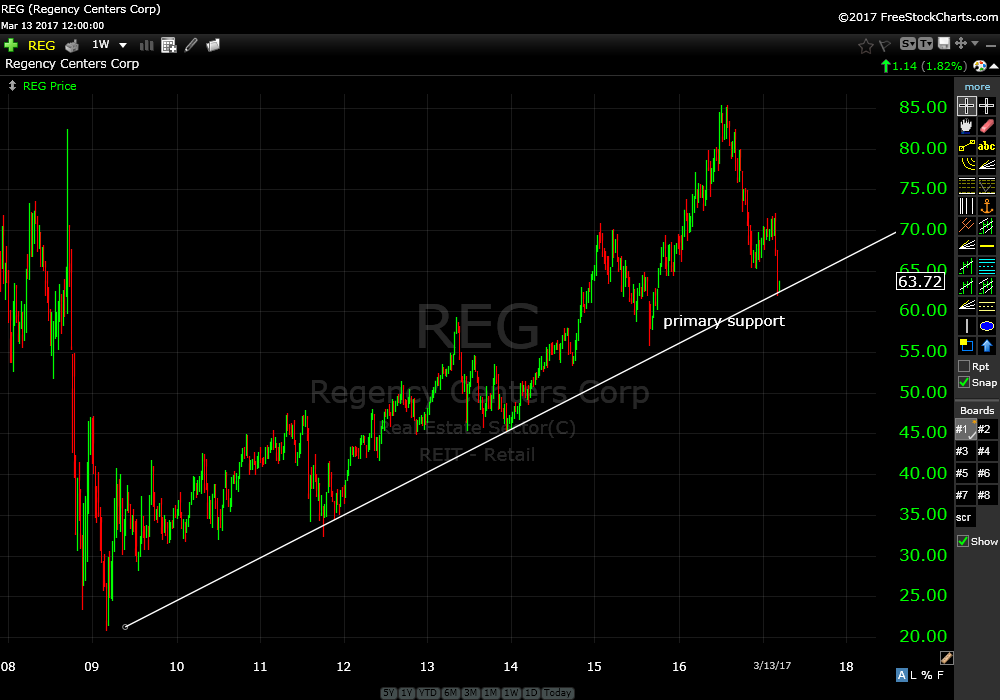
Looking for a bounce off primary support this week. Price is off by about 24% from a year ago and appears to be ready for another leg up. I’ll let you know.
On the other hand. it’s time to capture some gains with EWU.
UK Index Fund ETF (EWU) weekly
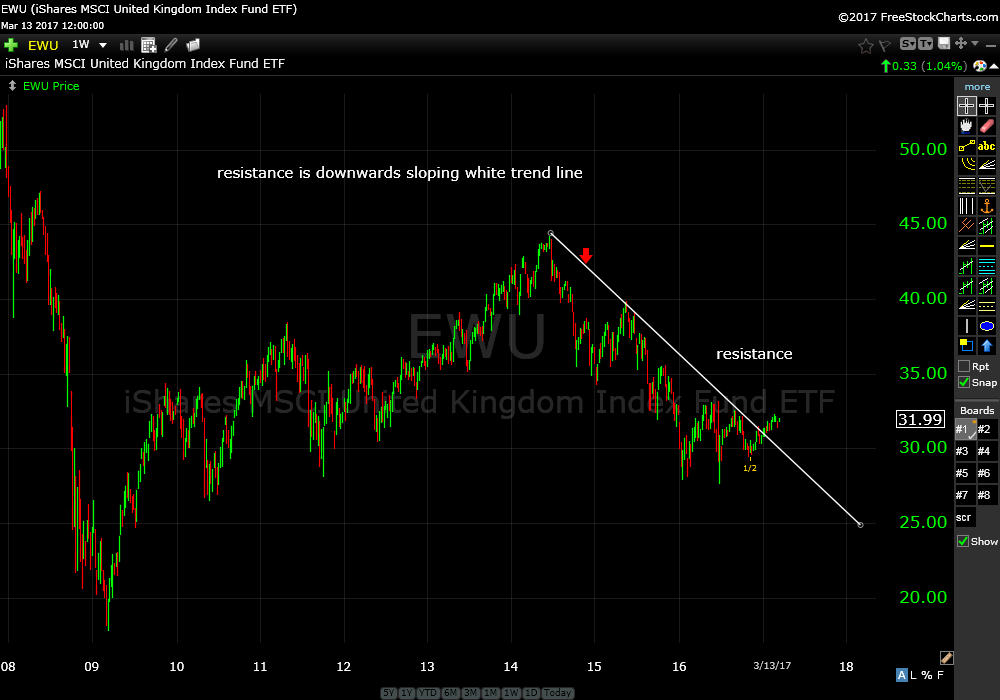
It’s time to close and cover EWU short for about a 14% gain. Price has traded above resistance for a number of weeks so its time to take profits and move on.
Review of recent trades…
20+ Year Treasury Bond Fund (TLT) weekly
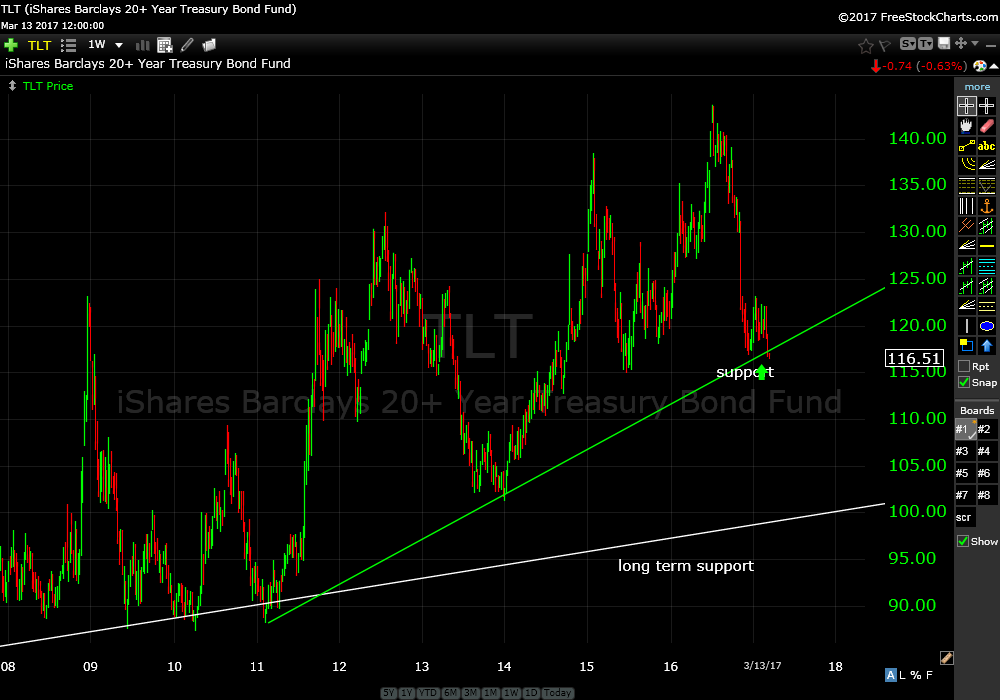
Price is off by about 4% from where we bought it. Closed last week slightly under support. If it closes this week under support I will recommend selling it as then it will be likely to trade down into primary support. We might get another opportunity if that happens.
Most everyone thinks interest rates are going up. That’s a good sign they might not.
One of the cool things about trading/investing on price action is getting in early on big moves when most everyone else is clueless.
Like INDA…
India Index Fund ETF (INDA) daily
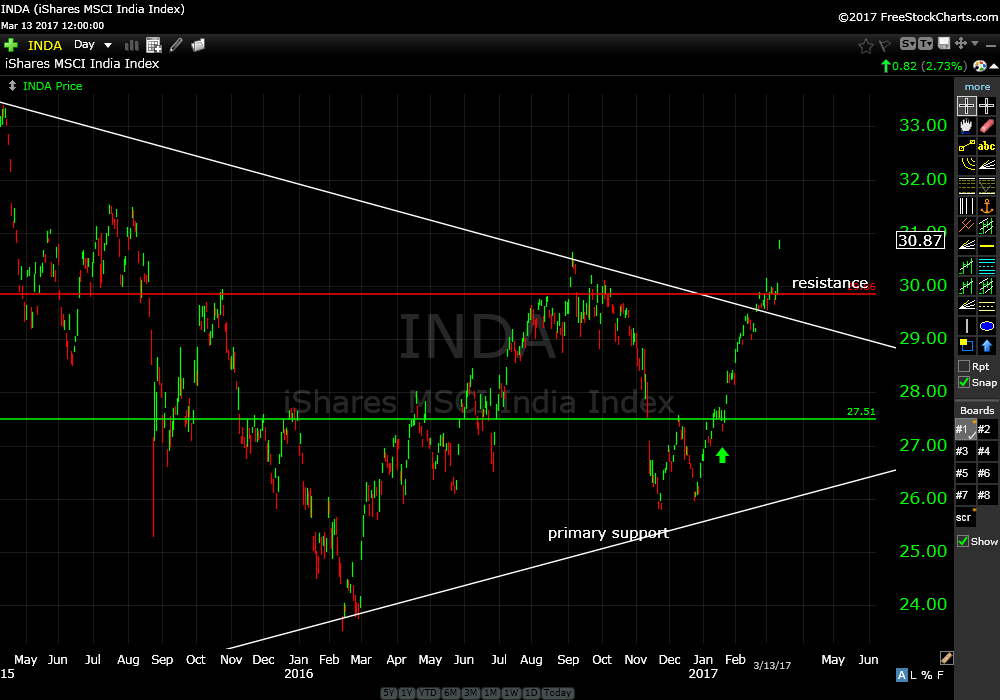
Up almost 12% from our recommendation on January 17 of this year. CNBC was all over it today. Welcome to the party guys. Where were they when price was getting a kicker off support about 14% ago.
I really wonder why I still watch CNBC. I like the people and I have met a few of them. They are really nice, smart and passionate about their work but there is so much talk that is so insignificant to what is really important.
Makes me think we should harvest gains soon with all of their sudden interest in India. Hold a little longer.
Facebook Inc. (FB) daily
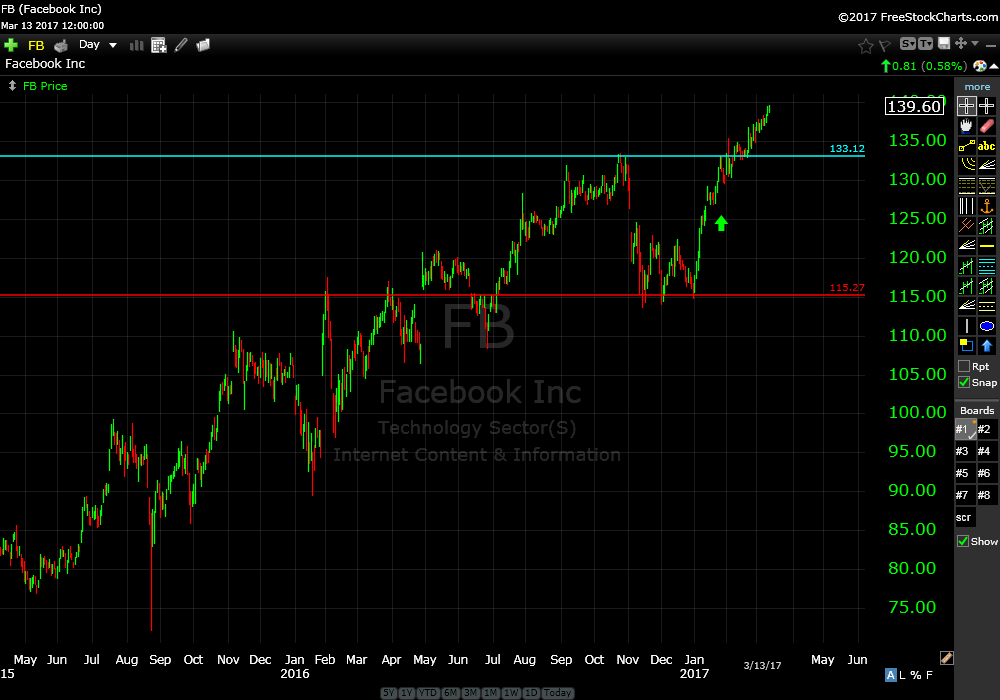
We are up about 9% from our recommendation on January 17th this year. Price cleared the previous high from late last year a couple of weeks ago. Continue to hold.
Lamar Advertising Co. (LAMR) daily
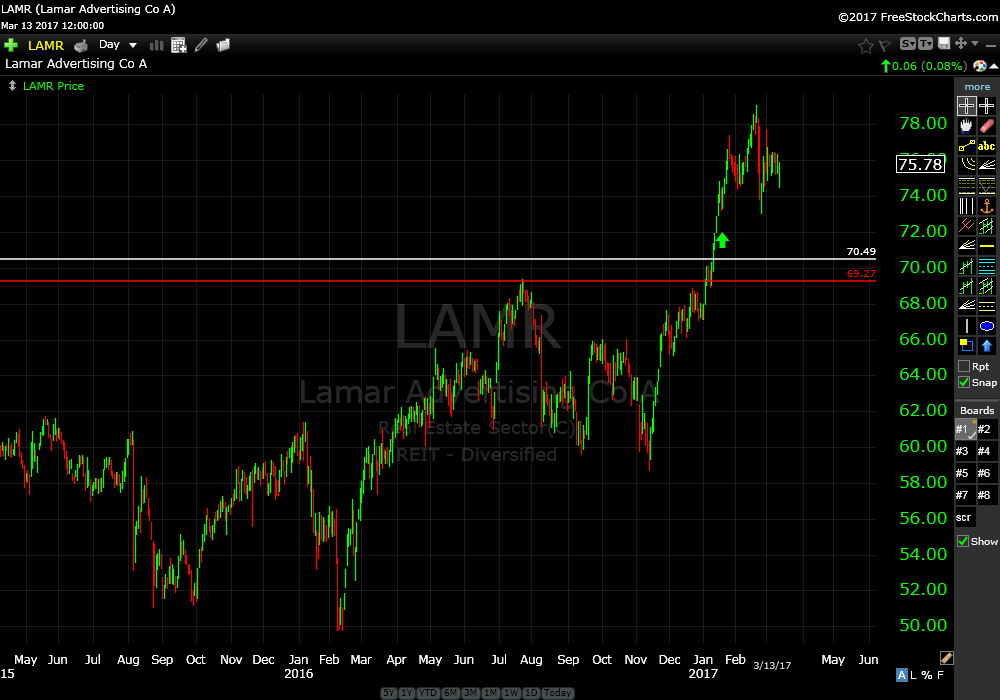
We are up about 3.5% from our recommendation on January 17th this year. After such a sharp move up price momentum has stalled. This is certainly not a bad sign. Continue to hold.
Mexico Index Fund ETF (EWW) daily
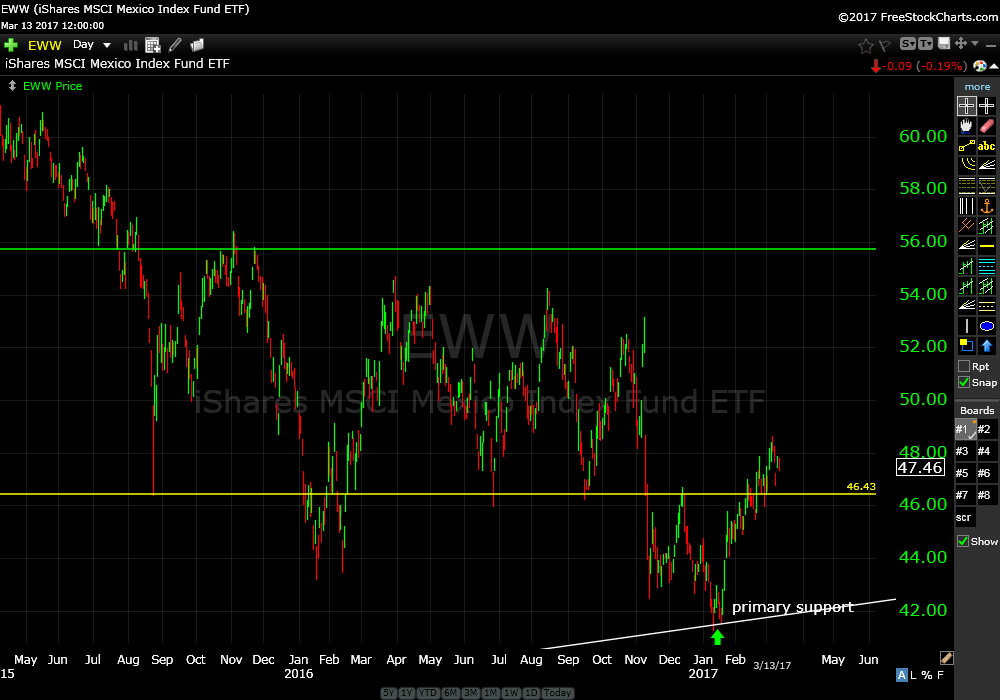
Up about 12% from January 17th this year. Who would have thought this would happen when everyone thought they had to pay for a big wall. Continue to hold. Looking for price to stay above 47.50.
Social Media Index ETF (SOCL) daily
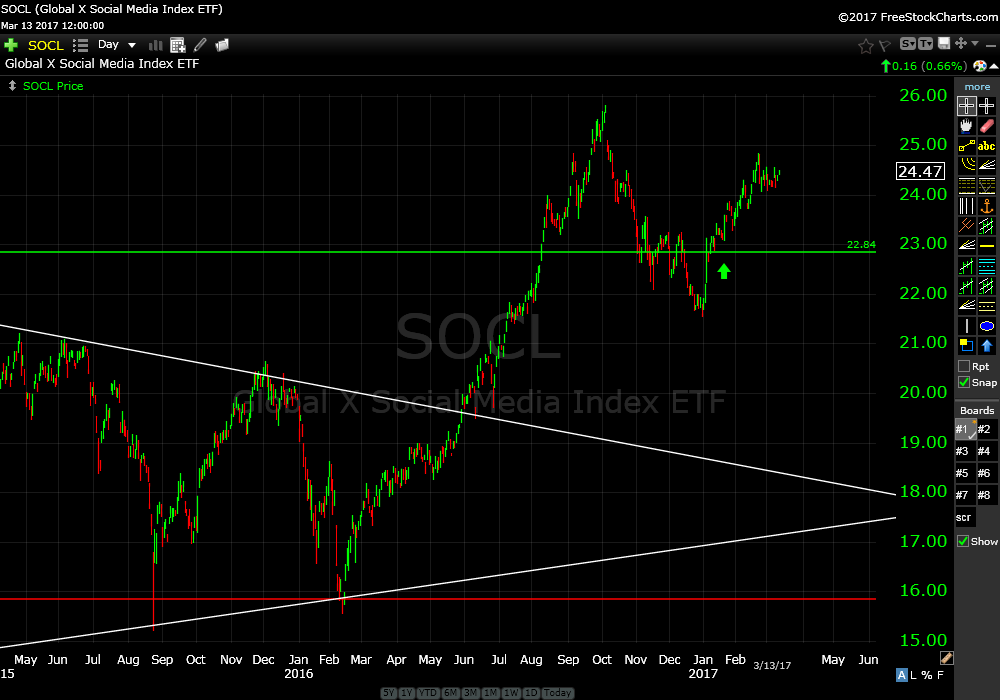
Up about 5% from January 17th this year after clearing resistance at $23.00. A must hold above $23.00.
Medtronic PLC (MDT) daily
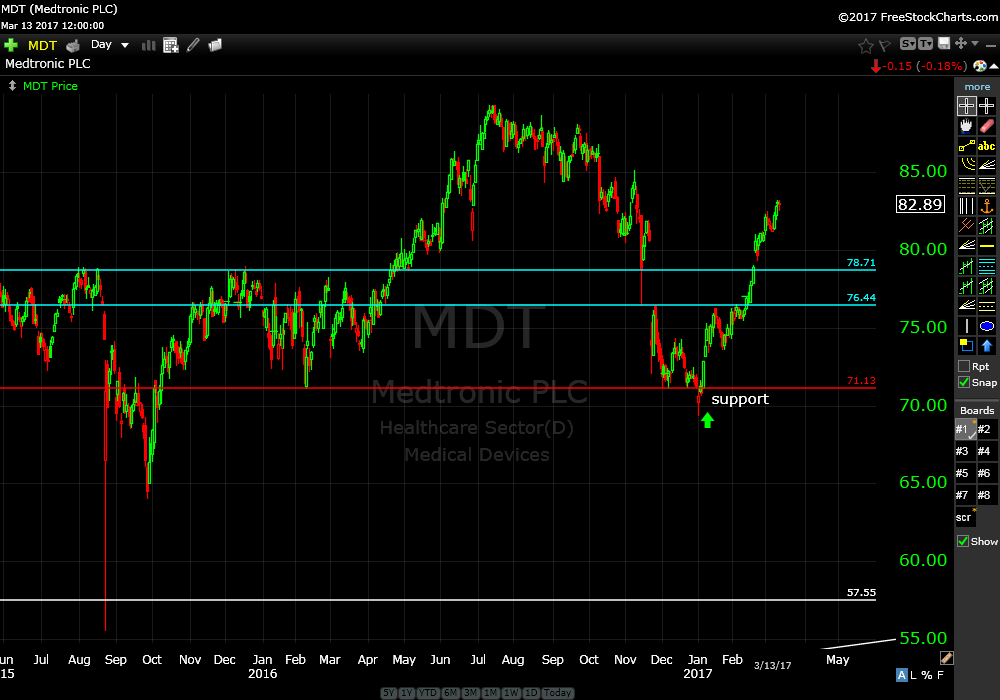
Up about 10% from January 17th this year after bounce off $71.00 support level. Price cleared previous resistance at $78.71 on Feb 21. A must hold above $78.00.
Post Holdings Inc. (POST) daily
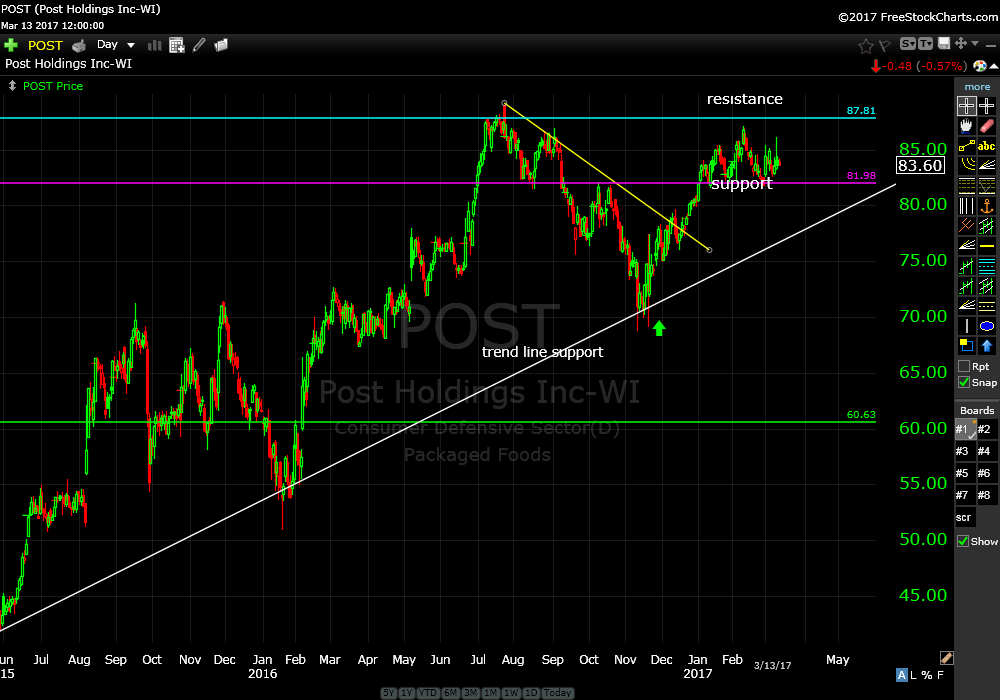
Up about 11.5% from November 22, 2106. Price action has been sideways for most of 2017. I’m OK with that. Our current risk is just under $82.00. Continue to hold.
Telecommunications Sector Index ETF (IYZ) daily
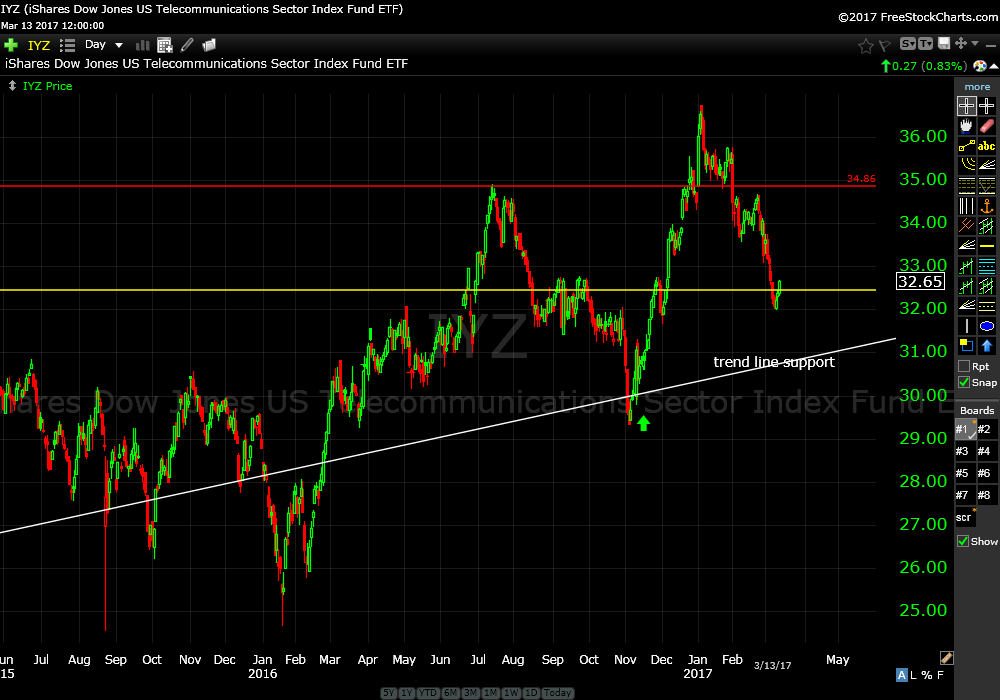
Up about 6% from November 14, 2016. Price has faded back this year but I still think it has room to run. Risk is below trend line support. Continue to hold. This is another one they weren’t talking about late last year.
SPDR’s Energy ETF (XLE) daily
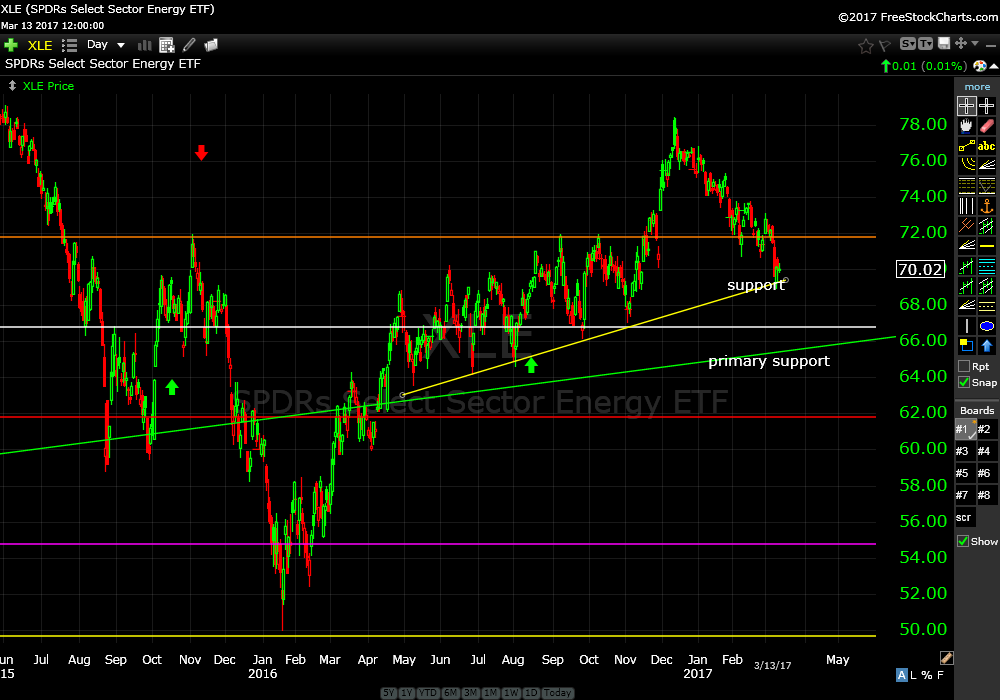
Up about 3% from August 8, 2016. Price has faded back after a significant run up a couple of months ago. Currently above support; upwards sloping yellow line. This level is current risk. If this level breaks price is likely to trade down into primary support; the green upwards sloping trend line. If this happens we will get another opportunity to get long energy. Continue to hold.
Also, continue to hold SPY, QQQ and XLK. All systems are go in spite of what noise is out there in media land.
We spent a nice day at the BNP Paribas Tennis Tournament in Indian Wells today as guests of Charles Schwab. The suite was great and more food and drink that even I could consume. Really nice people but stuck on 60 year old academic investment theories that have been proven to be wrong. They don’t have it all wrong though…$6.95 per trade. Beats the shit out of $700.00 per trade that’s based on a bunch of crap.
That’s it for now. If you have any questions, comments or complaints ask the person to your left. Just kidding…I’m just an email away.
Trade Smart,
Don
*Written after market close on Monday, March 13, 2017.