Happy Sunday…Go Chargers
Don’t you just love Fall. It’s really beautiful wherever you are. The beaches are 80 degrees and uncrowded, the mountains are crisp and clear and the desert air is 24 hours of perfect. I love it.
So, I recently shared a couple of my recent updates, broader market price projections/reversals and archived research/trade ideas with someone who I thought was really interested in the stock market. His response was “Good guess”. That was it. I took it as a complement.
It reminded me of the time I overheard someone watching a professional golf tournament say “that was a lucky shot Tiger”. I thought to myself…one lucky shot after another you mean, over and over and over. Lots of practice, observation, measurement and experience lead to that “lucky shot”.
I suppose guessing plays a role in all of human development from the time we were living in caves, however, a more pragmatic approach involves evidence based conclusions. Evidence is developed from collecting, observing and measuring data over long time periods. Conclusions are drawn from evidence.
I have spent over three decades collecting, observing and measuring raw price data. I still do this…every day…it’s just what I enjoy doing. I would offer this is a more scientific approach than guessing, isn’t it? I gather data/information. I analyze and interpret the data. I form a hypothesis. I test the hypothesis. I draw conclusions then I publish the results. That’s it. I document it all. It’s fully transparent for anyone to see.
Much of this evidence, data, observation, measurement, testing, correlation, hypothesizing, interpretation, conclusion and awesome humor is archived on my website. I publish the good, bad and ugly of my humor, I mean work, so that others can evaluate and improve on. And trust me, there is good, bad and ugly… but… the good weighs out, it wins. I try to be somewhat scientific about it all but I believe there is a certain element of creative art involved as well. What’s important is that it is teachable and repeatable. In addition, and really most importantly, all of my work has a foundation in managing risk.
Looking back from when I began publishing my Broader Market charting I remember all of my specific entry/exit ideas concerning the Broader Market. In the summer of 2011, when I first began publishing, I was bearish. My first entry/exit idea was in August, 2011 when I recommended selling the Broader Market. I remember writing it in Northern Colorado. Then, in late November that year, I reversed course and wrote and published on November 28, 2011 to buy the Broader Market. Two days later, on Wednesday, November 30, 2011 the Dow jumped about 400 points and has never re-visited that low since. I remained bullish for seven years until October 4, 2018 when I began turning bearish. I recommended, in early October, to reduce exposure to the Broader Market. Then, on January 7th, 2019 I reversed course again and ramped up my bullish entry ideas throughout the month. I have been longer term bullish ever since in spite of the massive chop since; the chop that I have projected, almost exactly.
So, looking back, my charting has been quite accurate in projecting both Broader Market reversals, direction and thrust. This is why I chart. The only real mistakes are just a handful of individual securities I have held too long as I became “married” to them (one of the things I try not to do). I’m human, I make mistakes and I even have a couple of those now. The whole point of this exercise is to document all of it; the good, bad and ugly. Overall, my charting has helped me to be accurate for many years. You may not agree with or understand my charting but you can’t argue with the results.
Below are just some examples…
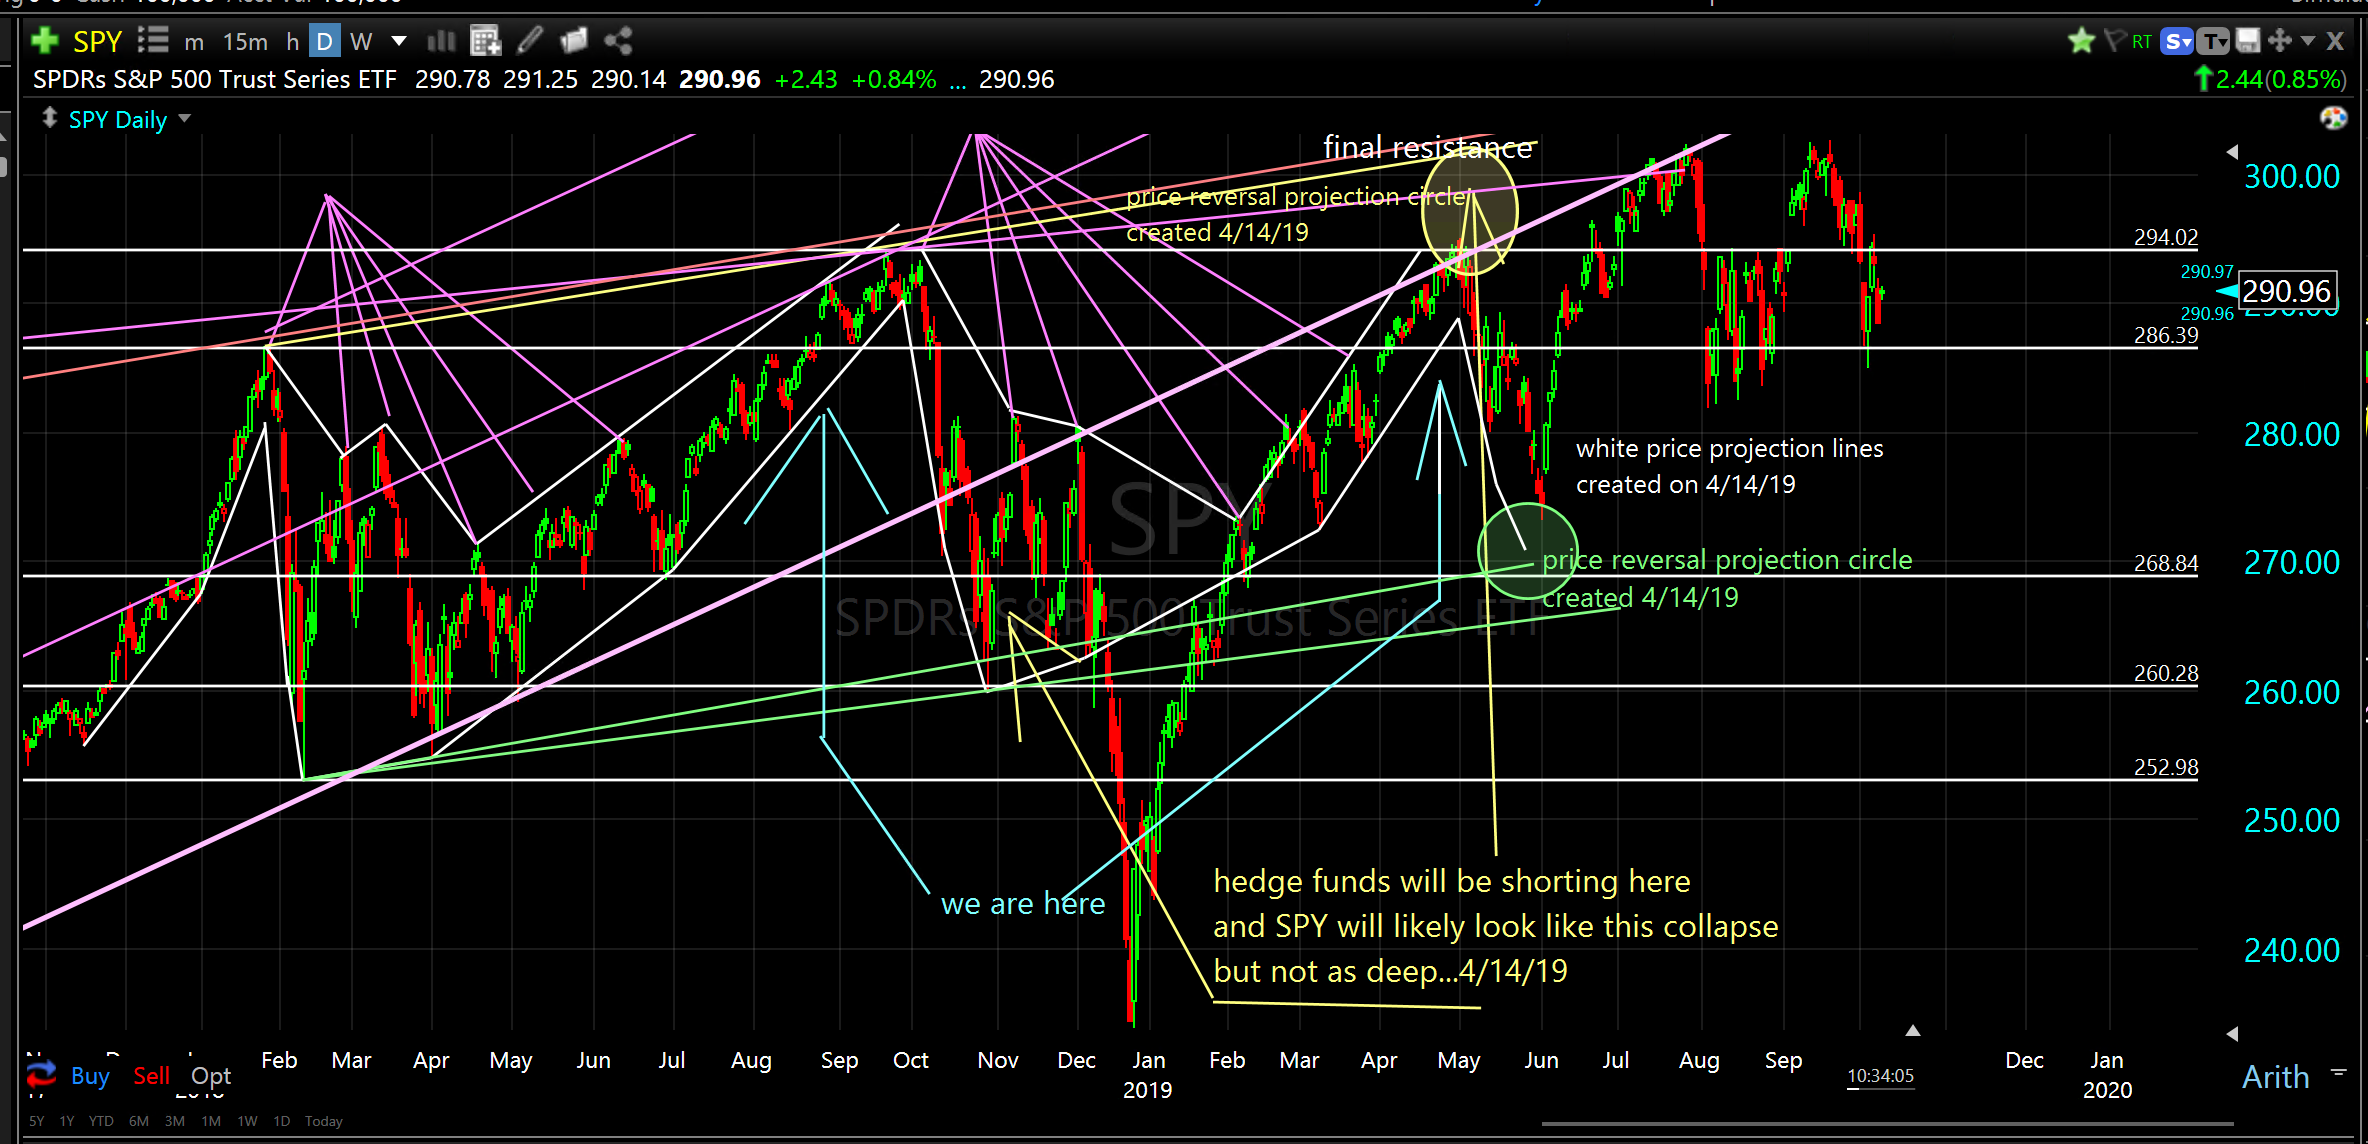
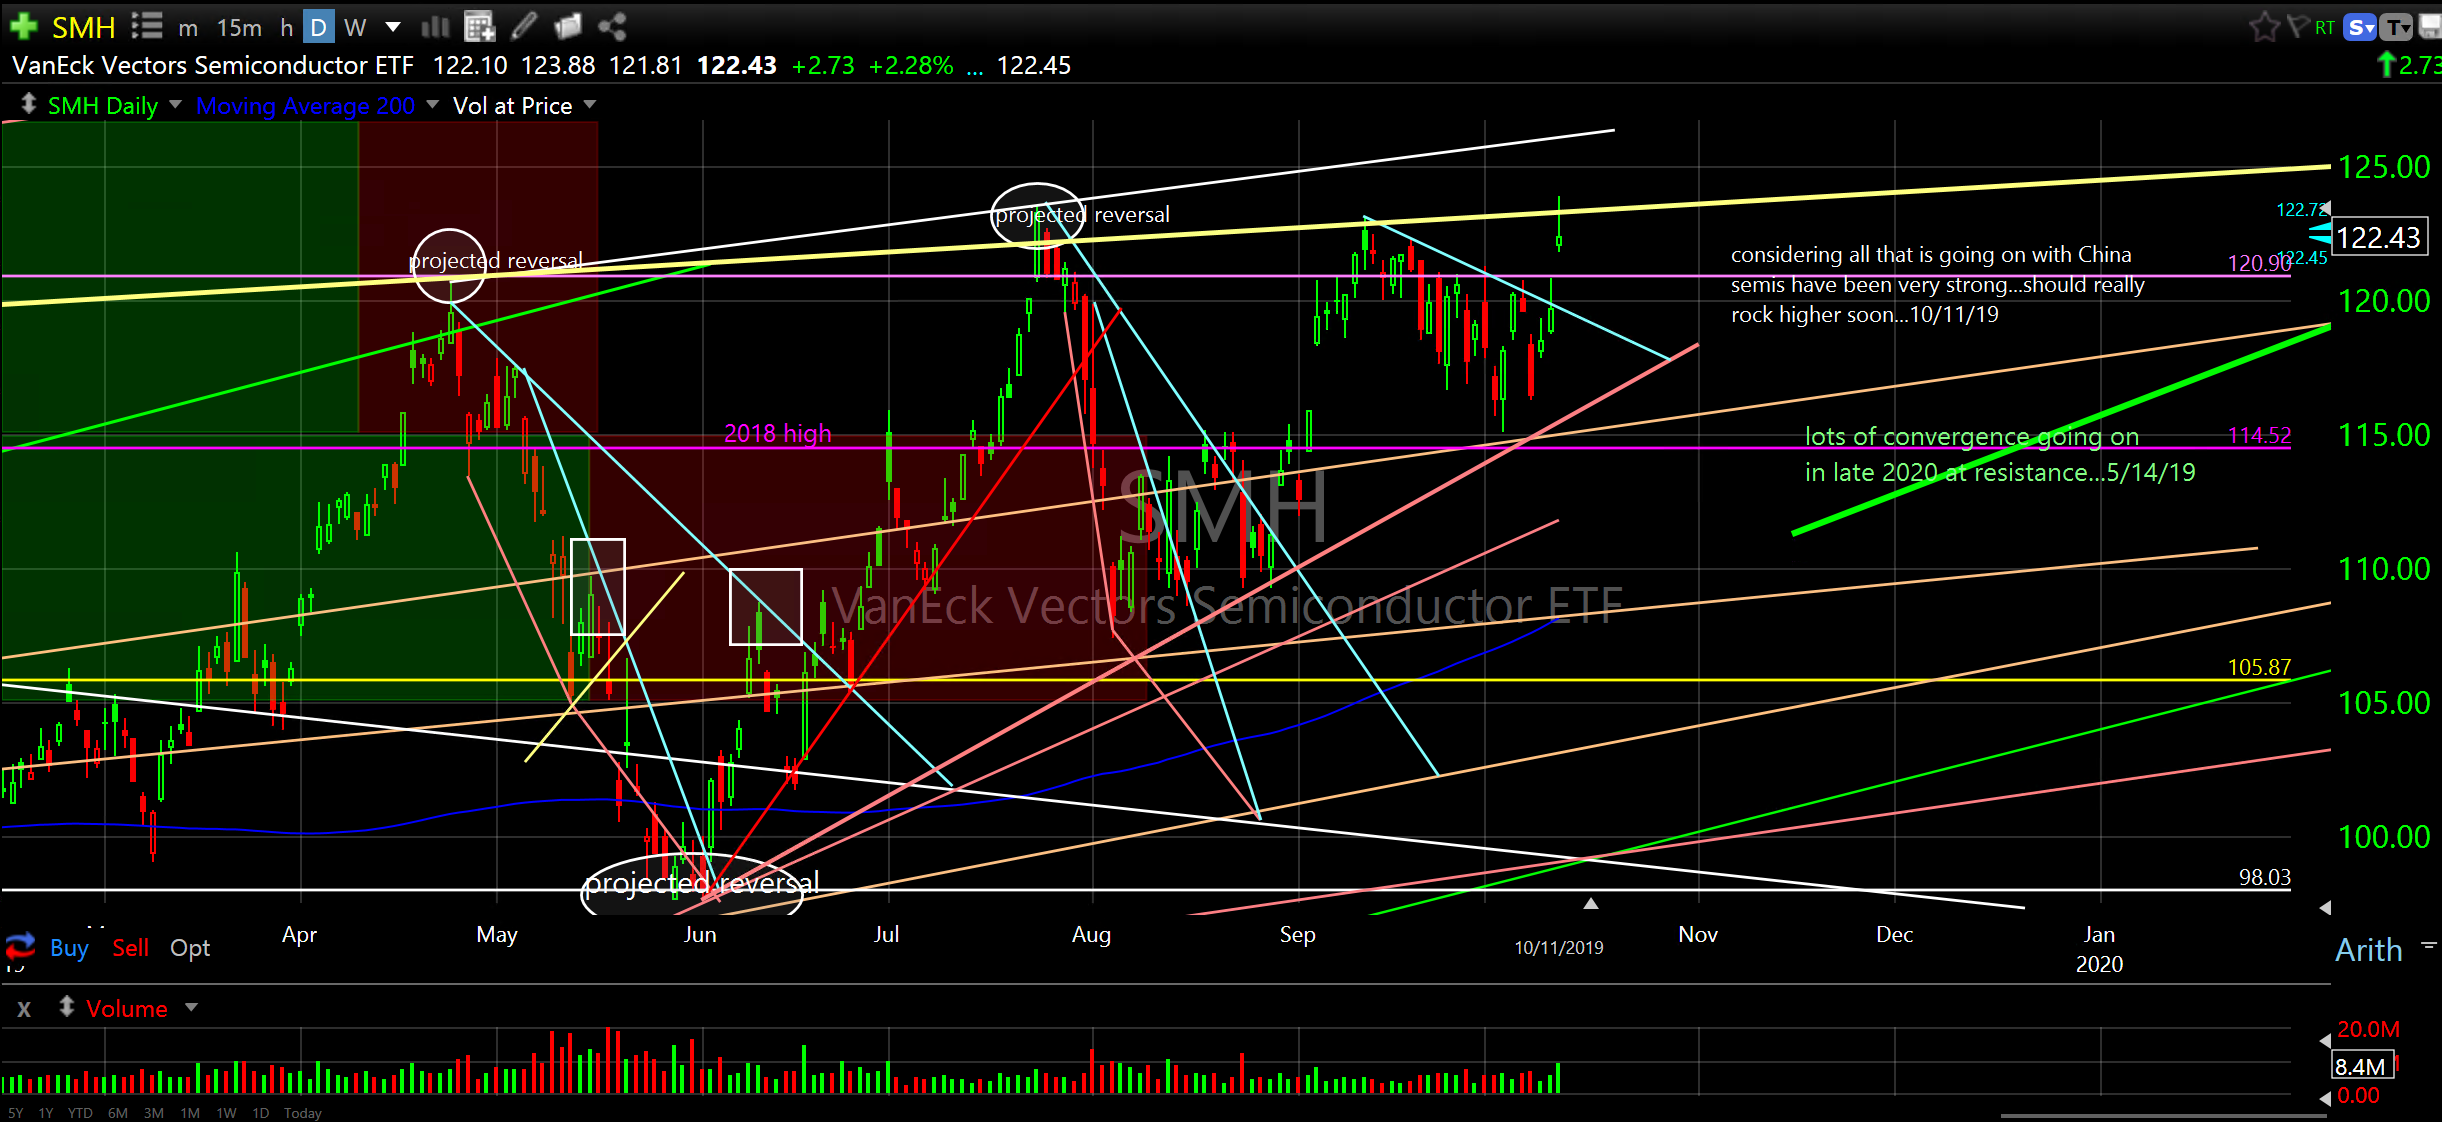
Study the charts attached below. They are recently published broader market index ETF charts and a few published trade ideas from this year as examples (there are hundreds more archived on website). Price projections and reversal zones are drawn in BEFORE they occurred! They are published BEFORE they occurred. You received them BEFORE the price action occurred. Hard evidence.
Please read dated chart comments, price projections, entry / exit ideas and projected reversals (circles) on charts.
Let’s be clear…PRICE PROJECTIONS AND REVERSALS ARE DRAWN IN BEFORE THEY ACTUALLY HAPPENED…AND THEY WERE ALL PUBLISHED BEFORE THEY OCCURRED. B-E-F-O-R-E.
A few examples…
SPDR’s S&P 500 Trust Series ETF (SPY) daily
SPDR Dow Jones Industrial Average ETF (DIA) daily

Invesco QQQTrust Ser 1 (QQQ) daily
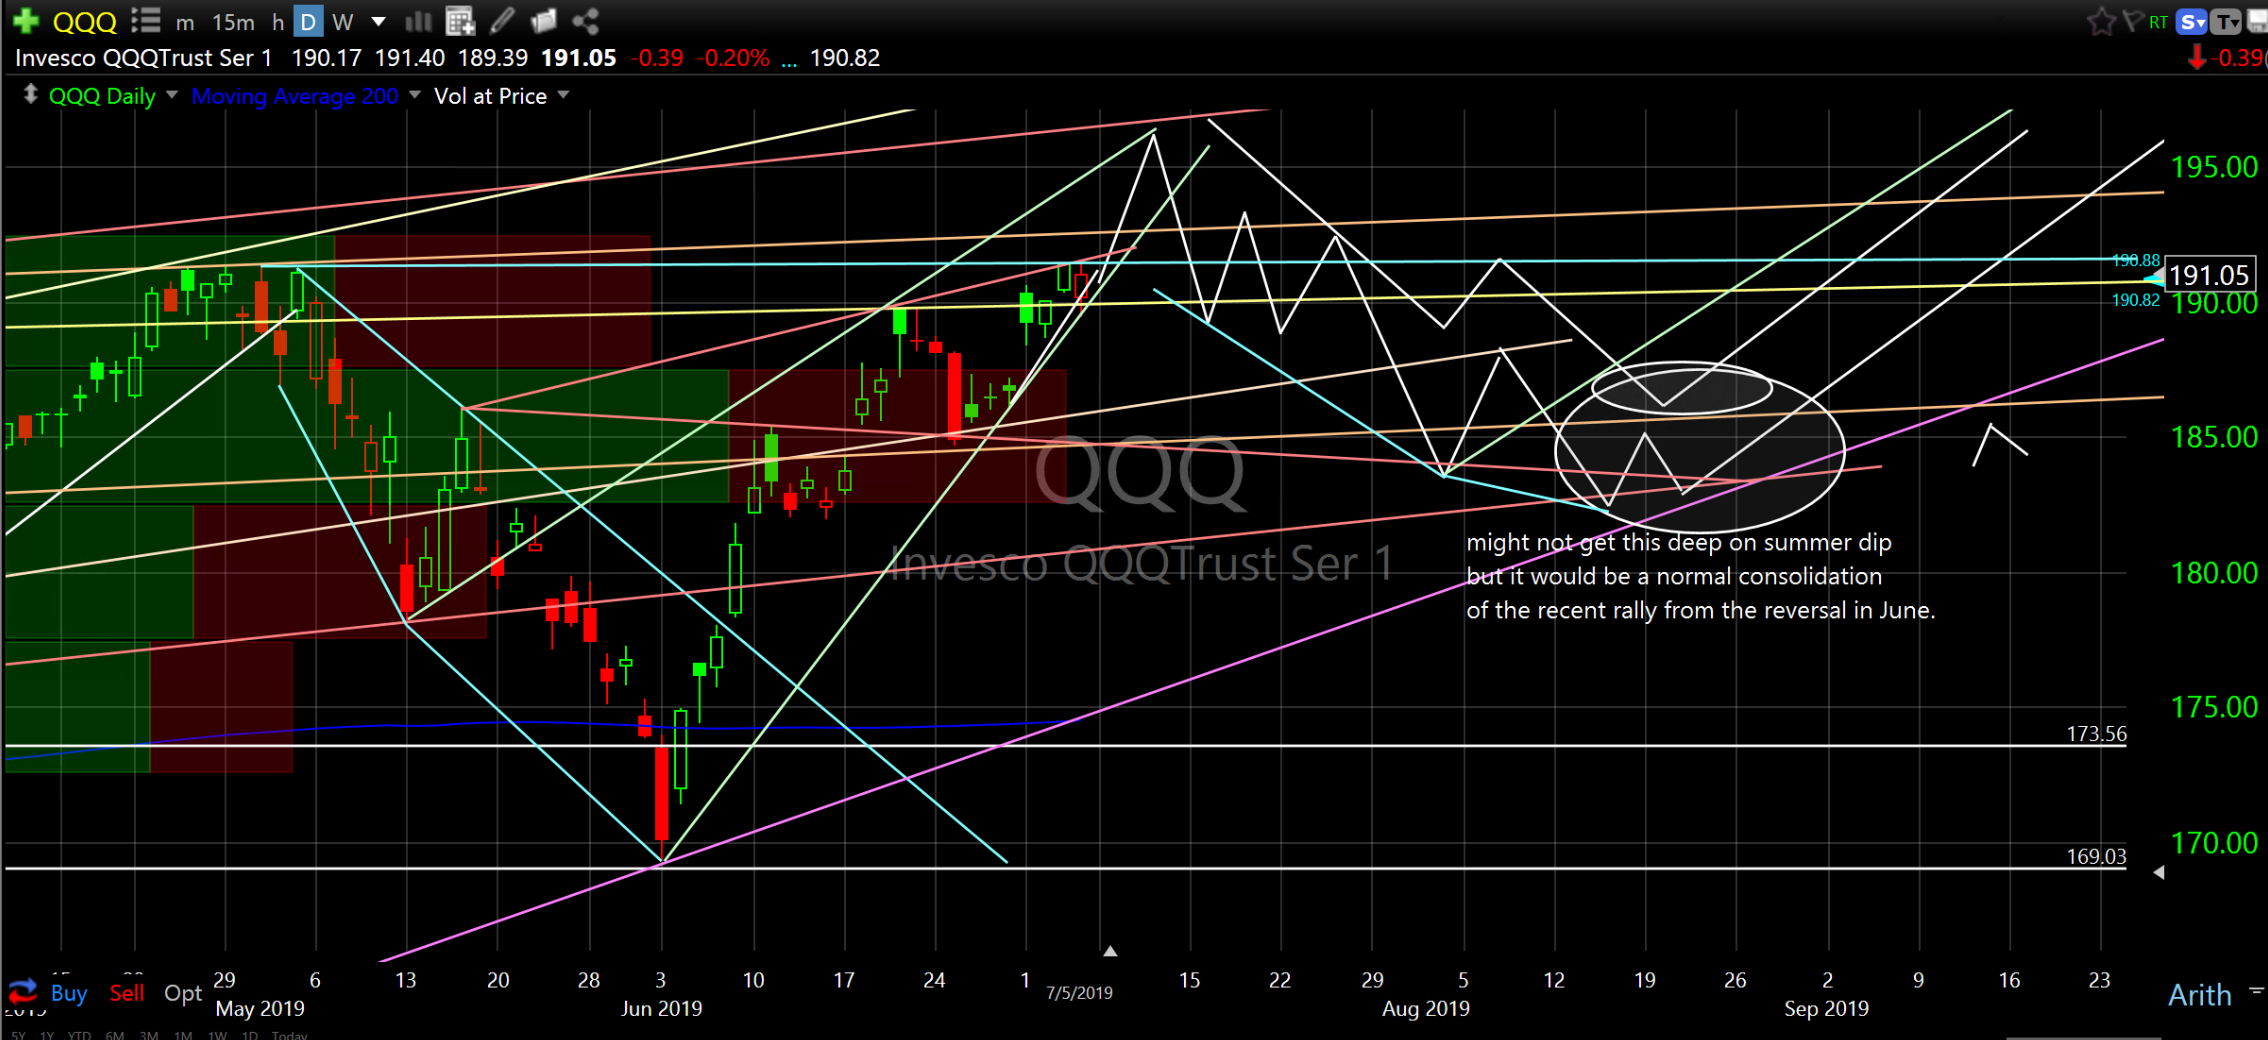
Invesco QQQTrust Ser1 (QQQ) daily

Market Vectors Junior Gold Miners ETF (GDXJ) daily

YETI Holdings Inc (YETI) daily

JB Hunt Transport Services (JBHT) daily

iShares MSCI Japan Index Fund ETF (EWJ) daily

SPDR’s S&P 500 Trust Series ETF (SPY) daily…2016/2019

Grayscale Bitcoin Trust (BTC) (GBTC) daily

NVIDIA Corporation (NVDA) daily

Pinterest Inc (PINS) daily

Turning Point Therapeutics Inc (TPTX) daily

Comparison chart % Stocks Above 200 Day vs (SPY) monthly

Tesla Inc (TSLA) daily

Campbell Soup Co (CPB) daily

CBOE 10 Yr Treasury Yld Index (TNX-X) weekly

At the very least, the projected broader market reversals provide evidence that conclusions can be drawn and projections can be made with high accuracy. The fact that this can even be done should blow your mind. Conclusions/projections are almost to the exact price and date, BEFORE they happened. These are the most significant broader market reversals of 2019 published before they occurred. For those that traded them, just this year the return was 41% without leverage! Good guessing? Tongue firmly planted in cheek.
I have proven the market is not random. Public equity and debt instruments are fractal, driven by repetitive cycles, mean reverting, reflective, measurable, symmetric in time and price and have their own unique expansion, consolidation and collapse patterns which allows for conclusions/projections of when and at what price expansions, consolidations and collapses will occur…on all time frames. I have proven these concepts. If you understand this you are among the .001% of the people on the planet that does. As Ray Dalio would say…well done on being open minded.
I’ve been around long enough to realize that this is pretty cool stuff and I’m old enough to know I have much to learn. I am forever grateful for what I have learned and I appreciate the opportunity to pass it on. OK, enough of that.
Broader Market Charts
And by the way…the expansion did not begin in 2009. It began in 2016. It’s not as old as most people say it is. Giddy up. Hint…Fed inspired.
Let’s review the Broader Markets, Technology Sector, Financial Sector, Energy Sector, Semiconductors, Japan, Transportation Sector and Gold.
Please review and study the following charts for my price projection conclusions drawn from my data collection, observation, measurement, correlation and historical evidence. Or, if you prefer, “good guessing”.
SPDR Dow Jones Industrial Average ETF (DIA) daily
SPDR’s S&P 500 Trust Series ETF (SPY) daily
iShares Russell 2000 Index Fund ETF (IWM) daily

Invesco QQQTrust Ser 1 (QQQ) daily
SPDR’s Select Sector Technology ETF (XLK) daily

SPDR’s Select Sector Financial ETF (XLF) daily

SPDR’s Select Sector Energy ETF (XLE) daily

VanEck Vectors Semiconductor ETF (SMH) daily
iShares MSCI Japan Index Fund ETF (EWJ) daily

SPDR S&P Transportation ETF (XTN) daily

SPDR Gold Trust (GLD) weekly

Remember, these are opinions drawn from historical evidence. I might be wrong, I might be right. Do your own research. Anything is possible. I just do all of this to try and tilt the game in my favor. The big takeaway should be that it is possible to know what price action “should do” and when it doesn’t do what it should do then you have a high probability of knowing something is wrong and this gives you the opportunity to do something about it (exit)…the reverse is true as well (entry). All of this work gives me a sense of confidence to make hard decisions a little easier. For me, this makes it worthwhile.
Have a beautiful week and may your heart be full of Aloha.
This will be posted and archived on website in a day or two as my Chief Formator and Archiver is currently on his honeymoon. It will be much easier to read and refer to as all of the charts will be embedded in body of notes. Thank you for taking the time to read, I appreciate it.
Cheers to good guessing,
Don