Let’s look at the data for clues.
The view from space (macro) shows most of the rest of the world in a free fall beginning in February 2018. The charts below are the Exchange Traded Funds (ETF’s) for China, Hong Kong, Japan, Aussieland, UK, Europe, India, Germany, International and emerging markets. As you can see they all have just cascaded down the entire year and are not in any kind of normal bottoming process (except possibly India) which tells me to expect these ETF’s to continue to trend lower (except India). Historically, there is some directional correlation (not performance) between the US markets and the rest of the world but beginning in early 2018 the divergence is obvious looking at the comparison chart. This is not a positive for the US markets.
China Index ETF (FXI) weekly

Hong Kong Index ETF (EWH) weekly

Japan Index ETF (EWJ) weekly

Australia Index ETF (EWA) weekly

UK Index ETF (EWU) weekly

India Index ETF (INDA) weekly

Germany Index ETF (EWG) weekly

International Index ETF (SCHF) weekly

Emerging Markets ETF (EEM) weekly

Equal Weight S&P 500 Index vs The Rest of the World (RSP) weekly

The ETF’s for the S&P 500 index (SPY), Nasdaq (QQQ) and Russell 2000 (IWM) look a little different than their overseas counterparts. While most of the rest of the world has gone straight down this year US markets have gone wildly sideways.
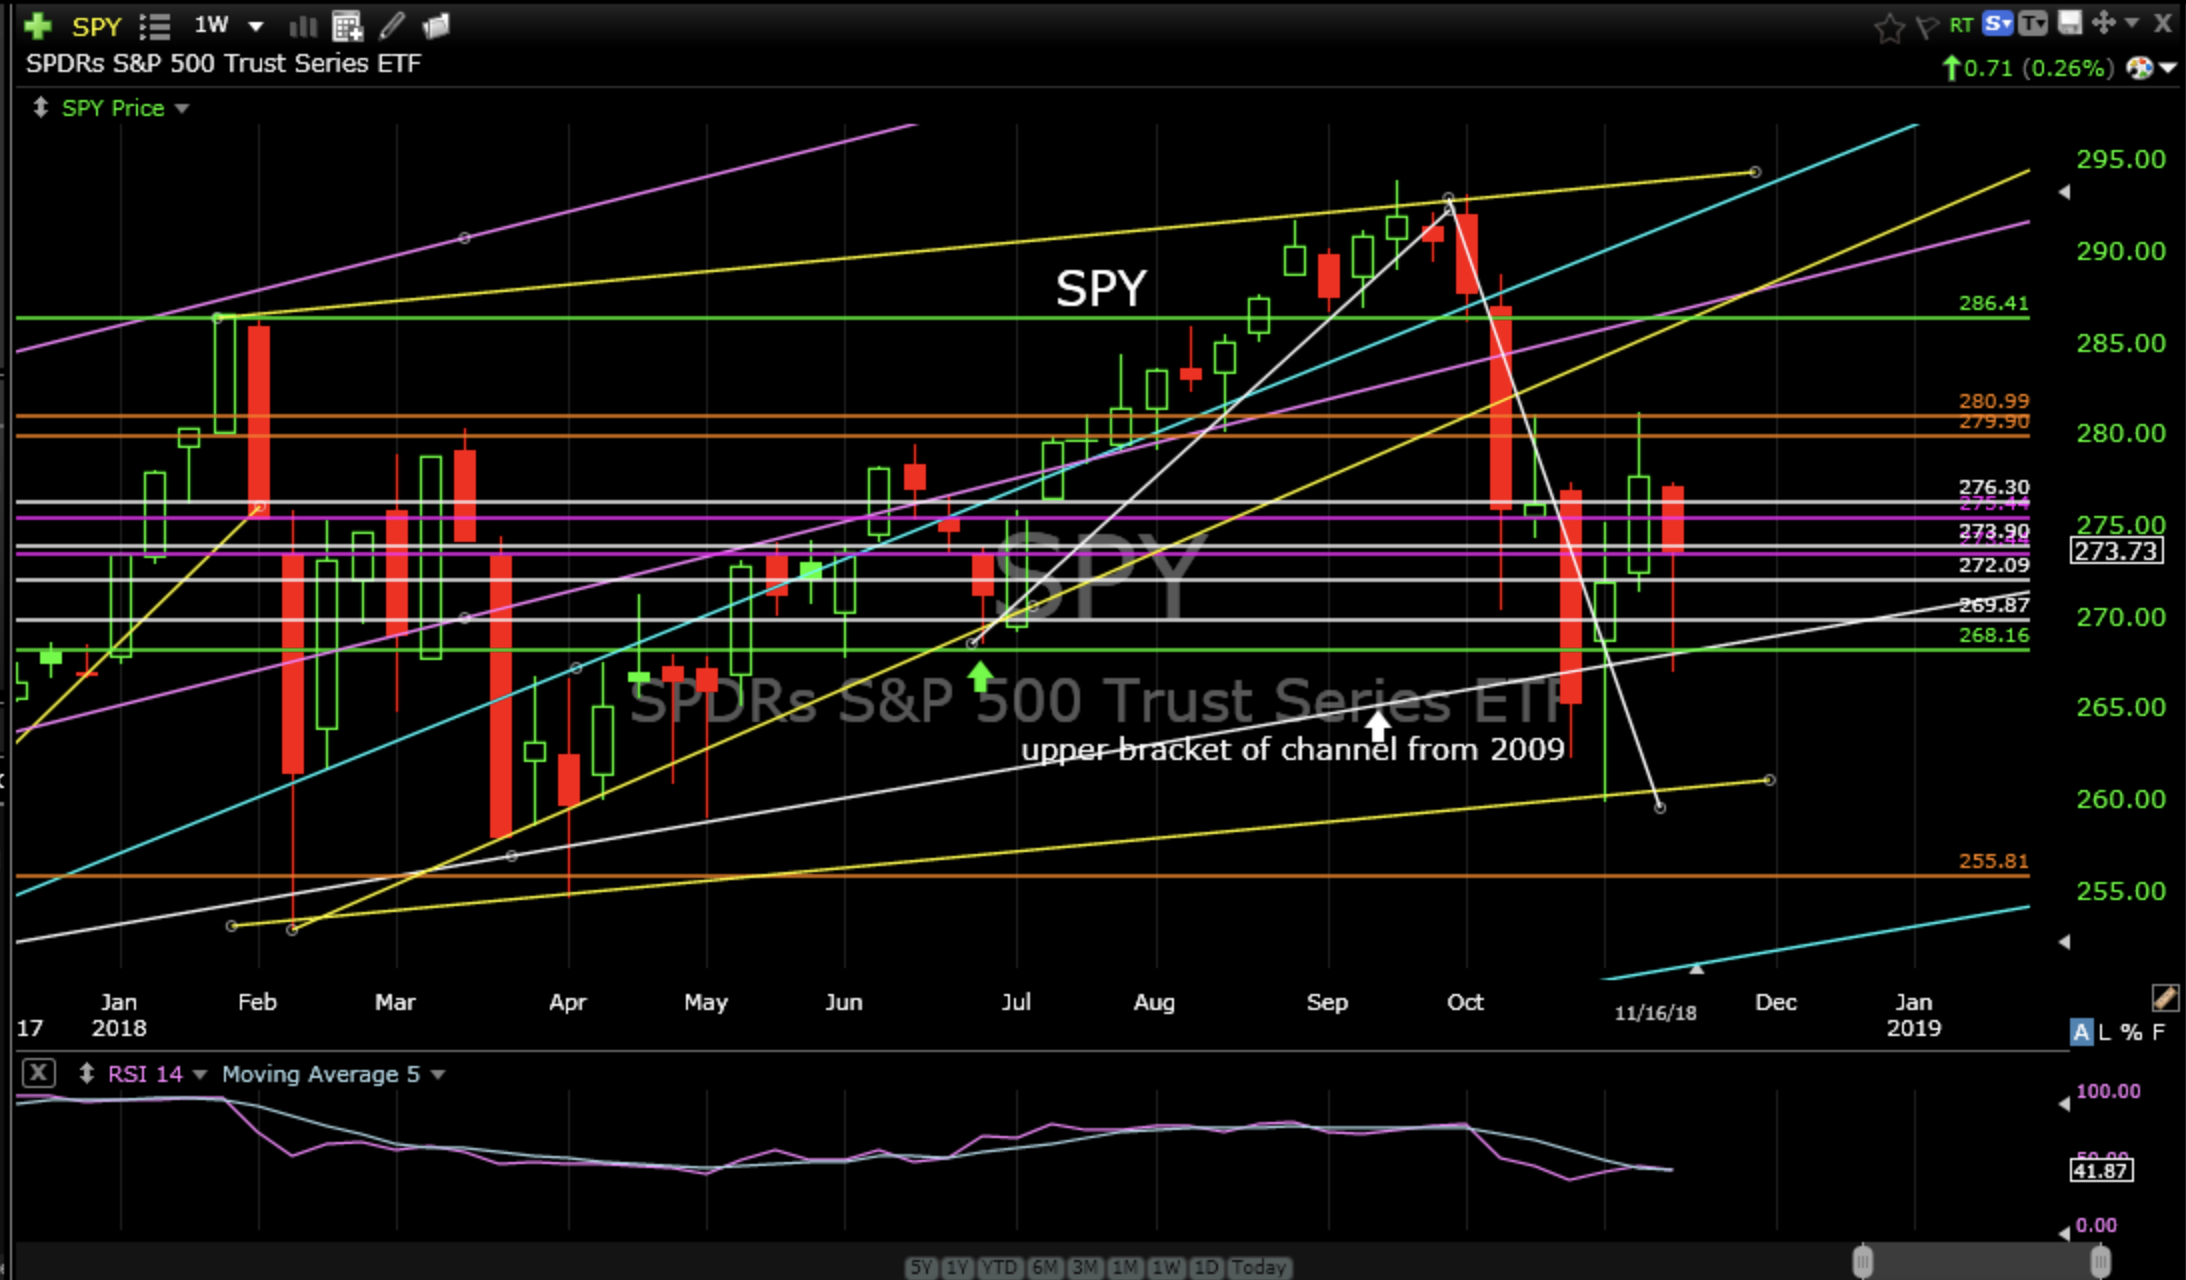
S&P 500 Index ETF (SPY) weekly
Nasdaq (QQQ) weekly

Russell 2000 (IWM) weekly

Re-entering the atmosphere and looking closer at the US it’s obvious there is reversion to the mean going on here as well. While the past three weeks have brought out some bottom fishers there is no clear sign of a sustainable bottom yet, however, we might be close. QQQ is trying to bottom off it’s upper channel bracket from 2009. SPY is trying to do the same while IWM looks like it still wants to work it’s way down a little further into support.
At cruise altitude a look at the S&P 500 sectors is more encouraging. The technology sector ETF (XLK) is still trending down towards the target I outlined on October 21st; rising intermediate support. Currently, this rising support level is about 5% below Friday’s close so it might be close to bottoming out.
Technology Sector ETF (XLK) weekly

The Consumer Discretionary Sector ETF (XLY) is trying to bottom off rising support from 2016 which would be helpful as it has been a leader for years.
Consumer Discretionary Sector ETF (XLY) weekly

The Financial Sector ETF (XLF) broke 2016 rising support earlier this year and got a bid at the 2017 highs which looks a little weak to me.
Financial Sector ETF (XLF) weekly

The Health Care Sector ETF (XLV) broke rising support from 2016 early this year then formed a new rising channel that has supported price very well during this recent correction.
Health Care Sector ETF (XLV) weekly

The Industrial Sector ETF (XLI) has bounced off solid rising support the past couple of weeks so it has an opportunity to bottom in this zone as well.
Industrial Sector ETF (XLI) weekly

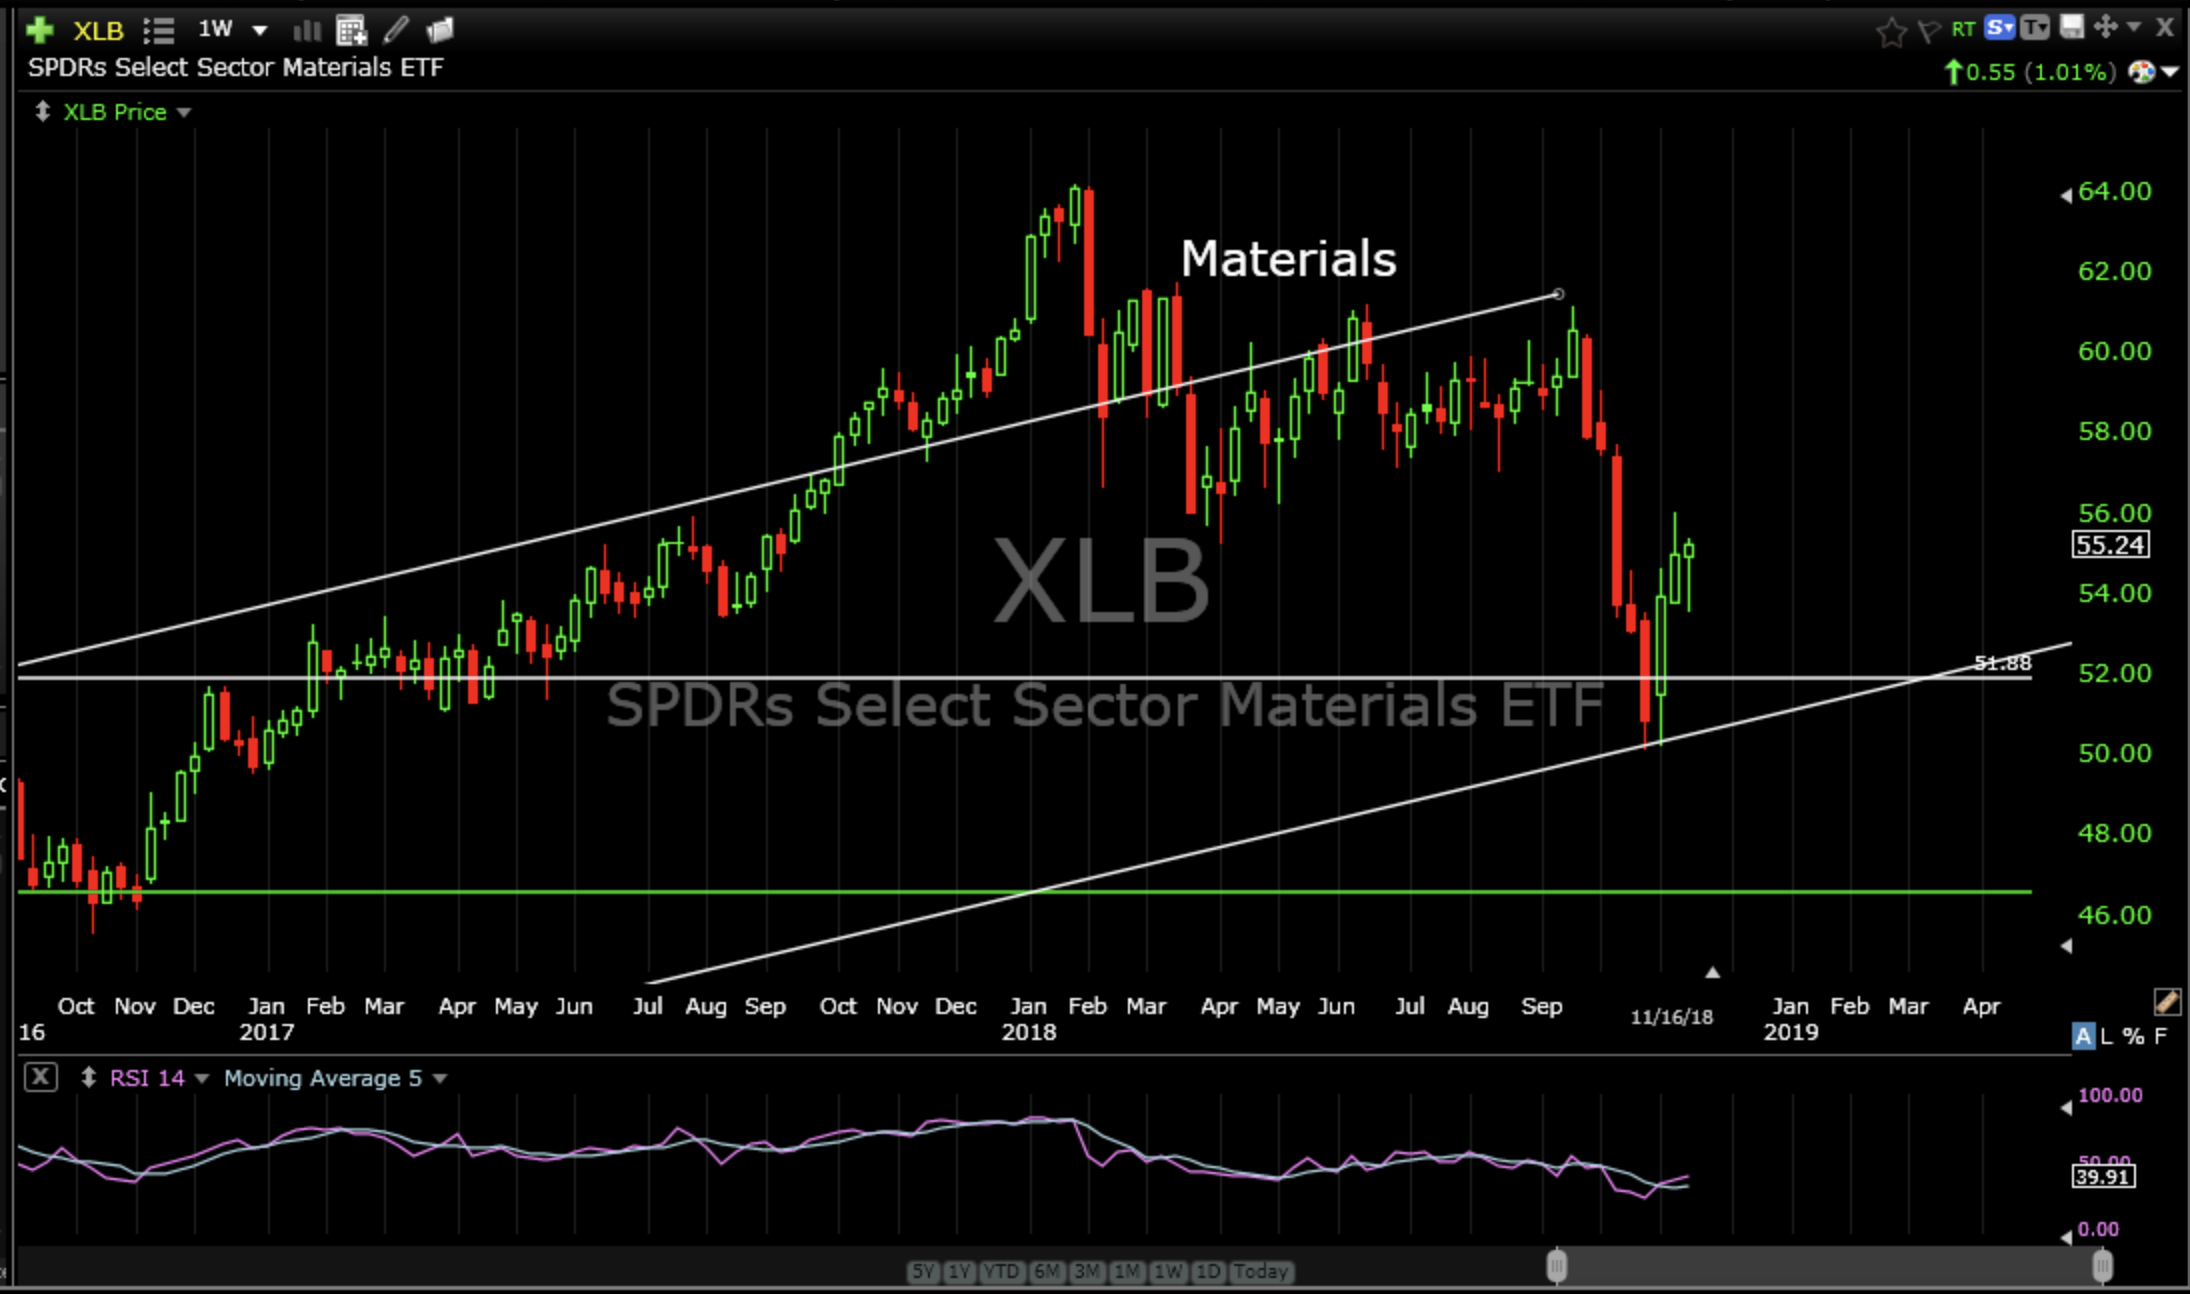
The Materials Sector ETF (XLB) also has an opportunity to bottom as it has been bid up at support as well. It’s not the strongest support but as long as it holds it will help.
Materials Sector ETF (XLB) weekly
The Utilities Sector ETF (XLU) continues to slog higher from its correction earlier this year. It has been jamming up against resistance the past few months but creeps a little higher every week.
Utilities Sector ETF (XLU) weekly

The Consumer Staples ETF (XLP) after breaking rising primary support in early 2018 and bottoming during this past summer at the 2015 consolidation zone has made a nice run higher, however, It needs to break up and through resistance and clear its all time high from earlier this year otherwise it is likely to trade in the 57 to 50 zone for awhile.
Consumer Staples ETF (XLP) weekly

The Energy Sector ETF (XLE) is just a nightmare. If its going to get bid up this is the spot. This market just feels wacky. I don’t want to use the term “rigged” if I can help it.
Energy Sector ETF (XLE) weekly

The newly spun off Communications Services Sector (XLC) is just downright ugly with no bottoming in sight. Can you hear me now?
Communications Services Sector ETF (XLC) daily

The Real Estate Sector ETF (XLRE) remains range bound between 30 and 34 and is currently at the high end of that range so it may tend to pull back over the next few weeks.
Real Estate Sector ETF (XLRE) weekly

While the rest of the world is in a steady decline “our markets” are attempting to bottom. Obviously, this is not an exact science but considering the evidence I would say that if technology (XLK) can hold at rising intermediate support (my original target) it would benefit the entire US market as many sectors do have the appearance of beginning to form a decent bottom. Also, since one of the culprits for the October correction was semiconductors, the semi ETF (SMH) needs to hold 88 otherwise the current mean reversion goings on would likely continue.
Semiconductor ETF (SMH) daily

I don’t think it’s a good time to put on more risk quite yet. Forming a sustainable bottom is a process that takes time. I am encouraged but not convinced.
On a more cellular level there are some bright spots and there are some serious mean reversions going on.
Bright Spots…toe dippers.
Ulta Beauty Inc (ULTA) weekly

New all time closing high with good bounce off rising support. Very pretty.
Zebra Technologies Cp A (ZBRA) daily

It’s like printing money.
Clorox Co (CLX) weekly

Making everyday life better, everyday.
Coca-Cola (KO) weekly

It’s the Real thing.
And, some mean reversion…looming opportunities…some more looming than others.
Facebook Inc (FB) weekly

No likes for this one.
NVIDIA (NVDA) weekly

Ouch! No help in sight. Next stop 133.
Netflix (NFLX) weekly

Like a horror movie but maybe hitting some support. Start popping the popcorn.
No new positions quite yet as rotation appears defensive.
It’s a short trading week in the US due to our Thanksgiving Holiday.
I wish each and every one of you a joy filled week.
Happy Thanksgiving,
Don